
Abstract
Driven by the maritime industry’s need to reduce fuel consumption and emissions, developing lightweight yet strong structural materials is essential. This study investigates resin–talc sandwich core composites for shipbuilding materials. Composites of unsaturated polyester resin (UPR) and talc were fabricated via casting, with resin-to-talc ratios of 50:50 to 90:10 and catalyst concentrations from 0.1% to 1.3%. Mechanical properties were evaluated per Lloyd’s Register standards. The 50:50 ratio with 0.1% catalyst achieved the highest tensile strength (22.11 MPa), while the 80:20 ratio offered optimal overall performance. Lower catalyst levels with 20% talc improved strength, ductility, and reduced voids.
Keywords: catalyst, density, sandwich core, talc, tensile strength, unsaturated polyester resin (UPR)
Outline
1. Introduction
Climate change is a global phenomenon primarily driven by human activities, particularly the extensive use of fossil fuels. This leads to the accumulation of greenhouse gases in the atmosphere, acting like a glass barrier that allows solar radiation to enter but traps heat inside, thereby increasing the Earth's atmospheric temperature1–3).
Indonesia is among the major emitters in the maritime sector in Southeast Asia, highlighting the need for efficiency improvements in its shipping industry. The country has pledged to reduce its greenhouse gas emissions by approximately 26%, reflecting its commitment to tackling climate change4–7). Maritime transportation is a significant contributor to these emissions, with ship operations being a primary source of greenhouse gases. Ship energy efficiency is classified into three main components: the Energy Efficiency Design Index (EEDI), Ship Energy Efficiency Management Plan (SEEMP), and Energy Efficiency Operational Indicator (EEOI), all aimed at reducing ship emissions8–11). The EEDI is a regulatory framework based on ship design performance, allowing flexibility in the application of specific designs or technologies to achieve a set level of energy savings. Its primary objective is to encourage the adoption of both proven and innovative technologies in ship design and construction. In essence, EEDI represents the ratio of total CO₂ emissions produced by a ship to the transport work units12,13). While these regulations provide a foundation for improving ship efficiency, further design innovations are required to optimize fuel consumption and reduce emissions.
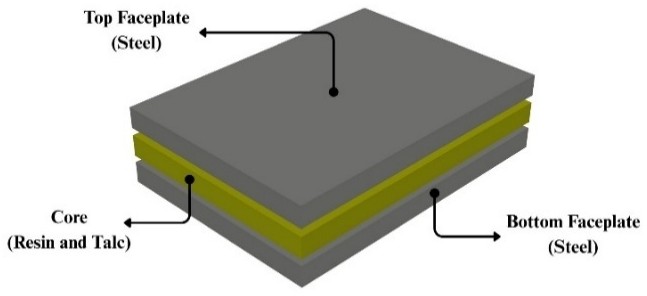
Fuel efficiency is a critical consideration in ship design. Reducing material weight while increasing structural strength is essential for lowering resistance, thereby decreasing engine power demand and fuel emissions14–16). Sandwich panels are one alternative engineering approach for ship structures that aim to reduce weight while enhancing strength. Among the various structural innovations, the Sandwich Plate System (SPS) is particularly effective. The SPS is a lightweight composite material consisting of two metal plates (faces) separated by an elastomer core, as shown in Figure 1. The two metal plates are joined together using a perimeter bar at the edge, and the core material between the plates is filled through an injection process17–20).
Extensive research was conducted to explore alternative core materials for sandwich panels, aiming to improve strength, durability, and weight efficiency. Over the years, these studies examined both natural and synthetic fillers, each with specific objectives and performance outcomes.
Research on organic natural fillers included the use of eggshell powder21), clamshell powder22), rice husk23), and sawdust24) as the main filler in the sandwich core, all aiming to assess tensile strength and density. The eggshell powder study21) examined variations of 0–40% filler content combined with synthetic resin and 1% catalyst. Similarly, clamshell powder research22) explored the same filler percentage, synthetic resin, and catalyst level. Rice husk filler studies23) applied variations of 0–20% with a resin epoxy–hardener ratio of 3:1 (in grams), while sawdust-based cores24) used 5–20% variations with the same resin–hardener ratio. These works showed promising results, with tensile strength values and densities meeting Lloyd’s Register Provisional Rules (2024) minimum standards25), highlighting their potential for lightweight ship structures.
In addition to natural materials, mineral fillers combined with synthetic resins were also investigated to enhance mechanical properties. For synthetic resin with mineral fillers, Utomo26,27) developed cores using polyurethane foam, polyresin, and synthetic resin combined with talc filler. The optimal formulation—50% resin, 50% talc, and 0.3% catalyst—achieved the highest tensile strength of 24.75 MPa. Building upon this, Arianto et al28). investigated a steel/resin–talc sandwich configuration, which aimed to reduce weight in ship structures. This study used a 90% unsaturated polyester resin, 10% talc, and 0.3% catalyst core, with steel plates as the face material. The focus was on bending behavior, revealing yield and maximum stresses of 22.88 MPa and 28.63 MPa, respectively, and identifying failure mechanisms starting with mid-span flexural cracks, followed by core–face delamination and complete core fracture.
Recent studies advanced understanding of sandwich core materials, especially regarding sustainable fillers and catalyst optimization for marine applications. Mineral fillers such as talc remained widely used due to their compatibility with unsaturated polyester resins and their ability to improve stiffness with minimal weight increase28). Sustainable fillers from agricultural or household waste, such as clamshells, rice husk, and sawdust, also showed high potential when used in moderate proportions (typically 10–30% by weight), with peak strength often occurring at mid-range compositions before declining due to agglomeration or poor dispersion21,23,24). These bio-based composites not only improve mechanical performance but also contribute to environmental sustainability. Importantly, many such formulations satisfied key standards from Lloyd’s Register Provisional Rules (2024)25), including tensile strength of at least 20 MPa and density above 1000 kg/m³, making them viable for marine structures26).
Beyond filler type and composition, catalyst concentration significantly influences cure behavior and void formation. While most studies fixed catalyst loading at 0.3%, evidence suggests that deviations from this value could impact mechanical strength and internal defects, particularly in talc-filled resins27). However, systematic evaluations on how varying catalyst levels interact with filler content remain scarce. This absence of parametric insight limits the ability to optimize formulations for structural reliability, void minimization, and lightweight efficiency. These are three critical factors in modern ship construction.
Among various fillers, talc demonstrated consistent mechanical behavior, low moisture absorption, and high compatibility with unsaturated polyester resin, making it highly suitable for marine applications. While organic fillers such as eggshell, rice husk, and sawdust meet mechanical requirements, their natural variability, hydrophilic nature, and limited marine durability present challenges. Furthermore, most resin–talc studies only examined narrow ranges of filler and catalyst content, typically fixed at 10% talc and 0.3% catalyst28). This leaves a clear gap for systematic exploration. In contrast, organic fillers have already been evaluated across a wider range of compositions. Therefore, resin–talc systems offer both industrial relevance and significant research potential for optimization in lightweight, high-strength marine sandwich panels.
While numerical simulations are indeed widely used due to their lower cost and faster implementation, they often rely on simplified assumptions and idealized boundary conditions that may not accurately capture the true behavior of composite materials, particularly those involving complex filler–resin interactions29,30) In the case of resin–talc composites, experimental testing provides direct and reliable measurements of physical and mechanical properties such as tensile strength, void content, and density, which are difficult to predict precisely using numerical models alone31). Moreover, experimental data are essential for validating numerical models to ensure that simulations reflect real-world performance32). Therefore, experimental testing was selected in this study to obtain accurate and practical insights, particularly for marine structural applications where mechanical reliability is critical.
This study addresses the current research gap by systematically evaluating how variations in catalyst concentration and talc content influence the mechanical performance of resin–talc sandwich core composites for marine applications. The investigation considers catalyst concentrations of 0.1%, 0.5%, 0.7%, 1.0%, and 1.3% applied to a composite core material with a resin-to-talc ratio of 50:50, while excluding 0.3% as it has been extensively reported in previous studies. In addition, talc contents of 10%, 20%, and 30% are examined to determine the most appropriate mixture. Experimental evaluations include density, tensile strength, and void content, which are compared against the Lloyd’s Register Provisional Rules (2024) for Sandwich Panel Construction in Ship Structures25). The objective of this study is to optimize resin–talc sandwich core composites by systematically investigating the influence of catalyst and talc content on mechanical properties relevant to shipboard structural applications.
2. Material and Methods
2.1. Materials
The main materials used in this study were unsaturated polyester resin (UPR), catalyst, and talc filler. The core resin was unsaturated polyester resin (UPR), which is lightweight, strong, stiff, and chemically resistant33). UPR is a thermosetting polymer: once cured it cannot be remelted or returned to its original form34,35). The resin used in this study was supplied by PT Justus Sakti Raya (Indonesia) under product code YUKALAC 157 BQTN‑EX.
A catalyst accelerates chemical reactions without being consumed36–38). In composite manufacturing, catalysts control the resin curing rate and influence the final mechanical properties and void formation. In UPR production, catalysts accelerate polymerization and transform the resin from a liquid to a solid. Common catalysts for UPR include methyl ethyl ketone peroxide (MEKP) and cobalt naphthenate.
Talc is a magnesium silicate hydrate with a chemical composition of Mg3Si4O10(OH)239–41). Talc is commonly used as a mineral filler to reduce production costs and to improve the chemical and physical properties of polymer composites42,43). It increases stiffness while retaining some flexibility, making it particularly suitable for sandwich core applications. Talc is widely used in paper, paint, ceramics, cosmetics, and polymer industries44). As a fine white powder, talc can act as a thixotropic filler or putty when mixed with resin, increasing viscosity and contributing to a harder yet flexible matrix.
2.2. Specimen Preparation
The core sandwich specimens were fabricated using the casting method. Two sets of experiments were conducted: (1) a fixed composition of 50% resin and 50% talc with catalyst contents of 0.1%, 0.5%, 0.7%, 1%, and 1.3%, and (2) talc content variations of 10%, 20%, and 30%, each using the optimum catalyst content identified from the first experiment. For each composition, five specimens were prepared, resulting in 25 specimens for the fixed resin–talc ratio and 15 specimens for the talc variation series, yielding a total of 40 specimens. The specimen dimensions followed the ASTM D638 Type I44).
1)The fabrication process consisted of the following steps:
Preparation: A clean work area and all necessary materials and equipment (resin, talc, catalyst, mixer, and molds) were prepared.
2)Mixing: Resin and talc were combined in a mixing container and mechanically stirred for 5 min until visually homogeneous. The catalyst was then added at the specified concentration and stirred for 1 min. Mixing was performed at room temperature and care was taken to minimize air entrapment.
3)Casting: The resin–talc–catalyst mixture was poured into ASTM D638 Type I molds. Casting began at one corner and proceeded slowly to reduce entrapped air44).
4)Curing: Specimens were cured at ambient laboratory conditions (25 ± 2°C) for up to 48 hours, depending on the catalyst concentration used.
5)Quality check of mixture: Homogeneity was assessed visually during and after mixing. After curing, each specimen was inspected for uniform filler distribution and visible voids. Specimens exhibiting poor dispersion, resin‑rich regions, talc agglomeration, or visible voids were excluded from mechanical testing.
Cured specimens were stored at ambient conditions and tested within 48 hours.
2.3. Experimental Testing Procedure
Standardized tests and acceptance criteria were established according to the Lloyd's Register Provisional Rules (2024)29), and are summarized in Table 1. Measured properties included density, ultimate tensile strength (UTS), and elongation. Reactivity, density, and tensile tests were conducted on the resin–talc composites. Specimen dimensions and test procedures were detailed in Figure 2.
Table 1: Standardized Testing and Criteria for Sandwich Panels (Lloyd's Register Provisional Rules, 2024)25)
| Test | Standard | Criteria |
|---|---|---|
| Density | ISO 845 | ≥1000 kg/m3 at RT |
| Tensile Stress | ISO 527 or ASTM D 412 | ≥20 MPa at RT ≥5 MPa at +80°C |
RT = Room temperature in oC
2.4. Density Test
Density was measured according to ISO 84545). Density is a key parameter affecting structural integrity, weight, and overall composite performance. Specimens were sized to allow volume calculation, with a minimum total volume of 100 cm³ (1 × 10⁻⁴ m3). Each test used at least five specimens. Specimen dimensions were measured in millimeters (mm) or meters (m) with a minimum of three separate measurements for each dimension. The density, ρ, of the test specimens (kg/m³) was calculated using the following equation:
The density value, ρ, was the average of the densities obtained for each specimen.
2.5. Uniaxial tensile tests
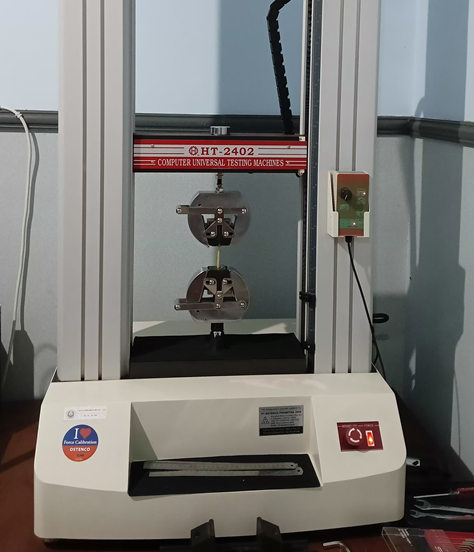
Uniaxial tensile tests were performed to determine UTS and yield strength relative to the applicable standards. Tests were conducted at the FMIPA Laboratory, University of Jember, Indonesia. A Universal Testing Machine (HT‑2402) with a 20‑kN capacity was used46). A crosshead speed of 1 mm/min was applied, with a gauge length of 50 mm. Tensile specimen dimensions followed ASTM D638‑14647), and are shown in Figure 2. Specimen thickness for Type I specimens was 3.2 mm ± 0.4 mm (0.13 in. ± 0.02 in.). Figure 3 shows the test setup, including load cell and extensometer placement. Applied force was measured using the load cell. Reported tensile values were averaged over five specimens. UTS was determined from the maximum stress on the engineering stress–strain curve.
The elastic modulus was obtained from the initial linear slope of the stress–strain curve. This parameter indicates material stiffness and helps predict elastic deformation under load. Yield strength was determined using a 0.2% offset method. Toughness, defined as the energy absorbed prior to fracture, was calculated as the area under the stress–strain curve. Fracture energy was reported as the energy required to propagate the fracture. Additional properties, including hardness and elongation at break, were also determined from the stress–strain data48). These mechanical properties are essential for assessing material performance under service loads and for structural design.

3. Result and Discussion
3.1. Reactivity Test
The reactivity test measures the rate of chemical reactions during material fabrication. In this study, the test was used to evaluate the curing rate of sandwich cores made from resin, catalyst, and talc. It was conducted to determine how quickly and efficiently the material reacted and hardened after mixing. Catalyst variations of 0.1%, 0.5%, 0.7%, 1%, and 1.3% were tested with a fixed composition of 50% resin and 50% talc. The results are presented in Table 2.
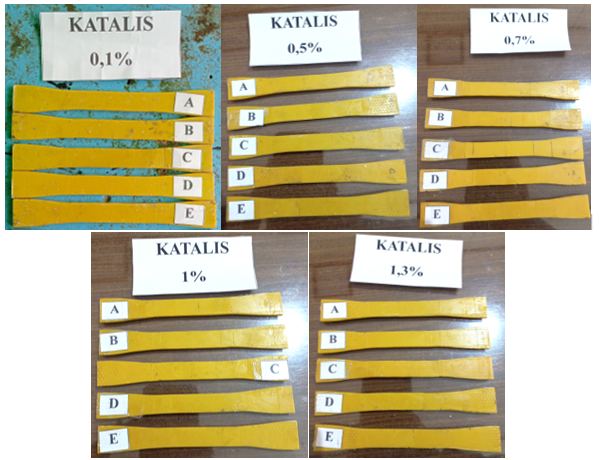
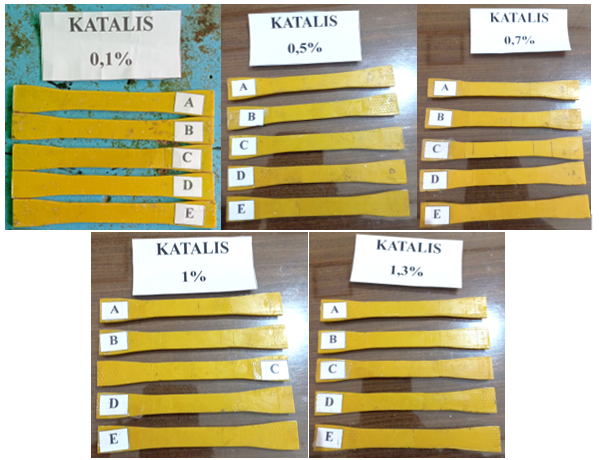
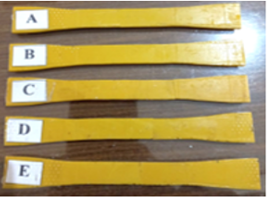
The results showed that higher catalyst concentrations accelerated the curing reaction, causing the resin to harden more quickly. However, rapid curing tended to increase the formation of air bubbles or cavities, which could later reduce tensile strength. In contrast, lower catalyst contents required longer curing times, allowing the resin to distribute more evenly throughout the mixture and resulting in improved stiffness after hardening. The visual appearance of each specimen after curing for the respective catalyst variations is shown in Figure 4.
Mechanistically, catalyst addition shortens gel time and elevates viscosity earlier in the cure. Under these conditions, and in a particulate-filled system (50% talc), air bubbles introduced during mixing have less time to rise and escape, while resin wetting of talc surfaces becomes incomplete. Both effects increase void content and interfacial defects that later diminish tensile strength.
Table 2: Reactivity Test Results
| Catalyst Variation | Reactivity Time |
|---|---|
| 0.1% | 48 hours |
| 0.5% | 18 hours |
| 0.7% | 6 hours |
| 1% | 3 hours |
| 1.3% | 2 hours |


3.2. Tensile Strength in Catalyst Variations
Tensile testing was performed to determine the ability of the material to withstand tensile forces before fracture or permanent deformation. For sandwich core applications, high tensile strength and adequate elasticity are critical to ensuring structural durability in ship construction. The tensile properties of cores made with 50% resin, 50% talc, and catalyst variations of 0.1%, 0.5%, 0.7%, 1%, and 1.3% are presented in Table 3.
Yield strength refers to the maximum stress a material can sustain before permanent plastic deformation, while tensile strength denotes the maximum stress it can withstand before fracture. Based on Table 3, the optimal performance was achieved with the 0.1% catalyst variation, which consistently produced high yield and tensile strengths. The average tensile strength exceeded the minimum requirement of 20 MPa specified in the Lloyd's Register Provisional Rules (2024).
Lower catalyst content resulted in higher tensile strength, likely due to slower curing, which promotes more uniform resin flow and improved crosslink formation, thereby minimizing voids and internal stresses typically caused by rapid exothermic reactions.
As demonstrated by Barakat et.al.49), the concentration of catalyst played a crucial role in influencing the cure kinetics of unsaturated polyester resin systems. Their findings suggest that excessively high initiator levels can accelerate the crosslinking process to the extent that an inhomogeneous polymer network is formed, ultimately reducing mechanical integrity. In a similar vein, Farsane et al.50) emphasized that while increasing the catalyst concentration shortens gelation time, overly rapid curing may cause internal stresses and void formation due to the sudden release of heat during polymerization.
Elongation, defined as the percentage increase in length prior to fracture, indicates the material’s capacity for plastic deformation. Table 4 shows that specimens with 0.1% catalyst exhibited the highest elongation.
As illustrates in Figure 5, elongation decreased as catalyst concentration increased. The tensile response versus catalyst content is non-monotonic. It peaks at 0.1%, drops to a minimum at 0.5%, likely due to under-cure and insufficient crosslink density, and then partially recovers at 1.3% as conversion increases. However, high initiator levels still induce fast gelation and exotherm-driven defects such as voids and residual stresses; consequently, the tensile strength at 1.3% remains below the optimum obtained at 0.1%. The 0.1% catalyst variation achieved
Table 3: Tensile Test Results of 50% Resin, 50% Talc, and Catalyst Variations
| Catalyst Variation | Yield Strength (MPa) | Average Yield Strength (MPa) | Tensile Strength (MPa) | Average Tensile Strength (MPa) | ||||||||
|---|---|---|---|---|---|---|---|---|---|---|---|---|
| A | B | C | C | E | A | B | C | D | E | |||
| 0.1% | 19.93 | 20.73 | 8.71 | 21.14 | 22.27 | 18.56 | 21.78 | 21.87 | 20.20 | 22.89 | 23.80 | 22.11 |
| 0.5% | 6.98 | 2.66 | 7.15 | 8.82 | 6.86 | 6.49 | 16.79 | 6.17 | 17.27 | 15.19 | 16.28 | 14.34 |
| 0.7% | 15.91 | 10.27 | 8.38 | 15.33 | 16.86 | 13.35 | 17.11 | 16.33 | 17.51 | 15.33 | 18.19 | 16.89 |
| 1% | 7.07 | 16.81 | 15.76 | 4.98 | 6.94 | 10.31 | 17.00 | 17.72 | 16.60 | 11.60 | 14.51 | 15.49 |
| 1.3% | 6.24 | 19.59 | 6.32 | 8.35 | 7.48 | 9.60 | 16.19 | 21.12 | 16.02 | 18.82 | 18.50 | 18.13 |
Table 4: Elongation Result of 50% Resin, 50% Talc, and Catalyst Variations
| Catalyst Variations | Elongation per Specimen (%) | Average Elongation (%) | ||||
|---|---|---|---|---|---|---|
| A | B | C | D | E | ||
| 0.1% | 5.15 | 6.62 | 4.57 | 5.37 | 5.22 | 5.39 |
| 0.5% | 3.98 | 2.52 | 4.39 | 4.24 | 4.30 | 3.89 |
| 0.7% | 4.05 | 4.64 | 4.40 | 4.48 | 5.28 | 4.57 |
| 1% | 4.41 | 4.29 | 4.31 | 2.99 | 3.85 | 3.97 |
| 1.3% | 3.15 | 4.44 | 4.14 | 3.88 | 3.88 | 3.90 |
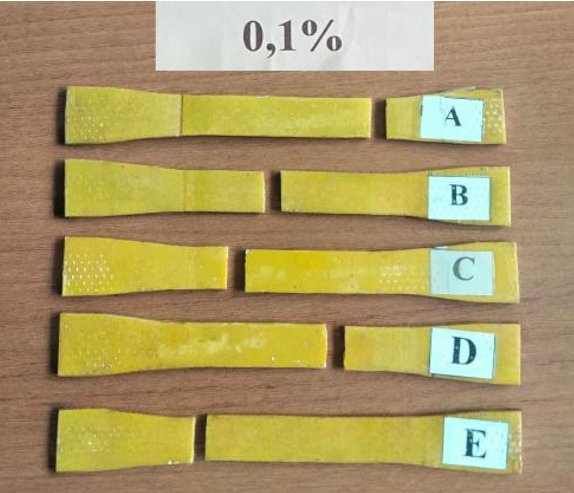
yield and tensile strengths of 18.56 MPa and 22.11 MPa, respectively, along with 5.39% elongation—indicating superior resistance to permanent deformation and a high capacity to sustain tensile loads in ship structures requiring long-term durability. The result of tensile test in 0.1% catalyst variation can be seen in Figure 6.
The observed reduction in tensile strength at higher catalyst contents is closely related to curing kinetics and processing-induced defects. Excessive catalyst accelerates polymerization and shortens gel time, which restricts resin flow and reduces the time available for entrapped air to escape. As a result, void content increases (from 19.23% at 0.1% catalyst to 23.57% at 1.0%, Table 8), and effective load-bearing cross-section is reduced, explaining the drop in tensile strength (from 22.11 MPa at 0.1% to 15.49 MPa at 1.0%, Table 3). Conversely, lower catalyst levels (0.1%) permit more uniform resin wetting of talc particles and more complete network formation, producing lower void content and higher tensile performance. Therefore, the cure-controlled balance between sufficient conversion and defect minimization underpins the optimal performance observed at 0.1% catalyst.
These findings are consistent with the work of Barakat et al49), who reported that the amount of catalyst plays a decisive role in determining the total conversion degree of a resin system. Higher catalyst concentrations accelerate the polymerisation reaction but also intensify the exothermic heat release, which may lead to the

development of internal stresses and the formation of voids. Conversely, lower catalyst levels slow the curing process, allowing more time for the resin to flow, fill micro-gaps, and form a more homogeneous crosslinked network. This uniform network reduces residual stresses and void content, thereby improving the composite’s mechanical integrity. Such behaviour is also associated with increased crosslink density—indicating more complete curing—which correlates with enhanced tensile strength and resistance to deformation.
The present results also align with the observations of Hestiawan et al.51), who found that the tensile strength of polyester resin composites tends to decrease when the MEKP catalyst exceeds 1%, with the highest performance achieved near 1%. Notably, our optimal formulation with 0.1% catalyst not only produced the greatest tensile strength and elongation in this study but also exceeded the minimum 20 MPa tensile strength specified in the Lloyd’s Register Provisional Rules (2024)25). This confirms that our formulation meets established engineering benchmarks and demonstrates its suitability for structural applications.
Although the 0.1% catalyst variation yielded the highest tensile strength and elongation, it is plausible that a lower catalyst content, such as 0.05%, could potentially result in even better performance by further enhancing resin flow and crosslink uniformity. However, 0.1% was selected in this study as the minimum threshold based on preliminary observations and practical considerations in resin gelation time, as catalyst levels below this point risk incomplete curing or significantly prolonged setting times that could hinder practical manufacturing workflows. Moreover, no standardized literature currently recommends values below 0.1% for unsaturated polyester resin–talc systems in structural applications. Future research is recommended to experimentally investigate the effect of catalyst concentrations below 0.1%, including 0.05%, to explore the potential for further mechanical improvements and optimization.
3.3. Tensile Strength in Resin-Talc Variations
Following identification of 0.1% as the optimal catalyst level, tensile testing was conducted on specimens with different resin-to-talc ratios: 70:30, 80:20, and 90:10. The results are given in Table 5.
The minimum tensile strength limit is 20 MPa or 20 N/mm2 at room temperature according to the standardization and testing criteria for the Lloyd's Register Provisional Rules (2024). Thus, based on the tensile test results in Table 5, it was found that all variations of the resin:talc composition (70:30, 80:20, and 90:10) were suitable as sandwich cores because the average tensile strength values exceeded the minimum limit specified by the Lloyd's Register Provisional Rules (2024).
In the 90% resin : 10% talc composition, specimens
Table 5: Tensile Test Results for Resin:Talc 70%:30%, 80%:20%, 90%:10% and Catalyst 0.1%
| Resin Talc Variation | Yield Strength (MPa) | Average Yield Strength (MPa) | Tensile Strength (MPa) | Average Tensile Strength (MPa) | ||||||||
|---|---|---|---|---|---|---|---|---|---|---|---|---|
| A | B | C | C | E | A | B | C | D | E | |||
| 70%:30% | 25.01 | 18.72 | 18.42 | 20.93 | 18.99 | 20.41 | 25.06 | 19.54 | 18.90 | 23.70 | 20.25 | 21.49 |
| 80%:20% | 27.37 | 28.34 | 21.28 | 22.64 | 18.44 | 23.61 | 28.87 | 30.03 | 24.19 | 24.54 | 21.35 | 25.80 |
| 90%:10% | 26.86 | 27.78 | 33.32 | 28.26 | 32.55 | 29.75 | 28.85 | 30.94 | 36.22 | 29.68 | 34.63 | 32.06 |

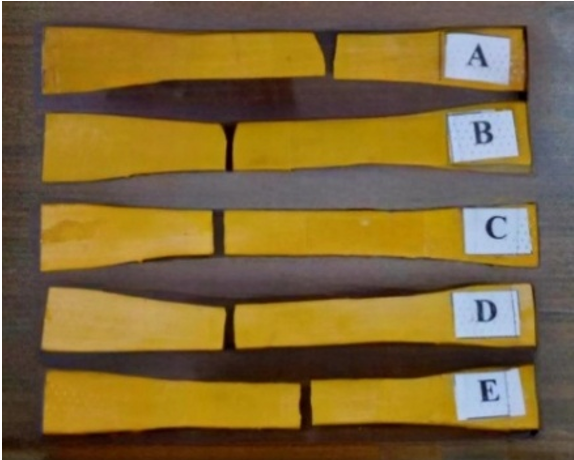

experienced catastrophic failure in the grip region and fractured into pieces during testing, and this behaviour would impede manufacturing if the material were used. The results indicate that the material with a composition of 0.1% catalyst and a resin-to-talc ratio of 90:10 exhibits a relatively brittle behavior.
The core sandwich materials with higher talc content in the resin-to-talc ratios of 70:30 and 80:20 successfully eliminated fractures and breaks in the grip region observed in the material. Although the yield strength and tensile strength values were lower, they remained above the minimum standards set by the Lloyd's Register Provisional Rules (2024). These findings further suggest that sandwich cores with resin-to-talc ratios of 70:30 and 80:20 exhibit greater ductility compared to those with a ratio of 90:10 (Figure 7).
The results of the tensile test, summarized in Table 6, indicated that a lower talc content led to an increase in elongation. It was observed that the 90% resin : 10% talc variation exhibits the highest elongation. However, despite achieving the highest elongation value (10.74%), this composition fractured during the tensile test, indicating extreme brittleness. Based on Figure 8, the 90% resin : 10% talc composition showed the highest tensile strength and elongation values. However, this formulation also exhibits brittle failure, highlighting a trade-off between strength and ductility.
Among the 90% and 80% resin variations, the optimal composition was found to be 80% resin : 20% talc, which exhibited an elongation of 10.64%, closely approaching the 90% resin : 10% talc variation. However, this composition remained structurally strong and did not fracture during the tensile testing process. This behavior is attributed to the slower and more controlled polymerization reaction facilitated by the lower catalyst concentration, allowing for the formation of cross-linked bonds that enhance flexibility and resistance to plastic deformation. The resulting non-rigid structure enables the material to endure greater stress and deformation without fracturing, making it particularly suitable for ship structural applications.
The observed trend in mechanical behavior across different resin-to-talc ratios is closely related to the role of talc as an inorganic filler. As the talc content increases from 10% to 30%, the composite density also increases, which is typical due to the higher specific gravity of talc compared to resin.
Table 6: Elongation Variation of Resin:Talc 70%:30%, 80%:20%, 90%:10% and Catalyst 0.1%
| Resin : Talc Variations | Elongation per Specimen (%) | Average Elongation (%) | ||||
|---|---|---|---|---|---|---|
| A | B | C | D | E | ||
| 70%:30% | 8.91 | 9.62 | 8.93 | 8.43 | 8.64 | 8.91 |
| 80%:20% | 10.14 | 9.37 | 11.36 | 10.36 | 11.99 | 10.64 |
| 90%:10% | 12.22 | 9.71 | 10.99 | 11.92 | 8.85 | 10.74 |

However, excessive filler content can lead to poor wetting and agglomeration, resulting in higher void formation and reduced mechanical performance. This is evident in the 70% resin : 30% talc variation, which, despite its higher density, exhibited the lowest tensile strength and higher void content.
Previous studies49,52) also reported that excessive filler loading beyond an optimal threshold leads to filler-matrix debonding and stress concentration sites, ultimately reducing tensile properties. Conversely, the 90% resin 10% talc composition showed the highest tensile strength and lowest voids, but suffered from extreme brittleness, making it impractical for structural applications. These findings suggest that while increasing talc content can reinforce the composite up to a certain point, excessive amounts disrupt the polymer network and compromise mechanical integrity. The 80% resin : 20% talc formulation offers the most balanced performance, with sufficient strength, ductility, and structural integrity—meeting the Lloyd’s Register Provisional Rules (2024)25). These results are consistent with prior studies on particulate-filled composites, which highlight that optimal filler loading maximizes interfacial bonding and minimizes defects 53,54).
3.4. Density
The minimum density limit at room temperature is 1000 kg/m3 or 1 g/cm3 according to the standardization of testing and criteria for sandwich panels the Lloyd's Register Provisional Rules (2024). The density was calculated using equation (1), based on the measured volume of 6.02×10⁻⁶ m³ for each specimen. The calculated densities are summarized in Table 7.
Based on this research, for all variations of resin talc 70%:30%, 80%:20%, and 90%:10% met the density standard. The greater the composition of the talc, the greater the density of the core sandwich. Increasing talc content raises density and typically increases the elastic modulus of the composite. However, this improvement is accompanied by a reduction in ductility, which is consistent with the observed decrease in elongation as the talc fraction increases.
3.5. Void Content
Checking the void content in the core sandwich specimen is an important step in evaluating the quality of the material because the presence of void content can significantly affect the strength and durability of the structure. If the percentage of void content exceeds the specified tolerance limit, this may indicate a defect in the manufacturing process, which has the potential to reduce the mechanical performance, durability, and safety of structural applications. In the manufacture of core sandwich specimens, void content can be easily identified using backlighting.
This void content percentage shows how much material emptiness occurs in each specimen. In the void content analysis with varying catalyst percentages, a theoretical mass of 11.89 × 10⁻³ kg was assigned to each specimen. By comparing the actual void content to this theoretical value, the void content percentage was determined and tabulated in Table 8. A more detailed analysis based on the data presented in Table 3 indicated that the relationship between void content and tensile strength values in variations of 50% Resin, 50% Talc, and Catalyst 0.1%, 0.5%, 0.7%, 1%, and 1.3% is the higher the void content percentage value, the lower the tensile strength value.
From a processing perspective, higher catalyst levels and higher filler loadings increase the viscosity at earlier stages of curing. This elevated viscosity limits the upward movement of entrapped air bubbles and promotes air entrapment within the composite. In addition, the surface energy mismatch between talc particles and the polyester matrix reduces wetting efficiency during rapid curing, which further increases the formation of interfacial voids. These voids reduce the effective load-bearing cross-section and act as stress concentrators. This mechanism explains the inverse correlation between void content, as presented in Table 8 and Table 9, and tensile strength values, as shown in Table 3 and Table 5.
Table 7: Density Variation of Resin: Talc 70%:30%, 80%:20%, 90%:10% and Catalyst 0.1%
| Resin Talc Variations | Mass (× 10-3 kg) | Density (× 103 kg/m3) | Average of Density (× 103 kg/m3) | ||||||||
|---|---|---|---|---|---|---|---|---|---|---|---|
| A | B | C | D | E | A | B | C | D | E | ||
| 70%:30% | 8.36 | 8.6 | 8.07 | 8.16 | 8.29 | 1.39 | 1.43 | 1.34 | 1.35 | 1.38 | 1.378 |
| 80%:20% | 7.73 | 7.98 | 8.00 | 7.92 | 8.58 | 1.28 | 1.32 | 1.33 | 1.31 | 1.42 | 1.332 |
| 90%:10% | 7.26 | 7.6 | 7.21 | 7.6 | 6.96 | 1.21 | 1.26 | 1.2 | 1.26 | 1.16 | 1.218 |
Table 8: Void Calculation Result in Variation of 50% Resin, 50% Talc, and Catalyst 0.1%, 0.5%, 0.7%, 1%, and 1.3%.
| Catalyst Variation | Actual Mass (× 10-3 kg) | Void Content(%) | Average Void Content (%) | ||||||||
|---|---|---|---|---|---|---|---|---|---|---|---|
| A | B | C | D | E | A | B | C | D | E | ||
| 0.1% | 9.54 | 9.50 | 9.52 | 9.57 | 9.89 | 19.76 | 20.10 | 19.93 | 19.51 | 16.82 | 19.23 |
| 0.5% | 9.15 | 9.52 | 9.27 | 9.25 | 9.27 | 23.04 | 19.93 | 22.04 | 22.20 | 22.04 | 21.85 |
| 0.7% | 9.07 | 9.45 | 9.46 | 9.08 | 9.03 | 23.72 | 20.52 | 20.44 | 23.63 | 24.05 | 22.47 |
| 1% | 9.08 | 9.01 | 9.02 | 9.03 | 9.30 | 23.63 | 24.22 | 24.14 | 24.05 | 21.78 | 23.57 |
| 1.3% | 9.62 | 9 | 9.05 | 9.68 | 10.13 | 19.09 | 24.31 | 23.89 | 18.59 | 14.80 | 20.13 |
Table 9: Void Calculation Result in Veariation of Resin:Talc 70%:30%, 80%:20%, 90%:10% and Catalyst 0.1%
| Resin-Talc Variation | Actual Mass (× 10-3 kg) | Void (%) | Average Void Content (%) | ||||||||
|---|---|---|---|---|---|---|---|---|---|---|---|
| A | B | C | D | E | A | B | C | D | E | ||
| 70%:30% | 8.36 | 8.60 | 8.07 | 8.16 | 8.29 | 16.40 | 14.00 | 19.30 | 18.40 | 17.10 | 17.04 |
| 80%:20% | 7.73 | 7.98 | 8.00 | 7.92 | 8.58 | 14.67 | 11.91 | 11.69 | 12.57 | 5.29 | 11.23 |
| 90%:10% | 7.26 | 7.60 | 7.21 | 7.60 | 6.96 | 10.51 | 6.32 | 11.13 | 6.32 | 14.21 | 9.70 |
As shown in Table 8, the specimen with a 0.1% catalyst variation exhibited the smallest void content, measured at 19.23%, which corresponds to the highest average tensile strength of 22.29 MPa. Conversely, the specimen with the highest void content, 23.57%, observed in the 1% catalyst variation, demonstrates a relatively low average tensile strength of 15.46 MPa.
These findings indicate that the catalyst percentage significantly influences the void content within the specimen. As shown in Table 2 and Table 8, a lower catalyst percentage extends the solidification process during specimen formation. The prolonged transition from liquid to solid allows the liquid material more time to flow and fill voids within the specimen, ultimately leading to a lower void content.
The theoretical mass of each composite was calculated based on the densities presented in Table 7. For the talc-resin systems, theoretical masses of 10 × 10-3 kg, 9.059 × 10⁻³ kg, and 8.113 × 10⁻³ kg were assigned to the 70:30, 80:20, and 90:10 resin to talc ratios, respectively.
Table 9 presents the void content analysis for different resin-to-talc variations using a 0.1% catalyst concentration, which had been identified in previous calculations as the catalyst percentage yielding the smallest void content. The highest void content percentage value in the 70%:30% resin talc variation specimen with an average of 17.04%, then in the 80%:20% resin talc variation of 11.23%, and the smallest of 9.7% for the 90%:10% resin talc variation. Based on Table 5 and Table 9, it was known that the greater the void content percentage, the smaller the tensile strength value.
The analysis indicates that higher talc content increases the likelihood of void formation due to the imperfect bonding between talc and resin. The results reveal that the optimal composition, in terms of void content, is a 90:10 resin-to-talc ratio with 0.1% catalyst, which achieves the smallest void content and the highest tensile strength. Although the 90% resin : 10% talc composition exhibited the lowest void content, the optimal composition in this study was determined to be 80% resin : 20% talc. This formulation demonstrated slightly higher void content and slightly lower tensile strength compared to the 90% resin : 10% talc variation. However, it exhibited superior resin-talc bonding, preventing fracture during tensile testing. Additionally, the elongation difference between the 80% resin : 20% talc and 90% resin : 10% talc compositions was minimal, with only a 0.1% difference.
Based on these findings, the composite material developed in this study shows strong potential for application in ship components where lightweight and mechanical strength are critical. These include hull structures, deck reinforcements, and interior partitions, particularly in small to medium-sized vessels where weight savings significantly impact fuel efficiency and emissions55). The demonstrated tensile performance and reduced void content support the feasibility of implementing this material as a structural core within sandwich panel constructions in maritime settings.
Beyond its immediate application in sandwich panels, this material can also be developed further by combining it with fiberglass to produce Fiberglass Reinforced Polymer (FRP), a widely used structural material in marine industries56,57). Future research could explore the incorporation of natural fibers as reinforcement materials in composites58–60). This approach has the potential to enhance tensile strength while simultaneously improving the material's environmental sustainability. By integrating renewable and biodegradable fibers, researchers can contribute to the advancement of green technology by reducing dependency on synthetic fillers, minimizing carbon footprints, and promoting the development of eco-friendly composite materials. Furthermore, investigating the mechanical properties, durability, biodegradability, and production processes of such composites could unlock new possibilities for applications in sustainable engineering61), the automotive62,63) and marine industries64,65), renewable energy turbines66) and other engineering-related applications67,68).
4. Conclusion
This study concludes that the optimal formulation for resin–talc composite core material is 80% resin and 20% talc, cured with 0.1% catalyst. This composition provides the best balance between tensile strength (25.8 MPa), ductility (10.64% elongation), and void content (11.23%), while avoiding the brittle failure observed in the 90:10 resin–talc variation. These results demonstrate that an appropriate filler-to-matrix ratio can enhance mechanical performance while maintaining structural integrity.
The engineering significance of this finding lies in its compliance with the Lloyd’s Register Provisional Rules (2024), which specify minimum requirements for tensile strength (≥20 MPa) and density (≥1000 kg/m³). The combination of sufficient strength, ductility, and low void content makes the 80:20 composition suitable for use as a core material in marine sandwich panel structures.
This study is limited to a single resin type and a basic casting process, without testing durability or performance under environmental exposure. Future studies should explore alternative resin systems, improved fabrication techniques, and assess long-term durability. It is also recommended to investigate lower catalyst concentrations, such as 0.05%, to determine their potential in further enhancing mechanical integrity.
Conflict of Interest
The authors confirm that there is no conflict of interest
associated with the publication of this paper.
Acknowledgement
This research was supported by several parties, to whom the authors express their sincere gratitude, especially the University of Jember.
Nomenclature
| Symbol | Description (Unit) |
|---|---|
| m | mass of the test specimen (kg) |
| V | volume of the test specimen (m³) |
| ρ | density of the specimen (kg/m3) |
References
- M. Lindgren, “Use of fossil energy will increase atmosphere and earth land temperature,” Atmospheric and Climate Sciences, 12 (02) 264–269 (2022). doi:10.4236/acs.2022.122016.
- O. Evseeva, S. Evseeva, and T. Dudarenko, “The impact of human activity on the global warming,” E3S Web of Conferences, 284 1–9 (2021). doi:10.1051/e3sconf/202128411017.
- M. Madi, Mukhtasor, D. Satrio, T. Tuswan, A. Ismail, R. Rafi, P. Yunesti, S.W. Buana, and J. Jarwinda, “Experimental study on the effect of foil guide vane on the performance of a straight-blade vertical axis ocean current turbine,” Nase More, 71 (1) 1–11 (2024). doi:10.17818/NM/2024/1.1.
- A.S.S. Qalbie, and R. Rahmaniah, “The opportunity to achieve net zero emissions in indonesia through the implementation of a green economy to address climate change,” Global South Review, 5 (1) 80 (2023). doi:10.22146/globalsouth.86381.
- N. Ngadisih, A. Sinatrya, I. Retno Wulan, J. Claudea Tanjung, S. Fahima, and P. Lestari, “Potential threats and mitigation efforts of greenhouse gas emissions in indonesia’s agricultural sector: a systematic literature review,” Jurnal Teknologi Lingkungan Lahan Basah, 12 (1) 245 (2024). doi:10.26418/jtllb.v12i1.74231.
- H. Cahyo, S.D. Purnomo, S.K. Octisari, M. Surveyandini, S. Sundari, and E.K. Purwendah, “Environment, population, and economy on co2 emission in indonesia,” International Journal of Energy Economics and Policy, 13 (6) 295–303 (2023). doi:10.32479/ijeep.14938.
- K. Karinda, and T. Baharuddin, “Climate change policy based on global study evolution 1979-2023: an insight and direction for indonesia,” IOP Conf. Ser. Earth Environ. Sci., 1388 (1) (2024). doi:10.1088/1755-1315/1388/1/012054.
- J. Barreiro Montes, F. Fraguela Diaz, V. Diaz-Casas, and S. Zaragoza, “Energy efficiency operational indicator resilient, ship emissions under control,” J. Mar. Sci. Eng., 12 (10) (2024). doi:10.3390/jmse12101753.
- Y. Garbatov, D. Yalamov, and P. Georgiev, “Markov chain analysis of ship energy efficiency,” Energies , 17 (12) 1–13 (2024). doi:10.3390/en17123018.
- T.A. Tran, “The novelty numerical simulation method for reducing the fuel oil consumption and the greenhouse gas emission in shipping transportation industry,” Cogent Environ. Sci., 6 (1) (2020). doi:10.1080/23311843.2020.1809072.
- Syafiuddin, and P.Y. Arianto, “A semi-empirical operational performance prediction for anchor handling tug supply (ahts) vessel,” BIO Web Conf., 220 (2026). doi:10.1051/bioconf/202622001002.
- T. Galaxy, “Aplikasi bki-greenpadma as a solution for implementing energy efficiency regulations,” Jurnal Teknik BKI:Technical Journal of Classification and Independent Assurance, 53–60 (2016).
- J. Mindykowski, Ł. Wierzbicki, M. Górniak, and P. Andrzej, “Analysis and experimental verification of improving the eedi of a ship using a thruster supplied by a hybrid power system,” Polish Maritime Research, 31 (1) 43–54 (2024). doi:10.2478/pomr-2024-0005.
- M. Vasilev, and M. Kalajdžić, “Influence of lightweight change on ship performance,” FME Transactions, 50 (4) 615–622 (2022). doi:10.5937/fme2204615V.
- S. Adam, G.H. Gebremicheal, R. Swaminathan, S.Mohammed. A, S. Habtom, S. Huruy, and U. Yassin, “Design and optimization of ship hull for better fuel efficiency,” International Journal of Science and Research Archive, 13 (1) 029–036 (2024). doi:10.30574/ijsra.2024.13.1.1526.
- S.R. e Silva, and M. Bento Moreira, “An optimisation-based approach to reduce fuel consumption and emissions from shipping navigation,” International Marine Design Conference, (March) 0–2 (2024). doi:10.59490/imdc.2024.832.
- A. Ismail, A. Zubaydi, B. Piscesa, E. Panangian, R.C. Ariesta, and T. Tuswan, “A comparative study of conventional and sandwich plate side-shell using finite element method,” IOP Conf. Ser. Mater. Sci. Eng., 1034 (1) 012027 (2021). doi:10.1088/1757-899x/1034/1/012027.
- N. Momčilović, and M. Motok, “Estimation of ship lightweight reduction by means of application of sandwich plate system,” FME Transactions, 37 (3) 123–128 (2009).
- A. Ismail, A. Zubaydi, B. Piscesa, T. Tuswan, and R.C. Ariesta, “Study of sandwich panel application on side hull of crude oil tanker,” Journal of Applied Engineering Science, 19 (4) 1090–1098 (2021). doi:10.5937/jaes0-30373.
- A. Ismail, A. Zubaydi, B. Piscesa, T. Tuswan, and M.A. Lestari, “Structural evaluation of sandwich material applications on main deck structure of 17500 dwt tanker using finite element method,” AIP Conf. Proc., 3124 (1) 1–8 (2024). doi:10.1063/5.0228128.
- A. Mula, A. Zubaydi, and A. Budipriyanto, “Properties of sandwich panel core from eggshell powder for ship structure,” SENTA 2017 - International Conference on Marine Technology, (2009) 27–34 (2017).
- Kharis Abdullah, A. Zubaydi, and A. Budipriyanto, “Aplication of sandwich plate system with core from waste clam shell in ship deck,” SENTA 2017 - International Conference on Marine Technology, 28 (2) 59–67 (2017).
- Yudiono, A. Budipriyanto, and A. Zubaydi, “Tests on sandwich plate core materials with rice husk filler for ship deck structure,” SENTA 2017 - International Conference on Marine Technology, 28 (2) 35–41 (2017).
- M.S. Purwoko, A. Budipriyanto, and A. Zubaydi, “Study on wood sawdust for sandwich core material of ship structure,” SENTA 2017 - International Conference on Marine Technology, 15 (1) 50–58 (2017).
- Lloyd Register, “LR-ru-019 rules for the application of sandwich panel construction to ship structure, july 2024 - chapter 2 material manufacture and construction procedures - section 2 core material,” (July) 2024–2025 (2024).
- E. Utomo, A. Zubaydi, and P. Pratisna, “Study of core material sandwich panel in ship construction,” IPTEK Journal of Proceedings Series, 0 (2) 93 (2017). doi:10.12962/j23546026.y2017i2.2304.
- E. Utomo, A. Zubaydi, and A. Budipriyanto, “Sandwich panel manufacturing method in form of test specimens for ship construction,” Wave: Jurnal Ilmiah Teknologi Maritim, 11 (1) 7–14 (2017). doi:10.29122/jurnalwave.v11i1.2194.
- P.Y. Arianto, A. Zubaydi, B. Piscesa, and T. Tuswan, “Experimental and numerical bending analysis of steel/resin-talk sandwich material,” IPTEK The Journal for Technology and Science, 30 (3) 123 (2019). doi:10.12962/j20882033.v30i3.5496.
- P.K. Mallick, “Fiber-reinforced composites: Materials, manufacturing, and design,” 3rd Editio, CRC Press, Boca Raton, 2007. doi:10.1201/9781420005981.
- E.J. Barbero, “Introduction to Composite Materials Design,” 3rd Editio, CRC Press, Boca Raton, 2017. doi:10.1201/9781315296494.
- L. Gibson, and M.F. Ashby, “Cellular solids: structure and properties,” Cambridge University Press, (2nd ed.) (1997).
- F.C. Campbell, “Structural composite materials,” ASM International, (2010).
- T. Alomayri, and I.M. Low, “Mechanical characteristics of cotton fibre reinforced geopolymer composites,” 115–121 (2014). doi:10.1002/9781118807743.ch10.
- B. Bhabatosh, N.R. Bandyopadhyay, and A. Sinha, “Mechanical and dynamic mechanical properties of unsaturated polyester resin-based composites,” Elsevier Inc., 2019. doi:10.1016/B978-0-12-816129-6.00016-8.
- A.A. Athawale, and J.A. Pandit, “Unsaturated polyester resins, blends, interpenetrating polymer networks, composites, and nanocomposites: State of the art and new challenges,” Elsevier Inc., 2019. doi:10.1016/B978-0-12-816129-6.00001-6.
- B. Peters, “Chapter 4 Catalysis,” in: Reaction Rate Theory and Rare Events Simulations, 2017: pp. 79–128. doi:10.1016/B978-0-44-456349-1.00004-0.
- T.E. Suharto, “Catalysts in the Chemical Industry,” I, UAD PRESS, Yogyakarta, 2022.
- M. Akhter, and M.M. Alam, “Catalysis,” in: Physical Pharmacy and Instrumental Methods of Analysis, Springer Nature Switzerland, Cham, 2023: pp. 97–107. doi:10.1007/978-3-031-36777-9_7.
- A. Dumas, F. Martin, E. Ferrage, P. Micoud, C. Le Roux, and S. Petit, “Synthetic talc advances: coming closer to nature, added value, and industrial requirements,” Appl. Clay Sci., 85 (1) 8–18 (2013). doi:10.1016/j.clay.2013.09.006.
- E. Codillo, and F. Klein, “Thermodynamic constraints on talc formation via si-metasomatism of ultramafic rocks along the slab-mantle interface,” 46427 (2022). doi:10.46427/gold2022.11266.
- S. Aspiotis, L. Stoeck, J. Schlüter, and B. Mihailova, “In situ high-temperature raman spectroscopy for the thermal decomposition of mn2+- and fe2+-bearing talc,” European Geosciences Union General Assembly 2024, (2024). doi:10.5194/egusphere-egu24-15106.
- C. Nuraeni, R. Yunilawati, and D. Rahmi, “Synthesis of talc from local dolomite and quartz and its potential applications in the cosmetics and pharmaceutical industries,” 69–76 (2016).
- S.F. Xavier, “Filled Polymer Composites,” in: 2022: pp. 101–183. doi:10.1002/9781119865544.ch2.
- American Society for Testing and Materials D638, “ASTM d638-14, standard practice for preparation of metallographic specimens,” ASTM International, 82 (C) 1–15 (2016). doi:10.1520/D0638-14.1.
- INTERNATIONAL STANDARD ISO 845, “Cellular plastics and rubbers — determination of apparent density,” International Organization for Standardization, 10406–1:20 3–6 (2004).
- L. HUNG TA INSTRUMENT CO., “HT-2402 computer servo control series material testing machines,” Hung Ta Instrument Co., Ltd, (2025). http://www.hungtathai.com/HT-2402-1.html (accessed January 26, 2025).
- P. Sonawane, J. Panchal, G.F.R. a Raj, A. Avathankar, S. Campli, and A.M. Gajbhiye, “Characterizing composite materials for high-performance applications: a review of testing methods,” Evergreen, 12 (1) 250–275 (2025). doi:10.5109/7342452.
- A. Ismail, A. Zubaydi, B. Piscesa, and T. Tuswan, “A novel fiberglass-reinforced polyurethane elastomer as the core sandwich material of the ship-plate system,” J. Mech. Behav. Mater., 32 (1) (2023). doi:10.1515/jmbm-2022-0288.
- A. Barakat, M. Al Ghazal, R.S.F. Tamo, A. Phadatare, J. Unser, J. Hagan, and U. Vaidya, “Development of a cure model for unsaturated polyester resin systems based on processing conditions,” Polymers (Basel)., 16 (17) 1–18 (2024). doi:10.3390/polym16172391.
- M. Farsane, S. Lhasnaoui, A. Anouar, S. Dagdag, and M. Bouzziri, “A review of measuring the gelation time in unsaturated polyester resins,” Materiali in Tehnologije, 56 (3) 323–329 (2022). doi:10.17222/mit.2021.337.
- H. Hestiawan, K. Jamasri, and J. Jamasri, “Effect of catalyst addition on the mechanical properties of unsaturated polyester resin,” Teknosia Journal, 3 (1) 1–7 (2017).
- B. Sandhyarani, and A. Satapathy, “Tribo-performance analysis of red mud filled glass-epoxy composites using taguchi experimental design,” Mater. Des., 30 (8) 2841–2853 (2009). doi:10.1016/j.matdes.2009.01.018.
- B.A. Pukánszky, “Influence of interface interaction on the ultimate tensile properties of polymer composites,” Composites, 21 (3) 255–262 (1990). doi:10.1016/0010-4361(90)90240-W.
- V.K. Thakur, A.S. Singha, and M.K. Thakur, “Ecofriendly biocomposites from natural fibers: mechanical and weathering study.,” International Journal of Polymer Analysis and Characterization, 18 (1) (2013). doi:10.1080/1023666X.2013.747246.
- G. Palomba, S. Scattareggia Marchese, V. Crupi, and Y. Garbatov, “Cost, energy efficiency and carbon footprint analysis of hybrid light-weight bulk carrier,” J. Mar. Sci. Eng., 10 (7) (2022). doi:10.3390/jmse10070957.
- A. Ismail, B. Ma’ruf, A. Zubaydi, M.A.D. Octavanny, and T.L. Ginta, “Strength assessment of fiberglass layer configurations in frp ship materials from yard practices using a statistical approach,” Curved and Layered Structures, 11 (1) (2024). doi:10.1515/cls-2024-0007.
- B. Ma’Ruf, A. Ismail, D.P. Sari, and S.H. Sujiatanti, “Strength analysis of marine biaxial warp-knitted glass fabrics as composite laminations for ship material,” Curved and Layered Structures, 10 (1) (2023). doi:10.1515/cls-2022-0209.
- D. Kumar, A. Gupta, P. Kumar, and A. Chauhan, “Enhancing mechanical and chemical performance of hybrid polymer composites: a study on oil palm and jute fiber reinforcement,” Evergreen, 12 (1) 453–459 (2025). doi:10.5109/7342465.
- M.G. Ganta, and M. Patel, “Evaluation of mechanical and thermal properties of alkali-treated sisal, bamboo, and hybrid fiber-reinforced polymer composites,” Evergreen, 11 (3) 1784–1797 (2024). doi:10.5109/7236831.
- D. Ariawan, W.P. Raharjo, K. Diharjo, W.W. Raharjo, and B. Kusharjanta, “Influence of water immersion on flexural and impact strength of microcrystalline cellulose-added unsaturated polyester-matriced composites strengthened by untreated, fumigated and alkalized cantala fibers,” Evergreen, 11 (3) 2164–2174 (2024). doi:10.5109/7236860.
- N. Rahmana Putra, A. Ismail, D. Purnama Sari, S. Suwahyu, M.R. Utina, N. Rizal, A. Machfudin, I.E. Sandjaja, and H. Pratikno, “Innovations and trends in composite materials for maritime applications: a 2000–2024 bibliometric study and comprehensive review,” Ships and Offshore Structures, 1–18 (2025). doi:10.1080/17445302.2025.2455987.
- S.S. Barve, and H.P. Khairnar, “Use of rice husk and sugarcane bagasse ash for development of automotive brake pad friction material,” Evergreen, 12 (1) 27–40 (2025). doi:10.5109/7342436.
- A.A. Finan, D. Hidayat, and D.Y. Kusuma, “Optimization of mechanical properties in 3d printed ultra pla sandwich structures: effect of infill density, printing speed, and layer thickness,” Evergreen, 12 (1) 564–573 (2025). doi:10.5109/7342475.
- T. Rizwan, T. Fikriandi, R. Rizqi, Y. Muchlis, P.Y. Arianto, R. Thaib, and A. Akhyar, “Aceh traditional boat modification using fiberglass material,” Journal of Maritime Research, 21 (2) 166–170 (2024).
- P.Y. Arianto, A.A. Masroeri, N.A.C. Dewi, and W. Sakinah, “Architectural design of a wooden floating hospital for archipelago areas- perencanaan rumah sakit terapung berbahan kayu untuk daerah kepulauan design,” Jurnal Ilmu Kelautan Kepulauan, 5 (2) 634–647 (2022).
- R. Hantoro, I.K.A.P. Utama, I.S. Arief, A. Ismail, and S.W. Manggala, “Innovation in vertical axis hydrokinetic turbine - straight blade cascaded (vaht-sbc) design and testing for low current speed power generation,” J. Phys. Conf. Ser., 1022 (1) (2018). doi:10.1088/1742-6596/1022/1/012023.
- W. Digwijaya, H.B. Tambunan, Sulistyo, T.D. Kusworo, and Muchammad, “Comparison study of material storage tank of compressed hydrogen fuel cell electric vehicle (fcev),” Evergreen, 11 (4) 3693–3699 (2024). doi:10.5109/7327000.
- P. Sharma, R.C. Sharma, A.N. Tiwari, and V. Sharma, “Mechanical and morphological characterization of insulation building panel made by using agricultural waste and gypsum board: an experiment-based study,” Evergreen, 12 (1) 135–146 (2025). doi:10.5109/7342445.