
Abstract
Hybrid aluminium matrix composites (HAMCs) have emerged as promising materials owing to their superior mechanical and tribological performance. In the present study, AA6063-based HAMCs were developed using 5 wt.% silicon carbide (SiC) and 5 wt.% graphite (Gr) as primary reinforcements, along with 1.5–2.5 wt.% rice husk ash (RHA) and marble dust (MD) as secondary reinforcements. The composites were fabricated via stir casting based on a Taguchi L16 orthogonal array, considering pouring temperature (PT) and stirring speed (SS), wt.% RHA and wt.% MD as process parameters. Mechanical and tribological properties, including tensile strength, microhardness, wear rate, and density, were evaluated. Multi-response optimization was carried out using Grey Relational Analysis (GRA), wherein grey relational grades (GRG) were computed and ranked to determine the optimal experimental conditions. Further, analysis of variance (ANOVA) was performed on GRG to identify the significance and contribution of process parameters. The results demonstrate the effectiveness of the integrated Taguchi–GRA approach in determining optimal processing conditions for AA6063 hybrid composites.
Keywords: ANOVA, Density, Grey relational analysis, Microhardness, Porosity, Stir casting, Tensile Strength, Wear rate
Outline
1. Introduction
Hybrid aluminium Matrix Composites (HAMCs), which combine two or more reinforcements, have emerged as a promising approach to achieve the desired properties of AMCs. In recent years, agricultural and industrial waste-derived reinforcements have emerged as sustainable, low-cost alternatives for enhancing aluminium metal matrix composites (AMMCs), offering environmental benefits alongside improved mechanical and tribological performance1,2). Diverse agro-wastes and industrial waste are being used by various researchers, such as ground nut shell ash3), coconut shell ash4,5), fly ash6-8),, snail shell ash9), plantain peel ash10), corn cob ash11), palm kernel shell12), ash, neem leaf ash13), straw ash14,15), etc have been effectively incorporated into aluminium matrices to boost properties like hardness, strength, and wear. Traditional ceramic reinforcements such as silicon carbide (SiC)16-18) and graphite (Gr)19-21) have been extensively used to enhance hardness and wear resistance and to provide self-lubricating characteristics in aluminum alloys. Recent studies indicate that combining these conventional ceramics with agro-waste or industrial by-products produces composites with customized properties, offering a balance of cost efficiency, environmental sustainability, and improved mechanical performance. The use of Silicon Carbide (SiC) and Graphite (Gr) as primary reinforcements is common, as they offer excellent mechanical properties. However, the addition of secondary reinforcements, such as Rice Husk Ash (RHA) and Marble Dust, presents a more sustainable and cost-effective solution. These materials, often considered waste products, offer environmental benefits by reducing waste while enhancing the properties of the composite. Rice Husk Ash contains more silica and contributes to improved wear resistance and hardness. Many researchers have used RHA for their study22-24). On the other hand, marble dust (MD), a waste material generated from the stone-cutting industry, primarily consists of calcium carbonate along with some silica, making it an economical option for reinforcing materials to improve hardness and wear resistance. Many researchers have also used MD in their research work25,26).
Despite the numerous benefits, the creation of hybrid composites necessitates the optimization of processing parameters in order to obtain the necessary material performance. Pouring temperature, stirring speed, and stirring duration are important process parameters that influence the microstructure and, consequently, the composite's properties. Therefore, it is crucial to identify the optimal processing conditions.
When working with multiple responses, Grey Relational Analysis (GRA) techniques hold a great interest for the researchers, especially for their use in Taguchi-based GRA. This statistical approach effectively determines optimal process parameters by simultaneously evaluating multiple performance characteristics, making it a powerful tool for addressing complex optimization problems. Several research studies have demonstrated the effectiveness of GRA in various applications, for example, H. S. Jailani et al.27), focused on how to improve the combination of sintering process parameters of Al-Si alloy reinforced with fly ash composites by applying Taguchi-GRA in a powder metallurgy technique. The investigation changed the fly ash concentration from 5 wt.to 15wt.%, also the compacting pressure was changed from 307-512 MPa, finally, the sintering temperature parameter also changed from 575-625°C. Analyzing their influence on density and hardness. GRA optimization successfully identified the optimal process settings, confirming that sintering parameters significantly influence mechanical properties.
Similarly, in another work by S. Dharmalingam et al.28), the application of Taguchi-GRA optimization was seen to improve the wear resistance in aluminium hybrid composites utilizing the alumina (Al₂O₃) and molybdenum disulfide as reinforcements. In this study, for designing the experiments, Taguchi L-9 orthogonal array was utilized, and process parameters like applied load, sliding speed, abrasive size, and MoS₂ content were optimized to get the improved wear resistance of the composite, validating GRA's efficacy in hybrid composite research.
The application of Taguchi-GRA methodology for improving the machining process was seen in the study done by P. Jayaraman et al.,29). Different machining parameters like cutting speed, feed rate, and depth of cut were consider to study their impact on the surface roughness of the component also focusing on material removal rate. This study also supported the role of Taguchi-GRA technique to improves machining performance by lowering surface roughness and increasing material removal efficiency.
Similarly, A.K. Mishra et al.30), focused on improving the wear resistance in their work. Here AA6061 alloy was consider for study with SiC (15 wt.%) and Al₂O₃ (15 wt.%) as reinforcements. For designing the experiments Taguchi L-27 orthogonal array was applied. Their dry sliding wear studies on a pin-on-disc apparatus revealed that sliding distance was critical for controlling friction and wear. Furthermore, optical microscopy of wear tracks revealed insights into the wear mechanisms at work. Their findings revealed that optimized hybrid composites have higher wear resistance under certain process settings.
In another work the application of Taguchi-based GRA was seen along with Principal Component Analysis as investigated by, N. Kaushik et al.31). AA6063 alloy was consider in this study. SiC was chosen as the reinforcement. The study looked at three different weight fractions of SiC reinforcements (3.5 wt.%, 7.5%, and 10.5%) to analyse how the different wt.% of reinforcements affect the properties like wear rate, specific wear rate, and frictional force. The experiments performed on a pin-on-disc tribometer showed that increasing SiC content led to significant wear resistance improvements under optimized process conditions. ANOVA results confirmed the statistical significance of control parameters, and optical microscopy of worn-out specimens revealed dominant wear mechanisms.
In another work, E.M et al.32), evaluated how Gr affects the aluminium composite with SiC as primary reinforcement. Here also the machining parameters were also studied. From the study, it was clear that the cutting speed with maximum percentage contribution of 48.76%, as found by performing ANOVA analysis found to be the most important factor that affects the responses like Surface roughness and material removal rate. After that, parameters like feed rate and depth of cut influenced the responses. Furthermore, Taguchi's predictive model was validated by comparing experimental and forecasted roughness values, demonstrating the importance of elemental chip production in lowering surface roughness.
Another key study by M.K. Rahimana et al.33), investigated the application of Grey relational analysis on friction stir welding (FSW). In this study, an attempt was made to join dissimilar aluminium alloys like AA7075 and AA6061. The parameters, like specimen thickness, axial force, and transverse speed, for studied. Tensile strength was taken as a response factor for this study. The specimens were made as per Taguchi's L9 orthogonal array for multi-response optimization, and ANOVA demonstrated that process factors significantly affected tensile strength.
Similarly, Taguchi-based Grey Relational Analysis was applied to the investigation done by S.V. Alagarsamy et al.34). In this study, AA 7075 was taken as the base alloy and TiO₂ particles with different wt.% (0, 5, 10, and 15 wt.%) as reinforcements. Here stir casting method was applied for the composite. The experiment aimed to optimize the wear performance considering the process parameters like applied load, sliding distance, reinforcement percentage, and sliding velocity. From the results, it was seen that the wear resistance was influenced by the reinforcement wt.% after the applied load. The worn-out surface was also studied through SEM micrographs. A confirmation experiment corroborated the projected ideal findings.
The application of Grey Relational Analysis (GRA) was also seen in another work based on friction stir welding done by I. Sabry et al.35), for 6061-T3 aluminium alloy flanges. The response factors, namely tensile strength, % elongation, bending load, and yield strength, were considered in this study. Welding parameters such as travel speed, rotation speed, shoulder diameter, and rotation speed at different levels were varied in this study. The application of Grey Relational Analysis (GRA) successfully optimized the welding parameters.
The hybrid metal-matrix composites prepared using powder metallurgy were investigated by B. A Gemeda et al.36). Here, Taguchi-based Grey Relational Analysis was also applied to optimize the process parameters. The composites were made using the reinforcements B4C, SiC, ZrO2, and MoS2 to study the physico-mechanical properties of hybrid composites. The parameters, namely milling duration of 5 hours, sintering temperature of 1200 °C, and finally compaction pressure of 40 MPa, lead to improvement in the properties like wear resistance, hardness, and compressive strength
The Taguchi-based GRA, a multi-objective optimization technique, has great potential to improve the efficiency and performance of a variety of processes. Given its ability to examine multiple performance factors simultaneously, it can determine optimal process parameters. The present study also focuses on how different process parameters can be optimized using Taguchi-based GRA, considering multiple responses. For the present study, AA6063 hybrid composites reinforced with fixed percentages of SiC and Gr (5 wt.%) and varying percentages of secondary reinforcements, namely RHA and Marble Dust. To find the percentage contribution of each parameter, ANOVA was performed. The optimization results are then evaluated using confirmation tests, and the composites' performance is compared to that of pure AA6063 and other single-reinforced polymers.
This study intends to contribute to the field of sustainable materials by proving the effective utilization of waste goods like rice husk ash and marble dust.in enhancing the performance of aluminum matrix composites. Furthermore, the study highlights the potential of Taguchi and GRA methods to optimize the fabrication process of hybrid composites, achieving superior properties while maintaining cost-effectiveness.
2. Materials and Methods
2.1. Matrix Selection
In the present study, AA6063 has been selected due to its light weight, ease of fabrication, and castability properties. AA6063 was purchased from Rajasthan Aluminum, Tripolia Bazar, Jaipur, Rajasthan, and its elemental content
Table 1: Chemical Composition of AA 6063 Alloy
| Elements | Comp. Analyzed | Nominal Comp. |
|---|---|---|
| Si | 0.51 | 0.2-0.6 |
| Fe | 0.15 | Max 0.35 |
| Mg | 0.55 | 0.45-0.9 |
| Zn | 0.01 | Max 0.1 |
| Cu | 0.01 | Max 0.1 |
| Mn | 0.04 | Max 0.1 |
| Cr | 0.01 | Max 0.1 |
| Al | Balance | Balance |
is presented in Table 1.
2.2. Reinforcement Selection
In the present study, SiC, Gr, Rice husk ash (RHA), and Marble dust (MD) were used as reinforcements. Incorporating soft reinforcements like graphite alongside hard ceramic particles such as SiC reduces brittleness while boosting wear resistance, ultimately improving the performance of hybrid composites37). Research has shown that adding these ceramic particulates to aluminum-based composites markedly enhances their mechanical and tribological properties. For example, B. Suresh Babu et al.38) produced AA6063 hybrid composites via stir casting, with a formulation of 90 wt.% Al, 5 wt.% SiC, and 5 wt.% graphite achieving higher tensile strength (190.48 MPa) and lower density (2.64 g/cm³) than a comparable 90 wt.% Al with 10 wt.% SiC variant (160.84 MPa, 2.71 g/cm³).In addition to these primary reinforcements, Rice Husk Ash (RHA), an environmentally acceptable substance with high silica content, and industrial waste such as marble dust are considered secondary reinforcements. contributing towards sustainability39,40). The Rice husk ash (RHA) was purchased from Herenba Instruments & Engineers, Kaveri Street, Ramnagar, Ambattur, Chennai, whose constituents are presented in Table 2.
Hybrid (three or multi-phase) composites offer greater flexibility in tailoring material properties than two-phase composites41), and are increasingly being explored in the aerospace and automotive sectors for their superior strength-to-weight ratio, reduced density, and improved ductility. Therefore, MD was included to provide increased hardness and strength, along with a cost-effective solution for composite fabrication42). The marble dust was procured from a local marble processing plant, Yogesh Moorti Kala Kendra, Jaipur. The chemical compositions of marble dust are presented in Table 3.
Table 2: Constituents of Rice Husk Ash (RHA)
| Compound/element(constituent) | wt.% |
|---|---|
| SiO2 | 91.56 |
| C | 4.8 |
| CaO | 1.58 |
| MgO | 0.53 |
| Fe2O3 | 0.21 |
| K2O | 0.39 |
| Others | 0.93 |
Table 3: Constituents of Marble Dust (MD)
| Compound/element(constituent) | wt.% |
|---|---|
| CaO | 42.45 |
| MgO | 1.52 |
| SiO2 | 26.35 |
| Al2O3 | 0.520 |
| Fe2O3 | 9.40 |
2.3. Design of Experiments
The experiments were designed according to Taguchi's L16 Orthogonal arrays. Four different process parameters were taken at four levels as shown in Table 4. The wt. % of SiC and Gr was kept constant at 5 wt. %. The pouring temperature (PT) levels were taken as 660, 680, 700, and 720 °C. A stirring time of 15 minutes was taken common for all experiments. Finally, the stirring speed (SS) was taken as 300,400,500,600 rpm. The process parameters were selected properly selected according to the literature review43-45). The experiments designed as per Taguchi's L16 Orthogonal array are shown in Table 5.
Table 4: Different levels of process parameters and their notation
| Process parameters | Notation. | 1 | 2 | 3 | 4 |
|---|---|---|---|---|---|
| Pouring Temp (PT) (°C) | PT | 660 | 680 | 700 | 720 |
| Stirring Speed (SS) (rpm) | SP | 300 | 400 | 500 | 600 |
| wt.% of Rice Husk Ash (RHA) | RHA | 1 | 1.5 | 2 | 2.5 |
| wt.% of Marble Dust (MD) | MD | 1 | 1.5 | 2 | 2.5 |
Table 5: Experimental Design according to Taguchi’s L 16 orthogonal array
| Exp. No | PT (°C) | SS (rpm) | RHA (wt.%) | MD (wt.%) |
|---|---|---|---|---|
| 1 | 660 | 300 | 1 | 1 |
| 2 | 660 | 400 | 1.5 | 1.5 |
| 3 | 660 | 500 | 2 | 2 |
| 4 | 660 | 600 | 2.5 | 2.5 |
| 5 | 680 | 300 | 1.5 | 2 |
| 6 | 680 | 400 | 1 | 2.5 |
| 7 | 680 | 500 | 2.5 | 1 |
| 8 | 680 | 600 | 2 | 1.5 |
| 9 | 700 | 300 | 2 | 2.5 |
| 10 | 700 | 400 | 2.5 | 2 |
| 11 | 700 | 500 | 1 | 1.5 |
| 12 | 700 | 600 | 1.5 | 1 |
| 13 | 720 | 300 | 2.5 | 1.5 |
| 14 | 720 | 400 | 2 | 1 |
| 15 | 720 | 500 | 1.5 | 2.5 |
| 16 | 720 | 600 | 1 | 2 |
2.4. Composite Fabrication by Stir Casting
The stir casting method for producing metal matrix composites is widely used due to its simplicity and cost-effectiveness. This method can be used to generate hybrid metal-matrix composites. Various researchers are using aluminium metal matrix composites produced by this method to improve their mechanical and wear properties46-48). This study used a bottom-tapping stir-casting furnace with a crucible that can accommodate up to 2 kg of aluminium alloy at a time. This type of machine supports a maximum temperature of 1000 °C for composite generation. The samples were prepared according to the Taguchi L-16 orthogonal array, as shown in Table 5. The reinforcements were preheated in the preheater chamber before mixing with the stirrer in the furnace. The Rectangular die was heated to 250 to 300 °C before pouring the melt. The stirring speed, pouring on/off, preheated temperature, lifting of the stirrer etc., are also controlled. At last, the die is opened to take out the cast.
2.5. Mechanical Characterization
2.5.1. Tensile testing
The tensile testing of the specimen was done on a 30KN tensile testing machine. The samples were prepared following the ASTM E8 standard, as shown in Figure1.
A gauge length of 32 mm was taken for tensile testing.
2.5.2. Micro hardness testing
The microhardness of the prepared samples was determined using a Vickers microhardness tester. Before that, the test sample of size 30mm×20mm×10mm as represented in Figure1 was mirror polished using different grades of emery papers, a disc polishing machine using aluminium paste, and finally etched with reagents (Keller's reagent). During measurement of microhardness, a constant load of 100-kgf and a dwelling time of 30 seconds was maintained for each sample.
2.5.3. Wear testing
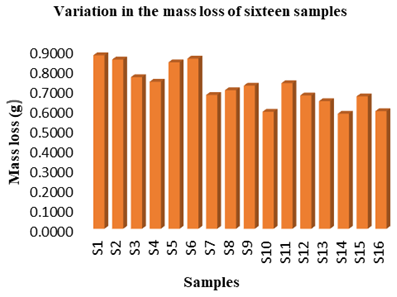
Tribological testing employed a universal tribometer for unlubricated ball-on-flat linear reciprocating wear experiments. Test specimens measured 30 mm × 10 mm × 10 mm to assess wear resistance. Tests were conducted at ambient temperature (300 K), using a 5 mm stroke length, 20 N normal load, and 5 Hz frequency. Coefficient of friction (COF) was recorded continuously over 600 seconds of sliding. Specific wear rate (SWR) was computed using Eq. (1)49). Sample mass loss was determined via Eq. (2) and sliding distance was calculated using Eq. (3).
(g/cm3)
(meters)
(Newton)
Where L = stroke length (m)
f = frequency (Hz)
t = total test time (s)
The loss of mass for each sample is presented in Figure2.

2.5.4. Density Calculation
Using the Rule of Mixtures, the theoretical density of the composites was obtained by Eq. (4)18). AA6063 alloy, silicon carbide (SiC), graphite (Gr), rice husk ash (RHA), and marble dust (MD) are represented by the weight percentages WAl6063, WSiC, WGr, WRHA, and WMD in this equation, respectively. The corresponding densities of Al6063, silicon carbide, graphite, rice husk ash, and marble dust are denoted by ρAl-6063, ρSiC, ρGr, ρRHA, and ρMD, and their assumed values as per literatures are shown in Table 6. To calculate density experimentally, the mass of each sample was divided by its volume.
The measured theoretical and experimental densities were compared using Eq. (5) to determine the composites' % porosity50).
Where is the density obtained theoretically
is the density obtained experimentally
Table 6: Densities of Constituent Elements for Theoretical Density Estimation13,18,22,51)
| Element | Density (g/cm3) |
|---|---|
| Al6063 | 2.7 |
| Gr | 2.23 |
| SiC | 3.21 |
| RHA | 1.60 |
| MD | 2.68 |
2.6. Multi-Response Optimization Steps in GRA
The multi-response optimization problem considered in the present study was addressed using Grey Relational Analysis (GRA), a widely used technique for solving multi-attribute decision-making problems. GRA is based on the evaluation of the degree of correlation between sequences and is particularly suitable for systems with incomplete or uncertain information. The method transforms multiple performance characteristics into a single representative index, known as the grey relational grade (GRG)52), which reflects the overall performance of the system.
In the present work, the experimental responses, namely ultimate tensile strength, microhardness, wear rate, and density, were first normalized to eliminate the effects of different units and scales. For the responses where higher values are desirable, such as tensile strength and hardness, the normalization was carried out using equation (6), whereas for responses where lower values are preferred, such as wear rate, the normalization was performed using equation (7).
After calculating the Normalized value for each tensile and micro hardness, wear, and density, the deviation was calculated using equation (8).
The computed deviation is displayed in Table 12. Equation (9) was then used to determine the grey relationship coefficient.
Where
Table 13 presents the calculated Grey relational coefficient. Equation (10) was used for calculating grey relational grades.
The rank is presented in Table 13.
Equation (11) was used for calculating the predicted value of grey relational grades.
Where q represents the number of significant input parameters, also represents the mean value of GRGs. Additionally, denotes the means of GRGs while considering the optimal level. The number of responses is denoted by n.
3. Results and Discussion
3.1. Mechanical Characterization
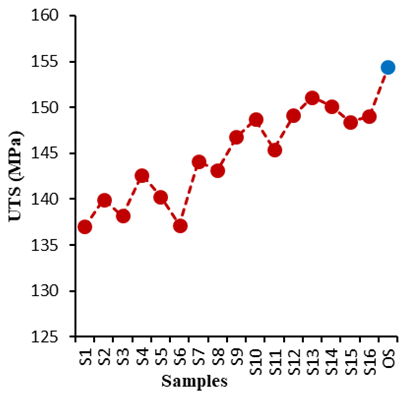
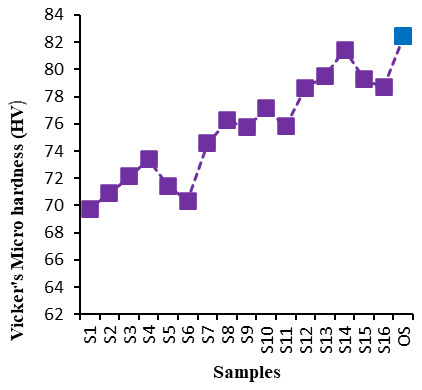
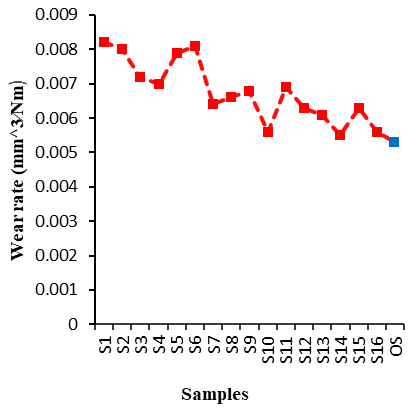
The mechanical and tribological properties of the developed AA6063 hybrid composites were evaluated in terms of ultimate tensile strength (UTS), microhardness (HV), wear rate, and density, and the results are presented in Table 7. The UTS values were found to vary from 136.98 MPa to 151.11 MPa, with the maximum value obtained for Experiment 13 (PT = 720°C), indicating the positive influence of higher processing temperature and optimized reinforcement composition on load-bearing capacity. Similarly, the hardness values ranged from 69.76 HV to 81.42 HV, with the highest hardness observed in Experiment 14, attributed to the uniform distribution of hard reinforcement particles and improved interfacial bonding. The wear rate exhibited a decreasing trend with increasing reinforcement and temperature, ranging from 0.0082 mm³/Nm to 0.0055 mm³/Nm, indicating enhanced wear resistance due to the presence of hard ceramic phases and improved surface integrity. Theoretical density and experimental density values were found to be in close agreement, with porosity values remaining below ~1.55% for most samples. However, slightly higher porosity was observed in certain cases (e.g., Experiments 7 and 14), which may be attributed to improper wetting or gas entrapment during casting.
3.2. Grey Relational Analysis
The signal-to-noise (S/N) ratios were calculated using the “larger-the-better” criterion for UTS and HV, and the “smaller-the-better” criterion for SWR and density, as given in Table 8. The computed S/N ratios are listed in Table 9. To eliminate unit variations, the S/N ratios were normalized using Eqs. (1) and (2), and the normalized values are presented in Table 10. The deviation sequences were then calculated using Eq. (3), and the results are shown in Table 11. Based on these deviations, the grey relational coefficients (GRCs) were determined using Eq. (4).
The grey relational grades (GRGs), representing the overall performance index, were calculated using Eq. (5) and are presented in Table 12 along with their ranks. Among all experiments, Experiment 12 exhibited the highest GRG (0.7217), indicating the best combination of process parameters for achieving optimal mechanical and tribological properties.
Table 7: Experimental Results of Mechanical and Tribological Properties
| Ex. no | PT (°C) | SS (rpm) | RHA (wt.%) | MD (wt.%) | UTS (MPa) | HV | SWR (mm3/Nm) | (g/cm3) | (g/cm3) | % P |
|---|---|---|---|---|---|---|---|---|---|---|
| 1 | 660 | 300 | 1 | 1 | 136.9870 | 69.7683 | 0.0082 | 2.6745 | 2.6635 | 0.4112 |
| 2 | 660 | 400 | 1.5 | 1.5 | 139.9865 | 70.9093 | 0.0080 | 2.6653 | 2.6627 | 0.0975 |
| 3 | 660 | 500 | 2 | 2 | 138.2049 | 72.1300 | 0.0072 | 2.6562 | 2.6513 | 0.1844 |
| 4 | 660 | 600 | 2.5 | 2.5 | 142.6621 | 73.3794 | 0.0070 | 2.6471 | 2.6453 | 0.0679 |
| 5 | 680 | 300 | 1.5 | 2 | 140.2800 | 71.4262 | 0.0079 | 2.6561 | 2.6533 | 0.1054 |
| 6 | 680 | 400 | 1 | 2.5 | 137.1548 | 70.3322 | 0.0081 | 2.6473 | 2.6448 | 0.0944 |
| 7 | 680 | 500 | 2.5 | 1 | 144.1073 | 74.5633 | 0.0064 | 2.6738 | 2.6328 | 1.5333 |
| 8 | 680 | 600 | 2 | 1.5 | 143.1696 | 76.2509 | 0.0066 | 2.6664 | 2.6431 | 0.8738 |
| 9 | 700 | 300 | 2 | 2.5 | 146.7476 | 75.7315 | 0.0068 | 2.6516 | 2.6487 | 0.1093 |
| 10 | 700 | 400 | 2.5 | 2 | 148.7186 | 77.1225 | 0.0056 | 2.6564 | 2.6312 | 0.9486 |
| 11 | 700 | 500 | 1 | 1.5 | 145.4158 | 75.8258 | 0.0069 | 2.6675 | 2.6563 | 0.4198 |
| 12 | 700 | 600 | 1.5 | 1 | 149.1103 | 78.6306 | 0.0063 | 2.6748 | 2.6632 | 0.4336 |
| 13 | 720 | 300 | 2.5 | 1.5 | 151.1165 | 79.4898 | 0.0061 | 2.6666 | 2.6341 | 1.2187 |
| 14 | 720 | 400 | 2 | 1 | 150.1263 | 81.4220 | 0.0055 | 2.6749 | 2.6335 | 1.5477 |
| 15 | 720 | 500 | 1.5 | 2.5 | 148.4156 | 79.2725 | 0.0063 | 2.6474 | 2.6456 | 0.0679 |
| 16 | 720 | 600 | 1 | 2 | 149.0222 | 78.6752 | 0.0056 | 2.6560 | 2.6449 | 0.4179 |
Table 8: Signal-to-noise ratio (ɳ) functions for desired Goals
| S/N function | S/N formula | Goal |
|---|---|---|
| Smaller the better | Min: Minimizing: SWR | |
| Larger the better | Maximizing: UTS Maximizing: HV |
Table 9: Calculated Signal-to-Noise (S/N) Ratios for Experimental Responses
| Criteria (The larger is the better) | Criteria (The smaller the better) | |||
|---|---|---|---|---|
| Ex. no | UTS (MPa) | HV | (g/cm3) | SWR |
| 1 | 42.7336 | 36.8732 | -8.5091 | 41.7237 |
| 2 | 42.9217 | 37.0141 | -8.5064 | 41.9382 |
| 3 | 42.8105 | 37.1623 | -8.4692 | 42.8533 |
| 4 | 43.0862 | 37.3115 | -8.4495 | 43.0980 |
| 5 | 42.9399 | 37.0772 | -8.4757 | 42.0474 |
| 6 | 42.7442 | 36.9431 | -8.4479 | 41.8303 |
| 7 | 43.1737 | 37.4505 | -8.4084 | 43.8764 |
| 8 | 43.1170 | 37.6449 | -8.4423 | 43.6091 |
| 9 | 43.3314 | 37.5855 | -8.4607 | 43.3498 |
| 10 | 43.4473 | 37.7436 | -8.4031 | 45.0362 |
| 11 | 43.2522 | 37.5963 | -8.4855 | 43.2230 |
| 12 | 43.4702 | 37.9118 | -8.5081 | 44.0131 |
| 13 | 43.5862 | 38.0062 | -8.4126 | 44.2934 |
| 14 | 43.5291 | 38.2148 | -8.4107 | 45.1927 |
| 15 | 43.4296 | 37.9825 | -8.4505 | 44.0131 |
| 16 | 43.4650 | 37.9168 | -8.4482 | 45.0362 |
| Max | 43.5862 | 38.2148 | -8.4031 | 45.1927 |
| Min | 42.7336 | 36.8732 | -8.5091 | 41.7237 |
Table 10: Normalized Signal-to-Noise (S/N) Ratios for Experimental Responses
| Criteria (The larger is the better) | Criteria (The smaller the better) | |||
|---|---|---|---|---|
| Ex. no | UTS (MPa) | HV | SWR (mm3/Nm) | (g/cm3) |
| 1 | 0.0000 | 0.0000 | 1.0000 | 0.5512 |
| 2 | 0.2206 | 0.1050 | 0.9382 | 0.5250 |
| 3 | 0.0901 | 0.2155 | 0.6744 | 0.4027 |
| 4 | 0.4135 | 0.3267 | 0.6038 | 0.0000 |
| 5 | 0.2420 | 0.1520 | 0.9067 | 0.3634 |
| 6 | 0.0125 | 0.0521 | 0.9693 | 0.0131 |
| 7 | 0.5161 | 0.4303 | 0.3794 | 0.4201 |
| 8 | 0.4496 | 0.5752 | 0.4565 | 0.8433 |
| 9 | 0.7011 | 0.5309 | 0.5312 | 0.2584 |
| 10 | 0.8370 | 0.6487 | 0.0451 | 0.5118 |
| 11 | 0.6082 | 0.5390 | 0.5678 | 1.0000 |
| 12 | 0.8638 | 0.7741 | 0.3400 | 0.6079 |
| 13 | 1.0000 | 0.8445 | 0.2592 | 0.9651 |
| 14 | 0.9330 | 1.0000 | 0.0000 | 0.7561 |
| 15 | 0.8162 | 0.8268 | 0.3400 | 0.1533 |
| 16 | 0.8578 | 0.7778 | 0.0451 | 0.5076 |
| Min | 0.0000 | 0.0000 | 0.0000 | 0.0000 |
| Max | 1.0000 | 1.0000 | 1.0000 | 1.0000 |
Table 11: Deviation Sequences for Normalized Responses
| Criteria (The larger is the better) | Criteria (The smaller the better) | |||
|---|---|---|---|---|
| Ex. no | UTS (MPa) | HV | SWR (mm3/Nm) | (g/cm3) |
| 1 | 0.0000 | 0.0000 | 1.0000 | 0.5512 |
| 2 | 0.2206 | 0.1050 | 0.9382 | 0.5250 |
| 3 | 0.0901 | 0.2155 | 0.6744 | 0.4027 |
| 4 | 0.4135 | 0.3267 | 0.6038 | 0.0000 |
| 5 | 0.2420 | 0.1520 | 0.9067 | 0.3634 |
| 6 | 0.0125 | 0.0521 | 0.9693 | 0.0131 |
| 7 | 0.5161 | 0.4303 | 0.3794 | 0.4201 |
| 8 | 0.4496 | 0.5752 | 0.4565 | 0.8433 |
| 9 | 0.7011 | 0.5309 | 0.5312 | 0.2584 |
| 10 | 0.8370 | 0.6487 | 0.0451 | 0.5118 |
| 11 | 0.6082 | 0.5390 | 0.5678 | 1.0000 |
| 12 | 0.8638 | 0.7741 | 0.3400 | 0.6079 |
| 13 | 1.0000 | 0.8445 | 0.2592 | 0.9651 |
| 14 | 0.9330 | 1.0000 | 0.0000 | 0.7561 |
| 15 | 0.8162 | 0.8268 | 0.3400 | 0.1533 |
| 16 | 0.8578 | 0.7778 | 0.0451 | 0.5076 |
| Min | 0.0000 | 0.0000 | 0.0000 | 0.0000 |
| Max | 1.0000 | 1.0000 | 1.0000 | 1.0000 |
Table 12: Grey Relational Coefficients (GRCs), Grey Relational Grades (GRGs), and Ranking of Experiments
| Grey Relational Coefficients | ||||||
|---|---|---|---|---|---|---|
| Ex. no | UTS (MPa) | HV | SWR (mm3/Nm) | (g/cm3) | GRGs | Rank |
| 1 | 0.3333 | 0.3333 | 1.0000 | 1.0000 | 0.6667 | 2 |
| 2 | 0.3908 | 0.3584 | 0.8899 | 0.9523 | 0.6479 | 3 |
| 3 | 0.3546 | 0.3892 | 0.6056 | 0.5704 | 0.4800 | 14 |
| 4 | 0.4601 | 0.4261 | 0.5579 | 0.4707 | 0.4787 | 15 |
| 5 | 0.3974 | 0.3709 | 0.8427 | 0.6136 | 0.5562 | 9 |
| 6 | 0.3361 | 0.3453 | 0.9421 | 0.4639 | 0.5219 | 11 |
| 7 | 0.5082 | 0.4674 | 0.4462 | 0.3447 | 0.4416 | 16 |
| 8 | 0.4760 | 0.5406 | 0.4792 | 0.4423 | 0.4845 | 13 |
| 9 | 0.6258 | 0.5159 | 0.5161 | 0.5225 | 0.5451 | 10 |
| 10 | 0.7541 | 0.5873 | 0.3437 | 0.3333 | 0.5046 | 12 |
| 11 | 0.5606 | 0.5202 | 0.5364 | 0.6923 | 0.5774 | 7 |
| 12 | 0.7859 | 0.6888 | 0.4310 | 0.9810 | 0.7217 | 1 |
| 13 | 1.0000 | 0.7627 | 0.4030 | 0.3546 | 0.6301 | 5 |
| 14 | 0.8817 | 0.9999 | 0.3333 | 0.3500 | 0.6412 | 4 |
| 15 | 0.7312 | 0.742667 | 0.4310 | 0.4748 | 0.5949 | 6 |
| 16 | 0.7785 | 0.692322 | 0.3437 | 0.4653 | 0.5699 | 8 |
4. ANOVA and Optimization of Grey Relational Grade
ANOVA was performed, taking the GRG value as the response. It was done to find out the significance and contribution of each parameter in improving the response variables. The ANOVA results are presented in Table 14. Table 14 shows the F-ratio value and P-values from the ANOVA calculation. From Table 14, it was shown that the RHA and PT significantly affected the GRG values, followed by MD and SP.
The percentage contribution of each process parameter is presented in Figure4, which clearly states that the RHA wt.% has the maximum contribution of 33.49% in increasing the GRG value, followed by pouring temp with 27.41 % contribution, followed by Marble dust 22.95% contribution, and lastly Stirring speed with 13.04% contribution.
As indicated in Table 16, the confirmatory test was also conducted. The main effect plot for average grey relational grades, as presented in Figure3, clearly states the optimal levels of process parameters. Table 13 presents the maximum values of the different process parameters at different levels. These values are marked in bold (Asterix). From Table 13, it was clear that the RHA wt.%, which has the rank 1, affects the response factors more, followed by Pouring temp assigned rank 2, Marble dust wt.% assigned rank 3, and finally the stirring speed assigned rank 4. The major effect plot for average GRGs, as displayed in Figure 3, determines the optimal values of the process parameters. From Figure3, the optimized values are pouring temp of 720, stirring speed of 300 rpm, RHA wt.% of 1.5, and MD wt.% of 1%.
Table 13: Response table showing average grey relational grades
| Average grey relational grade based on factor levels (AGV) | ||||||
|---|---|---|---|---|---|---|
| Control Factors | 1 | 2 | 3 | 4 | Max-Min (Ei) | Rank |
| PT | 0.5683 | 0.5011 | 0.5872 | 0.6091* | 0.1080 | 2 |
| SP | 0.5995* | 0.5789 | 0.5235 | 0.5637 | 0.0760 | 4 |
| RHA | 0.5840 | 0.6302* | 0.5377 | 0.5138 | 0.1164 | 1 |
| MD | 0.6178* | 0.5850 | 0.5277 | 0.5352 | 0.0901 | 3 |

Table 14: ANOVA table for average grey relational grade
| Analysis of Variance | |||||
|---|---|---|---|---|---|
| Source | DF | Adj SS | Adj MS | F-Value | P-Value |
| PT | 3 | 0.026095 | 0.008698 | 8.80 | 0.050 |
| SP | 3 | 0.012413 | 0.004138 | 4.19 | 0.135 |
| RHA | 3 | 0.031887 | 0.010629 | 10.75 | 0.041 |
| MD | 3 | 0.021853 | 0.007284 | 7.37 | 0.068 |
| Error | 3 | 0.002966 | 0.000989 | ||
| Total | 15 | 0.095215 | |||

5. Confirmation Experiments
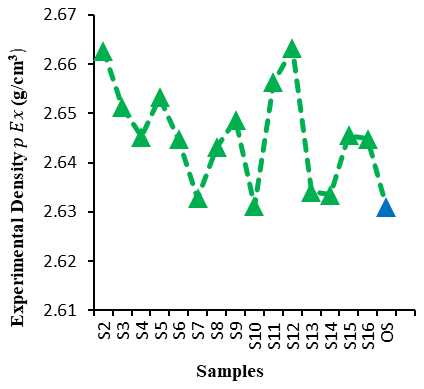
The purpose of the confirmation test was to evaluate the analysis's efficacy. The ideal set of parameters,as shown in Table 15 was used to prepare a optimized sample (OS), as indicated in Tables 16. From the analysis, it was found that the optimized sample (OS) showed increased tensile strength as compared to sixteen samples, as shown in Figure5(a). Similarly, it showed increased microhardness as compared to sixteen samples, as shown in Figure5(b). Also, it showed reduced wear as compared to sixteen samples, as shown in Figure5(c), and finally, it showed reduced density as compared to sixteen samples, as shown in Figure5(d).
5.1. Interaction Plot
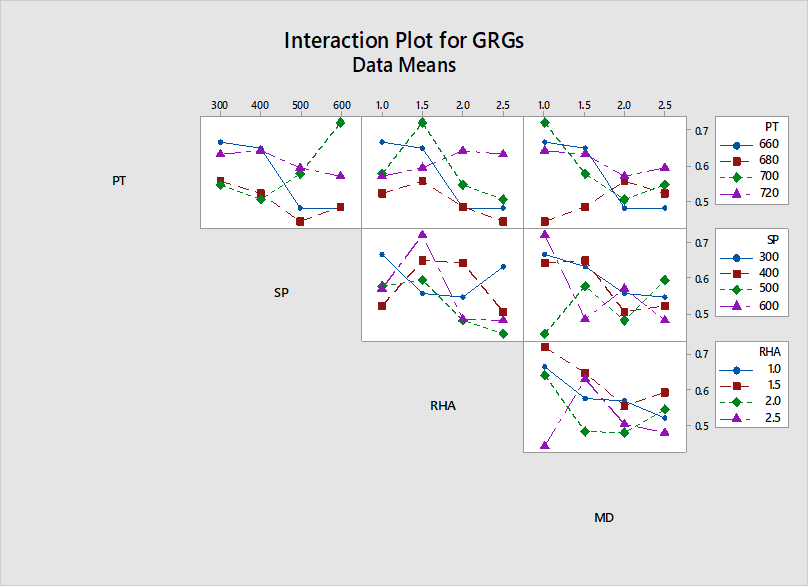
The interaction plot for Grey Relational Grades (GRGs) as shown in Figure6 shows significant interactions among the process parameters: Processing Temperature (PT), a process parameter (SP), Rice Husk Ash (RHA), and another process variable (MD). It is clear from the non-parallel and intersecting lines that the one parameter varies with changes in another showing interaction between them. Notable interactions are observed between PT and RHA, as well as between SP and MD, where the trends show considerable variations. The GRG values fluctuate across different levels of parameters, indicating their combined influence on the response.
Table 15: Optimal parameter setting for the hybrid metal matrix composites
| PT | SS | RHA | MD |
|---|---|---|---|
| 720֯ C | 300 RPM | 1.5 wt.% | 1 wt.% |
Table 16: Confirmation test results
| Sample | UTS (MPa) | HV | (g/cm3) | SWR (mm3/Nm) |
|---|---|---|---|---|
| OS | 154.3270 | 82.4156 | 2.6309 | 0.0053 |
6. Conclusions
The present study on the multi-response optimization of AA6063 hybrid composites using the Taguchi–Grey Relational Analysis approach leads to the following conclusions:
•Grey Relational Analysis effectively converted the multi-response problem into a single performance index, enabling simultaneous optimization of mechanical and tribological properties.
•The optimal combination of process parameters was identified as pouring temperature of 720°C, stirring speed of 300 rpm, RHA content of 1.5 wt.%, and marble dust content of 1 wt.%, yielding the highest overall performance.
•The developed composites exhibited improved tensile strength, hardness, and wear resistance under optimized conditions, demonstrating the effectiveness of hybrid reinforcement.
•ANOVA results revealed that RHA wt.% is the most significant parameter with a contribution of 33.49%, followed by processing temperature (27.41%), marble dust (22.95%), and stirring speed (13.04%).
•The relatively low error variance indicates good experimental reliability and consistency of results.
•The confirmation test results showed close agreement with predicted values, validating the effectiveness of the Taguchi–GRA methodology.
•The optimized parameters from Taguchi-based grey relational analysis were successfully identified.
•The interaction plot for Grey Relational Grades (GRGs) shows significant interactions among the process parameters.
Acknowledgements
I express my sincere gratitude to Swami Keshvanand Institute of Technology, Management & Gramothan, Jaipur, and Anand International College of Engineering, Jaipur, for their invaluable support and research facilities that contributed to the successful completion of this study. I am also thankful to IIT (ISM) Dhanbad for providing access to advanced laboratory facilities and assistance in conducting the experimental investigations.
References
- P. K. Krishnan, B. Mohammed, A. Kindi, and A. Mohammed, “Production and characterization of sustainable aluminum matrix composites reinforced with industrial waste materials via stir casting for lightweight and high-strength applications,” In EPJ Web of Conferences, 345, 01050(2026). doi:10.1051/epjconf/202634501050
- H. M. Alswat, “Sustainable and industry-ready metal matrix composites produced by stir casting and cryorolling,” Journal of composite science,10(2),95(2026).doi:10.3390/jcs10020095.
- N. E. Udoye, C. J. Chime, C. G. Nwosu, and O. Fayomi,“Mechanical characterization of AA6061/groundnut shell powder matrix composite,” E3S Web of Conferences, 684,03009(2026). doi:10.1051/e3sconf/202668403009.
- F. Ben and P. Apata, “Additive double-stir friction processing of Al₂O₃/AA6063 hybrid composites reinforced with coconut husks: Microstructure, mechanical and tribological performance,” Mater. Chem.Phys.,350,131881(2026). doi:10.1016/j.matchemphys.2025.131881.
- A. Apasi, D. S. Yawas, S. Abdulkareem, and M. Y. Kolawole, “Improving mechanical properties of aluminum alloy through addition of coconut shell ash,” J. Sci. Technol., 36 (3),34–43 (2016).doi:10.4314/just. v36i3.4
- B. Gugulothu, R. S. Kumar, and P. S. S. Kumar, “Development of stir-cast Al6063 hybrid composites with 5 wt.% fly ash and varying SiC reinforcements for improved mechanical and impact properties,” 247(1),27 (2026). doi:10.1007/s10751-026-02362-8.
- M. M. Boopathi, K. P. Arulshri, and N. Iyandurai, “Evaluation of mechanical properties of aluminium alloy 2024 reinforced with silicon carbide and fly ash hybrid metal matrix composites,” Am. J. Appl. Sci., 10(3),219(2013). doi:10.3844/AJASSP.2013.219.229.
- A. M. Razzaq, D. L. Majid, M. R. Ishak, and U. M. Basheer, “Effect of fly ash addition on the physical and mechanical properties of AA6063 alloy reinforcement,” Metals (Basel).,7 (11),1–15 (2017). doi:10.3390/met7110477.
- U. A. Williams, O. S. I. Fayomi, J. O. Ojediran, and K. M. Oluwasegun, “Integration and performance response of biowastes snail shell ash–reinforced AA6063 alloys: Interfacial effect, mechanical and corrosion properties,” Sci. African,31,03267 (2026). doi:10.1016/j.sciaf. 2026.e03267.
- U. A. Williams, O. S. I. Fayomi, and J. O. Ojediran, “Sustainable reinforcement of aluminium 6063 with plantain peel ash: Microstructural, mechanical, and corrosion performance,” Next Mater.,9,100986 (2025).doi:10.1016/j.nxmate.2025.100986.
- B. U. Odoni, F. O. Edoziuno, C. C. Nwaeju, and R. O. Akaluzia, “Experimental analysis, predictive modelling and optimization of some physical and mechanical properties of aluminium 6063 alloy-based composites reinforced with corn cob ash,” J. Mater. Eng. Struct., 7, 451–465 (2020).
- O. O. Joseph, J. Atiba, S. Ante, O. Joseph, and S. Eyenuro, “Effect of palm kernel shell reinforcement on the mechanical and corrosion properties of AA7075 aluminium alloy,” Key Eng. Mater.,1012, 79–88 (2025). doi:10.4028/p-v1hUjU.
- S. Tejyan, C. K. Ror, and N. Kumar, “Mechanical properties of SiC and neem leaf powder reinforced Al-6063 hybrid metal matrix composites,” Mater. TodayProc.,60,884–888(2022). doi:10.1016/j.matpr.2021.09.521.
- O. O. Daramola, O. A. Ogunsanya, O. S. Akintayo, I. O. Oladele, B. O. Adewuyi, and E. R. Sadiku, “Mechanical properties of Al6063 metal matrix composites reinforced with agro-waste silica particles,” Leonardo Electron. J. Pract. Technol.,33,1-14(2018).
- F. A. R. Rozhbiany and S. R. Jalal, “Influence of reinforcement and processing on aluminum matrix composites modified by stir casting route,” Adv. Compos.Lett.,28(2019). doi:10.1177/2633366X19896584.
- S. Madhankumar, R. Balamurugan, S. Rajesh, and K. M. Senthilkumar, “Fabrication of Al6063 alloy, silicon carbide and boron glass powder metal matrix composites in stir casting process and analysis of process variables,” Mater. Today, Proc.,42,529–535 (2020). doi:10.1016/j.matpr.2020.10.483.
- P. Sarmah and P. K. Patowari, “Mechanical and tribological analysis of fabricated Al6063-based MMCs with SiC reinforcement particles,” Silicon 15(6),2781-2796 (2023). doi:10.1007/s12633-022-02175-8.
- V. K. Sharma, V. Kumar, R. S. Joshi, and D. Sharma, “Experimental analysis and characterization of SiC and RE oxides reinforced Al-6063 alloy-based hybrid composites,” Int. J. Adv. Manuf. Technol., 108, 1173–1187 (2020).doi:10.1007/s00170-020-05228-7.
- V. Aswinprasad, V. S. Sriharish, C. Venkatesh, A. H. Meda, and N. Kamalakannan, “Experimental investigation of wear characteristics of aluminium 6063 hybrid composite reinforced with graphite and MoS₂,” Mater. Today, Proc.,22,3190-3196 (2020).doi:10.1016/j.matpr.2020.03.456.
- A. Biradar and M. Rijesh, “Feasibility of stir casting method for processing Al-6063/graphite composite,” Trans. Indian Inst. Met.,75 (2),407–416 (2022).doi:10.1007/s12666-021-02428-x.
- S. Singh, M. Garg, and N. K. Batra, “Analysis of dry sliding behavior of Al₂O₃/B₄C/Gr aluminum alloy metal matrix hybrid composite using Taguchi methodology,” Tribol. Trans., 58 (4),758–765 (2015). doi:10.1080/10402004.2015.1015757.
- S. P. Dwivedi and V. R. Mishra, “Physico-chemical, mechanical and thermal behaviour of agro-waste RHA-reinforced green emerging composite material,” Arab. J. Sci. Eng.,44 (9),8129–8142 (2019).doi:10.1007/s13369-019-03784-z.
- O. Olaniran, O. Uwaifo, E. Bamidele, and B. Olaniran, “An investigation of the mechanical properties of organic silica, bamboo leaf ash and rice husk reinforced aluminium hybrid composite,” Mater. Sci. Eng. Int. J.,3 (4),129–134 (2019).doi:10.15406/mseij.2019.03.00103.
- A. A. Adediran, K. K. Alaneme, I. O. Oladele, and E. T. Akinlabi, “Wear characteristics of aluminium matrix composites reinforced with Si-based refractory compounds derived from rice husks,” CogentEng.,7(1)(2020). doi:10.1080/23311916.2020.1826634.
- V. K. Sharma, S. Chaudhary, R. C. Singh, Sonia, Vikas, and V. Goel, “Reusing marble dust as reinforcement material for better mechanical performance: Studies on compositing aluminum matrix,” Mater. Res. Express, 6 (12) (2019).doi:10.1088/2053-1591/ab6702.
- S. Kashyap, H. Tripathi, and N. Kumar, “Mechanical properties of marble dust reinforced aluminum matrix structural composites fabricated by stir casting process,” Mater. Phys. Mech.,48 (2), 282–288 (2022). doi:10.18149/MPM.4822022_11.
- H. S. Jailani, A. Rajadurai, B. Mohan, A. S. Kumar, and T. Sornakumar, “Multi-response optimisation of sintering parameters of Al–Si alloy/fly ash composite using Taguchi method and grey relational analysis,” Int. J. Adv. Manuf. Technol.,45 (3–4),362–369 (2009). doi:10.1007/s00170-009-1973-3.
- S. Dharmalingam, R. Subramanian, and M. Kök, “Optimization of abrasive wear performance in aluminium hybrid metal matrix composites using Taguchi–grey relational analysis,” Proc. Inst. Mech. Eng. Part J: J. Eng. Tribol., 227 (7),749–760 (2013).doi:10.1177/1350650112467945.
- P. Jayaraman and L. Mahesh Kumar, “Multi-response optimization of machining parameters of turning AA6063-T6 aluminium alloy using grey relational analysis in Taguchi method,” Procedia Eng.,97,197–204(2014) doi:10.1016/j.proeng.2014.12.242.
- A. K. Mishra, V. Kumar, and R. K. Srivastava, “Optimization of tribological performance of Al-6061T6–15% SiCp–15% Al₂O₃ hybrid metal matrix composites using Taguchi method and grey relational analysis,”2(4),351–361 (2014).doi:10.4236/jmmce.2014.2404.
- N. Kaushik and S. Singhal, “Hybrid combination of Taguchi–GRA–PCA for optimization of wear behavior in AA6063/SiCp matrix composite,” Prod. Manuf.Res.,6(1),171-189(2018). doi:10.1080/21693277.2018.1479666.
- E. M and A. K, “High speed machining and optimization of Al/SiC/Gr hybrid metal matrix composites using ANOVA and grey relational analysis,” Aust. J. Mech. Eng., 20 (3),883–893 (2022). doi:10.1080/14484846.2020.1761587.
- M. K. Rahiman, S. Santhoshkumar, and P. M. Kumar, “Experimental analysis on friction stir welded AA7075/AA6061 using Taguchi grey relational analysis,” Mater. Today, Proc.,45,3290–3295 (2021). doi:10.1016/j.matpr.2020.12.519.
- S. V. Alagarsamy, M. Ravichandran, and M. Meignanamoorthy, “Multi-objective optimization of dry sliding wear control parameters for stir-cast AA7075–TiO₂ composites using Taguchi–grey relational approach,” Aust. J. Mech. Eng., 20 (5), 1453–1462(2022).doi:10.1080/14484846.2020.1815997.
- I. Sabry, A. M. Hewidy, M. Alkhedher, and A. H. I. Mourad, “Analysis of variance and grey relational analysis for optimization of 6061-T6 flange friction stir welding parameters,” Int. J. Light. Mater. Manuf., 7(6),773–792(2024).doi:10.1016/j.ijlmm.2024.06.006.
- B. A. Gemeda, D. K. Sinha, G. A. Mengesha, and S. S. Gautam, “Multi-objective parametric optimization of hybrid reinforced titanium MMC using Taguchi–grey relational analysis,” J. Eng. Appl. Sci., 71 (1), 1–22 (2024). doi:10.1186/s44147-024-00427-5.
- R. Chandel, N. Sharma, and S. A. Bansal, “Recent developments in aluminum-based hybrid composites for automotive applications: A review,” Emergent Mater.,4(5),1243–1257(2021). doi:10.1007/s42247-021-00186-6.
- B. S. Babu, P. Prathap, T. Balaji, D. Gowtham, S. S. Adi, R. Divakar, and S. Ravichandran, “Studies on the mechanical properties of aluminum-based hybrid metal matrix composites,” Mater. Today, Proc., 33,1144–1148 (2020).doi:10.1016/j.matpr.2020.07.342.
- L. Cigarruista Solís, M. Chen Austin, E. Deago, G. López, and N. Marin-Calvo, “Rice husk-based insulators: Manufacturing process and thermal potential assessment,” Materials (Basel).,17 (11) (2024).doi:10.3390/ma17112589.
- A. U. Abdullahi, “Study of the physical and mechanical properties of rice husk ash reinforced plastic composite,” J. Eng. Technol.,10 (2),1–8 (2015).
- S. Oli and Y. Luo, “Characterization and design of three-phase particulate composites: Microstructure-free finite element modeling vs analytical micromechanics models,” Materials (Basel)., 16 (18) (2023).doi:10.3390/ma16186147.
- S. Tejyan, C. Lal, C. K. Ror, and V. Singh, “Influence of marble waste reinforcement on mechanical properties and sliding wear behavior of aluminium alloy MMC,” J. Eng. Res.,13(1),131-141(2024). doi:10.1016/j.jer.2023.08.002.
- A. Kamboj, S. Kumar, and H. Singh, “Fabrication and characterization of Al6063/SiC composites,” Proc. Inst. Mech. Eng. Part B: J. Eng. Manuf., 227 (12),1777–1787(2013). doi:10.1177/0954405413493618.
- A. Kumar, “Casting and characterization of Al6063/SiC nanocomposites produced using stir casting method,” Mater. Today, Proc., 5(11),23853-23862 (2018).doi:10.1016/j.matpr.2018.10.177.
- R. Kumar and V. Kumar, “Optimization of process parameters for stir-cast AA6063 MMC on hardness, tensile strength and impact energy,” Int. J. Mech. Eng. Technol., 8 (12),108–117 (2017).
- R. Yadav, S. P. Dwivedi, and V. K. Dwivedi, “Effect of casting parameters on tensile strength of chrome-containing leather waste reinforced aluminium composite using RSM,” Evergreen, 9 (4), 1031–1038 (2022). doi:10.5109/6625716.
- R. Kumar and K. N. Bairwa, “Optimizing Al6061-based hybrid MMCs: Microstructural transformations and enhanced mechanical properties,” Evergreen,10(4),2161–2172(2023). doi:10.5109/7160891.
- D. Shrinivasa and G. V. N. Prakash, “Effect of TiO₂ and graphite reinforcement on aluminium 6061 composites fabricated by stir casting,” Evergreen, vol. 11 (3),1770–1776 (2024). doi:10.5109/7236829.
- K. K. Alaneme and K. O. Sanusi, “Microstructural characteristics, mechanical and wear behaviour of aluminium hybrid composites reinforced with alumina, rice husk ash and graphite,” Eng. Sci. Technol. Int. J.,18 (3),416–422 (2015).doi:10.1016/j.jestch.2015.02.003.
- K. K. Alaneme and B. J. Bamike, “Characterization of mechanical and wear properties of aluminium-based composites reinforced with quarry dust and silicon carbide,” Ain Shams Eng. J.,9 (4), 2815–2821 (2018). doi:10.1016/j.asej.2017.10.009.
- K. S. L. Narayana, M. M. Benal, and H. K. Shivanand, “Effect of graphite on aluminium matrix composites fabricated by stir casting route: A review,” Mater. TodayProc.,45,327–331(2020).doi:10.1016/j.matpr.2020.11.051.
- D. A. Ashebir, G. A. Mengesha, D. K. Sinha, and Y. B. Bereda, “Multi-response optimization of process and reinforcement parameters of hybrid reinforced Al matrix composites using Taguchi–grey relational analysis,” Eng. Res. Express,4 (4) (2022).doi:10.1088/2631-8695/acaa8b