
Abstract
Compressed natural gas (CNG) is increasingly promoted as a lower-carbon alternative to petrol, yet important knowledge gaps remain regarding the influence of auxiliary loads such as air conditioning (AC) on retrofitted CNG vehicle performance and the limited availability of tailpipe idle emission data for carbon monoxide (CO), carbon dioxide (CO₂), and nitrogen oxides (NOx). This study addresses these gaps through a real-world comparative assessment of a petrol-powered passenger vehicle operated on petrol and on full CNG substitution, with minimal retrofitting to preserve baseline drivability. Road testing employed the Total Fuel Replacement method along mixed-traffic intercity routes to quantify fuel economy and operating costs, supplemented by flat-bed dynamometer measurements of wheel torque and power under AC-on and AC-off wide-open-throttle conditions. CNG operation resulted in an 18.84% reduction in wheel torque and a 33.31% reduction in wheel power under AC load, accompanied by a 15–20% decrease in fuel economy. Despite this, operating costs decreased by up to 48.13% due to the lower unit price of CNG. Idle emission measurements indicated substantial reductions in CO (80%) and CO₂ (35%), while NOx increased by a factor of five but remained low in absolute terms. Overall, the findings provide integrated technical and economic evidence that supports informed decision-making for broader CNG utilisation in passenger transport.
Keywords: CNG, Exhaust component concentration, Performance, Petrol, Real-driving, Total fuel replacement
Outline
1. Introduction
Internal combustion engines (ICE) remain the dominant propulsion technology for modern transportation and power generation. Their applications span generators, power plants, and road vehicles1), which account for nearly all global ICE use. Despite increasing interest in electrification, approximately 99.8% of vehicles worldwide are still powered by ICE, with 95% relying on liquid fossil fuels such as diesel and petrol2). This substantial reliance poses significant environmental challenges. To curb emissions, the Government of Indonesia has enacted presidential regulations to accelerate electric vehicles (EV) adoption3). However, it faces several hurdles, including driving range, battery capacity, charging time, infrastructure availability, and high vehicle cost. Consequently, ICEs are expected to remain relevant in the transportation sector for the foreseeable future4).
The environmental impact of ICEs is well-documented. Combustion of fossil fuels emits carbon dioxide (CO₂), carbon monoxide (CO), nitrogen oxides (NOx), sulphur dioxide (SO₂), particulate matter (PM), and unburned hydrocarbons (UHC), which collectively contribute to air pollution, acid rain, and climate change5). CO₂ is the principal greenhouse gas (GHG) responsible for global warming, followed by methane (CH₄), among other pollutants6). This context highlights the need for cleaner alternative fuels. Key options include bioethanol, natural gas, and biodiesel7,8). Among them, natural gas offers the highest substitution potential because it can function in dual-fuel diesel systems and as a primary fuel in spark-ignition engines9), while providing lower carbon intensity and favourable combustion behaviour.
Natural gas, mainly composed of CH4 by approximately 85%, has gained significant traction for its large reserves, wide resource base, and lower emissions compared to conventional petrol10). In 2018, global natural gas reserves were estimated at around 197 trillion cubic meters, with annual usage of 2.21 million tons of energy11). For practical application as a transportation fuel, natural gas is commonly stored in a compressed form known as compressed natural gas (CNG). CNG possesses a superior research octane number (RON), allowing engines to achieve elevated compression ratios (CR), substantially decreasing volume, hence enhancing efficiency and transportation simplicity12). However, several drawbacks include lower flame speed and energy density, possibly raising engine temperatures and reducing engine torque13). Furthermore, its volumetric disadvantages necessitate 0.92 m3 of natural gas to match the energy of one litre of petrol. Although compression and ignition strategies can partly address these issues, widespread adoption of CNG still faces technical and infrastructural barriers.
The international uptake of CNG as a transportation fuel has been uneven. In Europe, adoption is limited by reliance on imported natural gas, while in parts of Asia and Latin America, cultural, infrastructural, and economic challenges persist14). In China, CNG vehicles are growing in number but remain a minority share of the total fleet15). Indonesia initiated the use of CNG in transportation as early as 1986, mandating its use for Jakarta’s taxi fleet. However, the program suffered from weak management and insufficient infrastructure, resulting in fewer than 7,000 CNG vehicles by 1998. A renewed policy in 2006 sought to reduce petrol consumption by 20% and increase natural gas utilisation to above 30% by 202516). The geopolitical factors and rising oil prices have renewed interest in CNG. For instance, in September 2022, the Indonesian Ministry of Energy and Mineral Resources raised subsidised petrol prices by 30% and set CNG at a competitive rate of IDR 4,500 per litre petrol-equivalent (LPE), fostering interest in both cost and eco-friendly scenarios17).
CNG also aligns with Indonesia’s tightening emission regulations. For vehicles produced before 2007, allowable CO₂ and UHC limits were set at 3% (30,000 ppm) and 700 ppm, respectively, and later revised to 1.5% (15,000 ppm) and 200 ppm18). Compared to petrol engines, CNG engines typically produce lower CO₂, CO, and HC emissions but often higher NOx levels19). Nevertheless, engine modifications such as elevated compression ratios and optimised ignition timing can reduce NOx20). This result increases the viability of CNG as a fuel replacement candidate.
Extensive research has investigated CNG’s performance and emissions. Studies consistently report significant reductions in CO₂, CO, and HC when substituting petrol with CNG, at the sacrifice of brake power and NOₓ emissions. Tabar et al.21) evaluated the optimal blend of CNG and petrol on a 1.7 L turbocharged engine and found that bi-fuel operation improved fuel efficiency and reduced emissions, except for NOx. Similarly, Jahirul et al.22) examined performance and emissions on a bi-fuel 1600 cc 4-cylinder engine at 50% and 80% throttle positions, reporting up to a 20% reduction in brake-specific fuel consumption (BSFC) and brake power when using CNG. Another study in Iran collected emission data from 60 privately owned vehicles using CNG and petrol, revealing a 70% decrease in cumulative distance-based emission factors for HC and NOx19). Significant emission reductions have also been noted in CNG-retrofitted, multiport fuel injection engines, up to 90% in CO₂ and comparable NOx reductions under partial load, while offering marginal improvements in brake specific energy consumption (BSEC)23). Additional work involving various injection techniques on a 500 cc spark ignition (SI) engine showed emission reductions ranging from 15% to 63% across UHC, CO₂, NOx, and CO, along with up to 10% gain in efficiency using direct CNG injection24).
Critical gaps remain in the literature despite substantial advances. First, the influence of auxiliary engine loads, particularly air conditioning (AC), on wheel torque and power in CNG-fueled vehicles is rarely examined, even though AC operation imposes additional engine load and alters combustion behaviour, drivability, and fuel consumption. Second, idle exhaust emissions, especially CO, CO₂ and NOx, remain underreported despite idling being recognised as a significant contributor to urban emissions in developing countries. Only a few studies, such as Lejda et al.25), have conducted authentic on-road comparisons of CO and CO₂ emissions between CNG and petrol vehicles.
To address these gaps, this study presents a real-world comparative evaluation of CNG and petrol in a petrol-based passenger vehicle, focusing on power–torque performance under AC-on and AC-off conditions and tailpipe emissions during idle. The assessment includes dynamometer-based wheel torque and power under wide-open throttle (WOT), fuel economy, total fuel consumption, fuel cost savings, and idle emissions of CO₂, NOx, and CO, collectively providing a comprehensive representation of both technical performance and economic feasibility. Only minor hardware interventions, such as the installation of a slave ECU and a CNG rail port, were applied to preserve the vehicle’s original configuration. The findings are expected to deliver practical insights into drivability, fuel efficiency, and emissions under realistic operational conditions, contributing valuable technical input for policymakers evaluating the feasibility of large-scale CNG adoption.
2. Materials and Methodology
The nationwide standard fuel with a Research Octane Number (RON) of 90 was used solely as petrol in this study. The other tested fuel, CNG, was stored in a 20 MPa high-pressure container and delivered to the engine via a converter that reduced the pressure to 0.18 MPa before injection into the intake manifold. The converter (manufactured by Lovato) incorporates manifold absolute pressure (MAP) compensation to maintain stable fuel delivery across varying engine operating conditions. The CNG used in this study was supplied from the Jakarta pipeline distribution, with an average composition of 89% CH₄, 3.5% C₂H₆, 1.3% C₃H₈, and 4.6% CO₂. These values comply with the Indonesian Ministry of Energy and Mineral Resources CNG fuel specifications for domestically marketed transportation, which require a minimum 77% CH₄, a maximum 8% C₂H₆, 4% C₃H₈, and 5% CO₂26). Table 1 summarises both fuel properties.
All experiments implement the whole-fuel substitution approach. When the vehicle operated on petrol, the CNG supply valve was completely closed, and vice versa. The car features a fuel synchronisation system that immediately reverts to petrol upon detecting a power deficiency during the CNG test. To avert this incident, the engine speed was sustained below 5,000 rpm during the road tests. A 2013 petrol-powered four-wheeled passenger vehicle was chosen for road testing. Table 2 enumerates the exact specifications of the vehicle. A dynamometer is used to measure the engine’s torque and power.
2.1. Road Test Methodology
Three composite CNG cylinders (Type IV, each 38 L) were retrofitted to the vehicle, mounted side by side and connected in parallel to a single line leading to the pressure reducer. The empty cylinders weighed 31.2 kg in total, and when fully charged at 20 MPa, the added payload reached 49 kg. Accordingly, the gross vehicle weight (GVW) during CNG operation was 1,889 kg. During operation, the only variation in vehicle mass originated from the
| Properties | Petrol | CNG |
|---|---|---|
| Fuel type | Liquid | Gas |
| RON | 90 | 120 |
| Calorific Value (MJ/kg) | 44.21 | 48.49 |
| Density @15 oC and 1 atm (kg/m3) | 733 | 0.793 |
| Aromatics (% v/v) | 42.8 | - |
| Benzene (% v/v) | 3.2 | - |
| Natural gas composition at Jakarta’s CNG refuelling station (% by volume) | ||
| Methane (CH4) | - | 89 |
| Nitrogen (N2) | - | 0.6 |
| Carbon dioxide (CO2) | - | 4.6 |
| Ethane (C2H6) | - | 3.5 |
| Propane (C3H8) | - | 1.3 |
| i-Butane (iC4) | - | 0.3 |
| n-Butane (nC4) | - | 0.3 |
| i-Pentane (iC5) | - | 0.1 |
| n-Pentane (nC5) | - | 0.1 |
| n-Hexane (nC6) | - | 0.2 |
Table 2: Specifications of vehicle28)
| Description | Specification |
|---|---|
| Vehicle model | Daihatsu Luxio (Indonesia) |
| Engine model | Toyota 3SZ-VE |
| Engine type | 1.5 L Petrol Engine, in-line 4 cylinders, 16 Valve DOHC |
| Fuel supply system | Electronic fuel injection (EFI) |
| Bore × stroke | 72.0 × 91.8 mm |
| Volume of displacement | 1.495 L |
| Compression Ratio (CR) | 9:1 |
| Fuel tank capacity | 43 L |
| Transmission | Manual, 5-speed gearbox |
| Power Output (Max.) | 71.6 kW @ 6,000 rpm |
| Torque Output (Max.) | 134 Nm @ 4,400 rpm |
| Front wheel track | 1,440 mm |
| Rear wheel track | 1,420 mm |
| Length × Width × Height | 4,215 × 1,710 × 1,915 mm |
| Wheel base | 2,650 mm |
| Ground clearance | 180 mm |
| Tire size | 195/65 R15 |
| Gross weight | 1,840 kg |
| Front axis maximum load | 820 kg |
| Rear axis maximum load | 1,230 kg |
consumed fuel. For the longest single route, approximately 21.5 L of petrol (≈15.9 kg) was required. In comparison, a complete cycle could deplete the full CNG charge (≈17.8 kg). This corresponds to a maximum reduction of 33.7 kg, equivalent to 1.8% of the retrofitted GVW. Previous research has shown that such minor mass variations have negligible effects on FC and emissions, whereas the payload-to-GVM ratio remains a key factor in reducing fuel use, particularly in heavy-duty vehicles29).
The road test was conducted three times for each route and fuel type, carried out in two phases on separate days. In the first phase, completed within a single day, the test covered 237 km on the 1st Route (Serpong to Bandung) using CNG and 142.4 km on the 2nd Route (Bandung to Jakarta) using petrol. In the second phase, conducted on a different day, the 1st Route was tested with petrol, and the 2nd Route with CNG, with each condition repeated three times to ensure consistency. This test is done to accommodate the vehicle’s limited CNG storage capacity and the lack of combined CNG-petrol refuelling stations in Bandung, where only petrol is available. CNG refuelling was only possible at a Pertamina station in Jakarta, ensuring that the vehicle could safely complete the test cycle, as illustrated in Figure 1, which shows the allocation of fuel types across the 1st Route and 2nd Route in Phases 1 and 2.
1st Route exhibited an average upward gradient of 1.7%,

commencing at 19 m above sea level and ascending to 1,515 m before descending to 702 m, with the latter segment presenting more challenging terrain comprising slow, ascending, and sinuous roads. Conversely, the 2nd Route had a more linear profile, with an average downward gradient of 0.4%, starting at 814–899 m and terminating more than 20 m above sea level. The route selection followed the SAE standard30), incorporating urban, suburban, and interstate driving cycles (UDC, SDC, and IDC), and all tests were performed at consistent times of day under clear and favourable weather conditions to minimise the influence of meteorological conditions and traffic variability. The road test routes and their corresponding elevation profiles are illustrated in Figure 2, while the summary of test conditions is presented in Table 3.
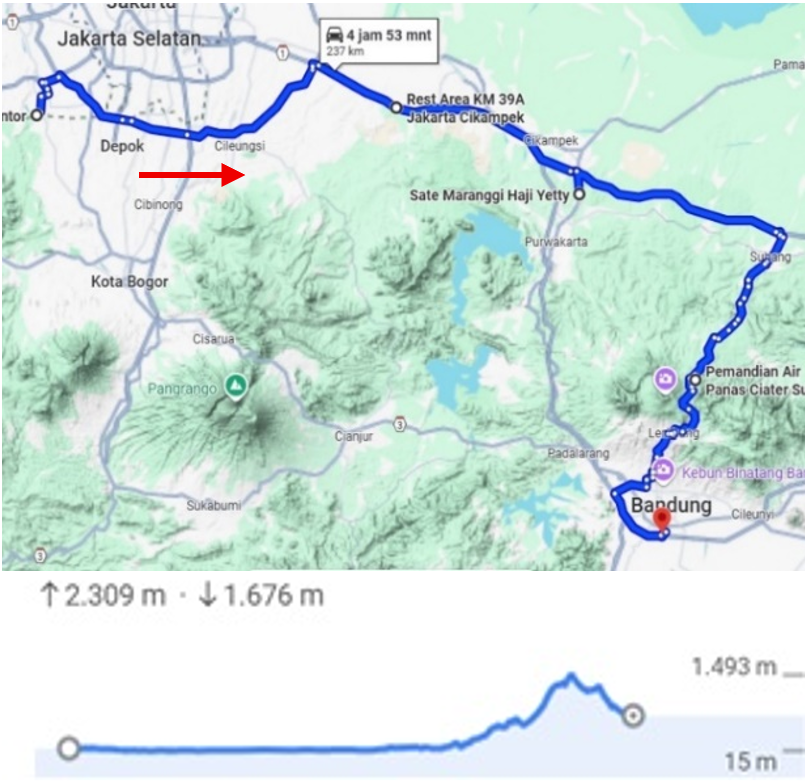
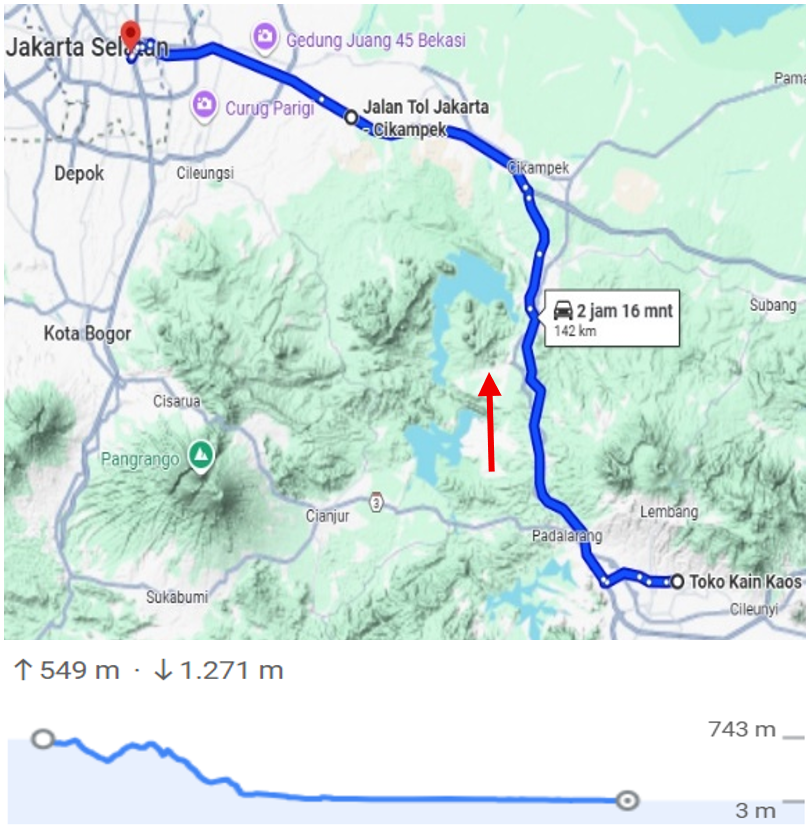
Table 3: Road test parameter
| Parameter | 1st Route | 2nd Route | Unit |
|---|---|---|---|
| Start point | Serpong | Bandung | - |
| End point | Bandung | Jakarta | - |
| Distance | 237 | 142.4 | km |
| Travel time CNG | 294 | 131 | min |
| Travel time petrol | 310 | 136 | min |
| Average speed CNG | 48.4 | 65.2 | km/h |
| Average speed petrol | 45.8 | 62.7 | km/h |
| Maximum speed CNG | 114 | 107 | km/h |
| Maximum speed petrol | 112 | 109 | km/h |
| Altitude difference | 1496 | 879 | m |
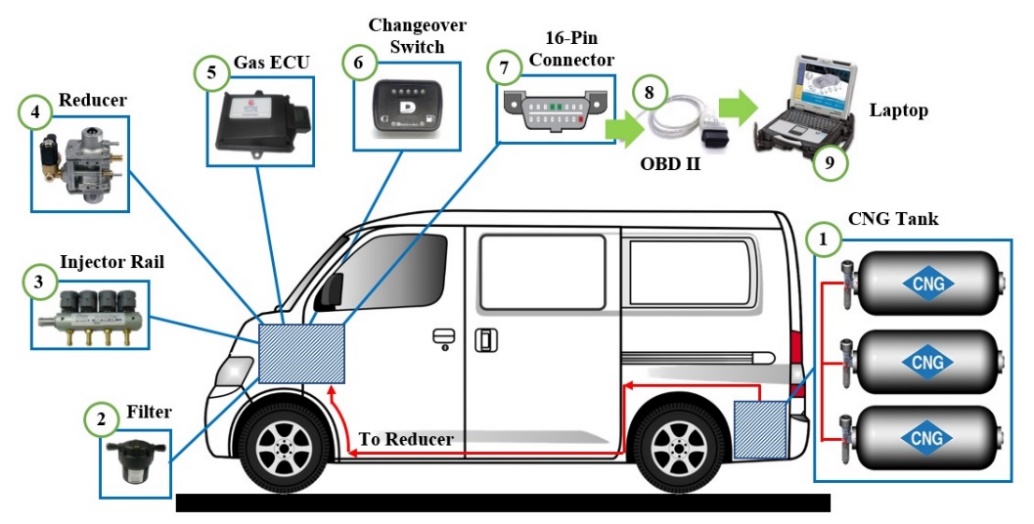
An ECU governs the engine’s fuel injection and overall operation. For the CNG application, a third-party Lovato ECU (LECU) was installed and integrated with the vehicle’s original ECU (EECU). The LECU, managed by Lovato Easy Fast Smart software, controlled CNG injection while maintaining synchronisation with the EECU to enable seamless switching between petrol and CNG modes. During CNG operation, the LECU transmitted control signals that allowed the EECU to continue functioning as if the engine were fuelled by petrol. Operating data were retrieved from the EECU through an On-Board Diagnostic-II (OBD-II) interface (Mini VCI J2534 scanner)30) and subsequently used to compute the average FC of both fuels. Figure 3 illustrates the schematic of the test equipment.
The vehicle’s FC during road tests was evaluated using two methods to ensure accuracy and reliability, with the primary method being the full-to-full (FtF) technique. For each test, the petrol tank or CNG cylinders were filled to their respective full levels, using automatic nozzle cut-off for petrol and initial pressure for CNG, at Pertamina fuel stations in accordance with the Trade Metrology Standards of the Republic of Indonesia, which specify a maximum permissible error of ±0.5% for fuel meters and dispensers31). After completing the route, the fuel or gas was refilled under the same conditions, and the difference in refilled quantity represented the total consumption over the test distance. Each test was repeated three times to minimise random variations, and fuel volumes were normalised to the distance recorded by the vehicle’s odometer to calculate average consumption in kilometres per litre (km/L). The FtF technique is widely recognised for its simplicity and ability to measure FC directly over the entire driving distance30).
FC was also calculated from data collected through the On-Board Diagnostics (OBD-II) system, which continuously recorded key parameters, including intake air temperature (IAT), manifold absolute pressure (MAP), and engine speed (RPM), during the test. This method provided an additional reference to validate the FtF measurements. Alternatively, FC can be estimated using Equation 1–432,33).
To estimate the inducted air mass, the integrated manifold parameter (IMAP), which represents a synthetic index derived from MAP, RPM, and IAT, was first calculated using Equation 1:
where (kPa) is the manifold absolute pressure, (r/min) is the engine speed, and (K) is the intake air temperature.
The initial volumetric efficiency () was assumed to be 75% based on the OBD-II specification33), and then corrected using the short-term fuel trim (STFT) to account for real-time mixture compensation performed by the ECU, as expressed in Equation 2:
the corrected volumetric efficiency () was subsequently used to estimate the mass airflow (MAF) using Equation 3:
where (g/s) is the total mass airflow, is the ideal gas constant (8.314 J/mol.K), is the molecular mass of air (28.9647 g/mol)35), and (L) is the engine displacement (1.495 L as per vehicle specification). Finally, the volumetric fuel flow (FF) was determined using Equation 4:
where (L/h) is the volumetric fuel flow, is the stoichiometric air–fuel ratio (14.6 for petrol and 16.8 for CNG, respectively, based on stoichiometric combustion considerations)34), and (kg/L) is the density of the corresponding fuel.
FC for each fuel type was determined using both the FtF and Mini VCI methods. Fuel economy (FE) was calculated for petrol (km/L) and CNG (km/LPE) by dividing the distance recorded by the vehicle odometer by the total volume of fuel consumed during each route. The mileage cost was then derived by converting the fuel required per kilometre into Indonesian rupiah, based on prices of IDR 10,000/L for petrol and IDR 4,500/LPE for CNG.
To enable a consistent comparison between petrol and CNG operation, FC and operating costs were additionally expressed in terms of LPE. In this study, 1 LPE corresponds to the amount of fuel that contains the same energy as 1 L of petrol. Based on the fuel properties in Table 1, the petrol used in this study has a calorific value (CV) of 44.214 MJ/kg and a density of 0.733 kg/L, while the CNG has a calorific value of 48.491 MJ/kg and a density of 0.793 kg/m³. Accordingly, the volume of CNG that provides the same energy content as 1 L of petrol is calculated using Equation 5:
(5)
substituting the values, 1 LPE corresponds to 0.843 m³ of CNG, which is equivalent to approximately 0.67 kg.
2.2. Flat-bed Dynamometer Test
The vehicle’s wheel horsepower, wheel torque, and engine speed were measured using a Mustang MD-AWD-150 chassis dynamometer35). Each test was repeated three times to ensure reproducibility. The dynamometer was capable of simulating actual road loads under controlled and safe conditions, while the connected diagnostic equipment enabled real-time monitoring of vehicle performance
Table 4: Dynamometer specification
| Description | Specification |
|---|---|
| Manufacturer/Model | Mustang/MD-AWD-150 |
| Max. Horsepower | 1491.4 kW |
| Max. Absorption | 466.06 kW |
| Loading Device | Air-cooled eddy current power absorber |
| Inertia | 571.53 kg |
| Max. Speed | 249.45 km/h |
| Controls | Closed-loop digital controller with web-based Hole Shot Software |
| Rolls/Wheelbase | Precision-machined & dynamically balanced, knurled rolls |
| Roll Decelerator | Allows vehicle deceleration without the use of vehicle brakes. |
| Air Requirements | 0.7929 MPa, dry, regulated, oil-free |
| Power Requirements | 115 VAC, single phase, 60 Hz, 15 Amps (computer) 230 VAC, single phase, 60 Hz, 40 Amps (dynamometer) |
| Axle Weight | 2721.55 kg |
| Dynamometer Weight | 3265.87 kg |
parameters. Detailed specifications of the dynamometer are presented in Table 4.
Performance testing was carried out under wide-open throttle (WOT) conditions, with the maximum fuel amount injected relative to the total incoming air at a stoichiometric ratio36). During each test, wheel torque and horsepower were recorded as the throttle was steadily increased until the engine reached 6,000 rpm. Tests were performed under two operating conditions: with air conditioning switched on (ACON) and off (ACOFF).
2.3. Pollutant Concentrations Measurement
The pollutant concentrations were quantified using a gas analyser (E-Instruments E4500-C) in compliance with the Indonesian standard SNI 09-7118.1-2005 for spark-ignition vehicles under idle conditions37). The evaluated vehicle is classified as an “M Category”, defined as a motorised passenger vehicle with four or more wheels. The pollutant concentration measurement procedure was performed as follows:
1)Vehicle preparation: The car was positioned on a flat surface, the silencer was checked for leaks, and the engine temperature was verified to be within the normal range (60-70 °C). The lights and air conditioning were turned off, and the ambient temperature was recorded.
2)Throttle adjustment: The throttle was opened to 2,900-3,100 rpm and maintained for 60 seconds, then returned to idle.
3)Probe insertion: The measuring probe was inserted approximately 30 cm into the tailpipe downstream of the three-way catalytic converter (TWC) while the engine idled at 600-1,000 rpm.
4)Pollutant concentrations data collection: After probe insertion, the engine and exhaust gas were stabilised for at least 3 min, exceeding the electrochemical sensor response time (T90 = 20-50 s depending on the pollutant) to ensure steady state conditions. Pollutant concentrations (CO, CO₂, and NOx) were then recorded continuously for 60 s.
Each measurement was repeated five times to ensure reliability and accuracy. Factors influencing measurement accuracy included parallax error, environmental fluctuations, device calibration, and system noise. Measurement uncertainties associated with span drift, calibration gas, and linearity were quantified in accordance with EU Regulation 2017/1154, assuming ±2% of the reading for each component. The uncertainty for each pollutant was calculated using Equation 6, which estimates the standard uncertainty () from repeated measurements, and the combined uncertainty for each pollutant and fuel type was determined using the root-sum-of-squares method (Equation 7)38). Each pollutant measurement (CO, CO₂, and NOx) was evaluated independently for CNG and petrol operation to account for differing test conditions. Relative uncertainty values are presented as error bars in the Figures, with a coverage factor of k = 2 corresponding to a 95 % confidence level.
where denotes the standard deviation of repeated measurements, n is the number of measurements, and the in represents each uncertainty component. The combined uncertainties ( for each pollutant with its fuel type and specifications of the emission gas analyser are presented in Table 5 and Table 6, respectively.
Table 5: Uncertainty per pollutant and fuel type
| Parameter | Expanded uncertainty (%) | |
|---|---|---|
| CNG | Petrol | |
| CO | 4.99 | 4.82 |
| CO2 | 4.74 | 4.79 |
| NOx | 4.80 | 4.88 |
Table 6: Specifications of the emission gas analyser
| Measurement | Sensor | Range | Resolution | Accuracy |
|---|---|---|---|---|
| O2 | Electrochemical | 0–25% vol | 0.1% vol | ±0.2% vol |
| CO | Electrochemical | 0–500 ppm | 0.1 ppm | ±2 ppm (0–40 ppm) ±5% measured value (40.1–500 ppm) |
| NO/NOx | Electrochemical | 0–500 ppm | 0.1 ppm | ±2 ppm (0–40 ppm) ±5% measured value (40.1–500 ppm) |
| CO2 | Calculated | 0–99.9% vol | 0.1% vol | - |
3. Results and Discussion
3.1. Fuel Consumption and Cost Comparison
Table 7 presents a comparison of FC, FE, and mileage costs (IDR/km) for both petrol and CNG across two driving routes. Under the FtF evaluation, petrol consistently delivered higher volumetric fuel efficiency, achieving 11.48 km/L and 12.09 km/L on the 1st and 2nd routes, respectively, whereas CNG attained 9.96 km/LPE and 10.10 km/LPE. In terms of total fuel consumed, petrol required 20.64 L and 11.78 L on the 1st and 2nd routes, compared to an energy-equivalent CNG volume representing a 15.3% and 19.7% increase each. Despite its lower volumetric fuel efficiency, CNG offered significant economic benefits due to its lower unit price. On the 1st route, CNG provided a cost savings of 48.13%, while on the 2nd route, the savings were 46.14%. The slightly higher cost savings on the 1st route can be attributed to its rougher terrain, which suggests that CNG advantages become more pronounced under conditions requiring higher engine load.
FC and mileage cost were also estimated using OBD-II data to provide an alternative assessment. With this method, petrol achieved 11.55 km/L and 12.31 km/L on the 1st and 2nd routes, whereas CNG attained 9.07 km/LPE and 10.66 km/LPE, respectively. Petrol’s total FC was 20.52 L and 11.57 L, while CNG required 26.13 LPE and 13.36 LPE. Mileage cost savings for CNG were 42.7% (1st route) and 48.0% (2nd route). Overall, these results indicate that while petrol provides higher volumetric fuel efficiency, CNG offers notable economic advantages, supporting its
Table 7: Comparison of fuel consumption and mileage costs
| Method | Fuel type | Fuel economy (km/L for petrol / km/LPE for CNG) | Total fuel consumption (L for petrol / m3 (LPE) for CNG) | Fuel cost (IDR/km) | |||||
|---|---|---|---|---|---|---|---|---|---|
| 1st Route | 2nd Route | 1st Route | 2nd Route | 1st Route | Cost saving (%) | 2nd Route | Cost saving (%) | ||
| Full-to-Full | Petrol | 11.48 | 12.09 | 20.64 | 11.78 | 871.08 | 48.13 | 827.13 | 46.14 |
| CNG | 9.96 | 10.10 | 20.06 (23.80) | 11.89 (14.10) | 451.81 | 445.54 | |||
| Calculation based on OBD-II | Petrol | 11.55 | 12.31 | 20.52 | 11.57 | 865.80 | 42.70 | 812.35 | 48.03 |
| CNG | 9.07 | 10.66 | 22.03 (26.13) | 11.26 (13.36) | 496.14 | 422.14 | |||
potential adoption in real-world vehicular applications10,14).
These findings correspond with other prior research, indicating that petrol-fuelled engines exhibit greater efficiency than their counterparts39,40). Conversely, some research findings indicate that CNG may surpass petrol in efficiency in certain situations41). This disparity can likely be attributed to differences in research methodology and engine specifications, specifically a higher compression ratio (CR), CV-based FC calculation, tailored CNG-powered vehicle design, and engine optimisation. Engines with higher CRs tend to benefit from CNG’s properties, as CNG’s BSFC and performance improve when operated with higher CR39,42), which is highly correlated to its high-octane rating (RON 120). Specifically, CNG is more efficient by a small margin in a 14:1 CR engine than petrol, while petrol is superior on a 10:1 CR engine43). An engine with greater cylinder volume also provides a significant advantage for CNG utilisation41). The common rule of thumb among researchers is that petrol, with a CV of 46.536 MJ/kg, presumably achieves 12 km/L as FC, while CNG’s higher CV of 47.7 MJ/kg shall prolong the FC to 13.5 km/L, averaging 1.5 km/LPE, favouring CNG44). Some manufacturers claim higher efficiency with their CNG-powered models, while studies using static engines with larger cylinder volumes and turbocharger-equipped engines have reported higher CNG efficiency21).
3.2. Performance Comparison
Figure 4 and Figure 5 present the dynamometer test results under both ACOFF and ACON scenarios. During ACOFF, torque and power decreased by approximately 14% and 24%, respectively, when operating on CNG compared to petrol. Under ACON, the reductions were more pronounced due to the additional power required, reaching up to 19% for torque and 33% for power, as also presented in Table 8. The power gap widened progressively with increasing engine speed for both ACOFF and ACON, with the effect slightly larger in the ACON condition, despite the CNG torque remaining relatively stable across both modes. These findings are consistent with results reported in prior studies. Yontar and Doğu45) documented decreases of 12.7% in brake torque and 12.4% in brake power when substituting petrol with CNG. Similarly, Aljamali39) observed reductions as high as 26% and 25% for brake torque and brake power, respectively, while Kalam et al.46) reported power losses within the range of 15-20%.
This let-off is primarily attributed to the lower energy density of CNG23), which results in reduced heat release and consequently lower in-cylinder pressure46), and decreased brake output. In addition, the gaseous state of CNG displaces a portion of the intake air volume, reducing volumetric efficiency47) and the mass of inducted charge. Unlike petrol, CNG does not undergo vaporisation cooling during mixing48), which further diminishes charge density and combustion efficiency. The inherently slower flame propagation speed of CNG also prolongs the combustion duration, leading to additional efficiency losses compared to petrol.
Several options are available to address these issues, including combining hydrogen with CNG and adjusting ignition timing. The Brown gas coupling can increase the higher heating value (HHV) of the gas and improve lean combustion stability24,49), while advancing the spark timing by a few degrees after top dead centre (TDC) can help counteract the extended combustion duration to achieve maximum torque50). Flame propagation limitations can also be mitigated by inducing turbulence inside the combustion chamber via direct injection (DI-CNG), which improves the rate of heat release, air-fuel pressure, and in-cylinder pressure, although performance remains suboptimal compared to petrol51,52).
Interestingly, both Figure 4 and Figure 5 reveal sudden spikes in torque and power at 5,600 rpm under ACOFF and 5,400 rpm under ACON when operating on CNG. This phenomenon was triggered by the automatic fuel switching system, which detected the substantial power loss and reverted from CNG back to petrol to maintain engine stability.


Table 8: Comparison of wheel torque and power between CNG and petrol under different AC operating conditions
| Air Conditioner (AC) Status | Fuel Type | Maximum wheel torque | Maximum wheel power | ||||
|---|---|---|---|---|---|---|---|
| Result (Nm) | Reduction (%) | Engine speed (rpm) | Result (kW) | Reduction (%) | Engine speed (rpm) | ||
| AC On (ACON) | Petrol | 93.56 | 18.84 | 5,200 | 58.15 | 33.31 | 6,300 |
| CNG | 75.94 | 4,700 | 38.78 | 5,200 | |||
| AC Off (ACOFF) | Petrol | 103.06 | 14.48 | 4,400 | 58.91 | 24.05 | 5,900 |
| CNG | 88.14 | 3,600 | 44.74 | 4,900 | |||
The dynamometer results in Table 8 are consistent with the road test findings in Table 7. The observed reduction in torque and power during dynamometer testing explains the greater throttle input required by the vehicle under real driving conditions, leading to reduced distance-to-fuel ratios despite CNG’s higher theoretical CV and lower volumetric efficiency. This effect was particularly evident on 1st Route, which involved rougher terrain and higher torque demand, similar to the larger performance losses measured under ACON conditions. Nevertheless, the road test results demonstrated that CNG remains economically competitive, as its lower cost per unit of energy offsets the efficiency penalty. Taken together, these results indicate that unless the engine is specifically optimised with higher compression ratios or enhanced intake strategies, petrol-fuelled operation will continue to provide more advantageous volumetric fuel economy, whereas CNG offers significant cost advantages for practical operation.
3.3. Pollutant Concentration of Exhaust Gas
Figure 6 and Figure 7 present the average concentrations of CO and CO₂, respectively. When operating on petrol, the vehicle emitted substantially higher concentrations of both pollutants compared to CNG, with CO being approximately 5 times greater and CO₂ about 35% higher. These differences are consistent with the fundamental variation in the hydrogen-to-carbon (H/C) ratio between the fuels. Petrol, predominantly composed of octane (C₈H₁₈), has an H/C ratio of about 2.25:1, whereas the main constituents of CNG, methane (CH₄) and ethane (C₂H₆), possess higher H/C ratios of 4:1 and 3:1, respectively53). A lower H/C ratio typically leads to higher carbon-based pollutant concentrations, which explains the elevated CO and CO₂ levels observed during petrol operation54).
These findings are also corroborated by Arkawazi55) and Hasan et al.56), who reported similar CO₂ concentrations for near-stoichiometric petrol operation in engines of comparable capacity and fuel specification during idle. In addition to fuel chemistry, combustion and after-treatment characteristics also play important roles. CNG’s gaseous nature promotes more homogeneous air–fuel mixing, leading to more complete oxidation and lower CO formation57). Catalytic converter performance is further influenced by the air–fuel ratio, while the aromatic hydrocarbons and additives present in petrol tend to promote incomplete combustion and thus increase CO concentration58,59). Together, these effects reinforce the advantage of CNG in reducing carbon-based exhaust pollutants.
Furthermore, the relatively high CO₂ concentrations measured for petrol can be explained by the measurements being conducted at the tailpipe downstream of the TWC. The TWC facilitates oxidation reactions, particularly the conversion of CO to CO₂, resulting in higher CO₂ levels compared to raw exhaust. In addition, the Indonesian commercial RON 90 petrol used in this study contains a relatively high aromatic content (42.8%) and benzene (3.2%)27), which further increases theoretical CO₂ formation during stoichiometric combustion60). These values are consistent with previously reported tailpipe CO₂ concentrations for similar engines under idle conditions55,61,62). Moreover, typical diagnostic ranges for stoichiometric SI engines at idle are approximately 14.5–16% CO₂63), consistent with the concentrations observed in this study.
Figure 8 depicts the average NOx concentrations. NOx concentration from CNG operation were approximately five times higher than those from petrol, yet the absolute levels remained within the low range typically reported for stoichiometric SI engines at idle and therefore do not indicate a critical emission concern. This trend aligns with previous findings for CNG-fuelled vehicles originally configured for petrol operation15,19,22), where moderate NOx increases at idle and more pronounced rises under load have been observed.
The elevated NOx during CNG operation is primarily driven by higher in-cylinder temperatures, supported by CNG’s higher auto-ignition temperature and increased oxygen availability, which promote thermal NOx formation through the extended Zeldovich mechanism64). In addition, the more complete and stable combustion associated with gaseous fuel improves oxidation but can raise peak temperatures, further stimulating NOx generation65). Mitigation strategies such as exhaust gas recirculation (EGR) or moderating the rate of heat release have been proposed to suppress peak temperatures and oxygen concentration, thereby reducing thermal NOx formation66).


4. Conclusion
This study evaluated the performance, emissions, and economic viability of CNG as an alternative to petrol in a bi-fuel vehicle under real driving conditions. CNG operation resulted in a 19% reduction in wheel torque and a 33% reduction in wheel power when the AC load was active, reflecting the combined effects of lower volumetric efficiency, slower flame propagation, and non-optimised combustion in retrofitted engines. Fuel economy decreased by 15 to 20%, yet the lower unit fuel price enabled operating cost savings of up to 48.1%. Idle emissions showed clear benefits for carbon-based pollutants, with CO and CO₂ decreasing by approximately 80% and 35%, respectively. Although NOx concentrations were around five times higher than those from petrol, the absolute values remained within the low range typically associated with stoichiometric spark ignition engines at idle and therefore do not indicate a critical concern. Overall, the findings show that CNG provides notable economic and environmental advantages, while the remaining performance and NOx penalties may be mitigated through higher compression ratios, refined spark timing, and improved fuel management strategies.
5. Recommendation
Further research should focus on optimising injection timing and LECU calibration to improve combustion efficiency in bi-fuel engines. Employing chassis dynamometer tests with standardised driving cycles, complemented by instantaneous on-road emission measurements, would provide a more representative evaluation of transient performance and emissions. Moreover, CO₂ estimation from OBD-II parameters, combined with predictive modelling techniques such as Response Surface Methodology (RSM), could improve the reliability of emission characterisation and support the development of comprehensive emissions maps for both petrol and CNG modes.
Acknowledgements
We would like to extend our gratitude to the National Research and Innovation Agency of the Republic of Indonesia, which funded and supported this research via the 2022 Program House of Renewable Energy.
Nomenclature
| Symbol | Description (Unit) |
|---|---|
| AFR AC ACOFF ACON CV Engdisp ECU FC FE FF FtF IAT IDR IMAP LPE MAF MAP MMair RPM RON SFC STFT Voleff | air fuel ratio (-) air conditioner air conditioner off condition air conditioner on condition calorific value (MJ/kg) engine displacement (L) Electronic Control Unit fuel consumption (L) fuel economy (km/L) total fuel flow (L/h) Full-to-full intake air temperature (K) Indonesian rupiah integrated manifold absolute pressure (kPa) litre petrol-equivalent mass air flow (g/s) manifold absolute pressure (kPa) the molecular mass of air (28.9647 g/mol), the ideal gas constant (8.314 J/mol.K) revolutions per minute (rpm) research octane number (-) specific fuel consumption short-term fuel trim volumetric efficiency (%) |
Greek symbols
| Symbol | Description (Unit) | |
|---|---|---|
| n | number of measurements | |
| ρ | density of fuel (kg/L for petrol and kg/m3 for CNG | |
| σ | standard deviation | |
Subscripts
| Symbol | Description (Unit) |
|---|---|
| air disp | air displacement |
| corr eff x, y | corrected efficiency number of atoms |
References
- A.T. Raheem, A.A. Rashid Aziz, S.A. Zulkifli, A.T. Rahem, W.B. Ayandotun, S.M. Elfakki, M. bin Baharom, E.Z. Zainal, P. Darul Ridzuan, and D. Ridzuan, “Combustion Characteristics of a Free Piston Engine Linear Generator using Various Fuel Injection Durations,” 2023.
- T. Sinigaglia, M. Eduardo Santos Martins, and J. Cezar Mairesse Siluk, “Technological evolution of internal combustion engine vehicle: a patent data analysis,” Appl. Energy, 306 118003 (2022). doi:10.1016/J.APENERGY.2021.118003.
- A. Habibie, M. Hisjam, W. Sutopo, and M. Nizam, “Sustainability evaluation of internal combustion engine motorcycle to electric motorcycle conversion,” Evergreen, 8 (2) 469–476 (2021). doi:10.5109/4480731.
- G. Kalghatgi, “Is it really the end of internal combustion engines and petroleum in transport?,” Appl. Energy, 225 965–974 (2018). doi:10.1016/J.APENERGY.2018.05.076.
- M.T. Kibria, M.A. Islam, B.B. Saha, T. Nakagawa, and S. Mizuno, “Assessment of environmental impact for air-conditioning systems in japan using hfc based refrigerants,” Evergreen, 6 (3) 246–253 (2019). doi:10.5109/2349301.
- A. Berisha, and L. Osmanaj, “Kosovo scenario for mitigation of greenhouse gas emissions from municipal waste management,” Evergreen, 8 (3) 509–516 (2021). doi:10.5109/4491636.
- I. Paryanto, T. Prakoso, B.H. Susanto, and M. Gozan, “The effect of outdoor temperature conditions and monoglyceride content on the precipitate formation of biodiesel-petrodiesel blended fuel (bxx),” Evergreen, 6 (1) 59–64 (2019). doi:10.5109/2321010.
- I. Yamin, B. Sugiarto, and S. Abikusna, “Indonesia recent research of bioethanol for internal combustion engine,” Evergreen, 8 (4) 850–854 (2021). doi:10.5109/4742131.
- S. Abikusna, B. Sugiarto, and I. Yamin, “Utilization analysis of bioethanol (low grade) and oxygenated additive to cov and gas emissions on si engine,” Evergreen, 7 (1) 43–50 (2020). doi:10.5109/2740940.
- S.A. Park, and H. Tak, “The environmental effects of the cng bus program on metropolitan air quality in korea,” Annals of Regional Science, 49 (1) 261–287 (2012). doi:10.1007/S00168-011-0439-3/METRICS.
- E. Thalassinos, M. Kadłubek, L.M. Thong, T. Van Hiep, and E. Ugurlu, “Managerial issues regarding the role of natural gas in the transition of energy and the impact of natural gas consumption on the gdp of selected countries,” Resources 2022, Vol. 11, Page 42, 11 (5) 42 (2022). doi:10.3390/RESOURCES11050042.
- Y. Liu, J.K. Yeom, and S.S. Chung, “An experimental study on the effects of impingement-walls on the spray and combustion characteristics of sidi cng,” Journal of Mechanical Science and Technology, 26 (8) 2239–2246 (2012). doi:10.1007/S12206-012-0604-3/METRICS.
- K. Kato, K. Igarashi, M. Masuda, K. Otsubo, A. Yasuda, K. Takeda, and T. Sato, “Development of engine for natural gas vehicle,” SAE Technical Papers, (1999). doi:10.4271/1999-01-0574.
- H. Engerer, and M. Horn, “Natural gas vehicles: an option for europe,” Energy Policy, 38 (2) 1017–1029 (2010). doi:10.1016/J.ENPOL.2009.10.054.
- Z. Lv, L. Wu, C. Ma, L. Sun, J. Peng, L. Yang, N. Wei, Q. Zhang, and H. Mao, “Comparison of co2, nox, and vocs emissions between cng and e10 fueled light-duty vehicles,” Science of The Total Environment, 858 159966 (2023). doi:10.1016/J.SCITOTENV.2022.159966.
- Presidential Regulation of the Republic of Indonesia, “National Energy Policy,” Jakarta, 2006.
- Ministry of Energy and Mineral Resources, “Selling Price of Gas Fuel Used for Transportation,” 2022.
- Regulation of the Governor of DKI Jakarta No. 31/2008, “Motor Vehicle Exhaust Gas Emission Threshold,” 2008. http://advokat-rgsmitra.com.
- O. Ghaffarpasand, M.R. Talaie, H. Ahmadikia, A. TalaieKhozani, M.D. Shalamzari, and S. Majidi, “On-road performance and emission characteristics of cng-gasoline bi-fuel taxis/private cars at the roadside environment,” Atmos. Pollut. Res., 11 (10) 1743–1753 (2020). doi:10.1016/J.APR.2020.07.017.
- J. Fu, J. Shu, F. Zhou, J. Liu, Z. Xu, and D. Zeng, “Experimental investigation on the effects of compression ratio on in-cylinder combustion process and performance improvement of liquefied methane engine,” Appl. Therm. Eng., 113 1208–1218 (2017). doi:10.1016/J.APPLTHERMALENG.2016.11.048.
- A.R. Tabar, A.A. Hamidi, and H. Ghadamian, “Experimental investigation of cng and gasoline fuels combination on a 1.7 l bi-fuel turbocharged engine,” International Journal of Energy and Environmental Engineering, 8 (1) 37–45 (2017). doi:10.1007/S40095-016-0223-3/TABLES/4.
- M.I. Jahirul, H.H. Masjuki, R. Saidur, M.A. Kalam, M.H. Jayed, and M.A. Wazed, “Comparative engine performance and emission analysis of cng and gasoline in a retrofitted car engine,” Appl. Therm. Eng., 30 (14–15) 2219–2226 (2010). doi:10.1016/J.APPLTHERMALENG.2010.05.037.
- K. Nguyen Duc, V. Nguyen Duy, L. Hoang-Dinh, T. Nguyen Viet, and T. Le-Anh, “Performance and emission characteristics of a port fuel injected, spark ignition engine fueled by compressed natural gas,” Sustainable Energy Technologies and Assessments, 31 383–389 (2019). doi:10.1016/j.seta.2018.12.018.
- M. Melaika, G. Herbillon, and P. Dahlander, “Spark ignition engine performance, standard emissions and particulates using gdi, pfi-cng and di-cng systems,” Fuel, 293 (2021). doi:10.1016/j.fuel.2021.120454.
- K. Lejda, A. Jaworski, D. Savostin-Kosiak, M. Mądziel, K. Balawender, and A. Ustrzycki, “Assessment of petrol and natural gas vehicle carbon oxides emissions in the laboratory and on-road tests,” Energies (Basel)., 14 (6) (2021). doi:10.3390/en14061631.
- Y. Muharam, M. Mahendra, D. Gayatri, and S. Kartohardjono, “Simulation of ignition delay time of compressed natural gas combustion,” International Journal of Automotive and Mechanical Engineering, 12 (1) 3124–3140 (2015). doi:10.15282/ijame.12.2015.25.0260.
- Y.L. Calvin, P.A.T. Hariyanto, A.I. Usman, M. Masuku, C.S. Wibowo, Maymuchar, R. Anggarani, N.A. Fathurrahman, and B. Sugiarto, “Volatility and physicochemical properties of gasoline-ethanol blends with gasoline ron-based 88, 90, and 92,” Fuel, 307 121850 (2022). doi:10.1016/J.FUEL.2021.121850.
- P. Astra Daihatsu Motor, “Luxio technical instructions,” (2009). https://daihatsu.co.id/product/luxio/ (accessed September 22, 2025).
- P. Anttila, T. Nummelin, K. Väätäinen, J. Laitila, J. Ala-Ilomäki, and A. Kilpeläinen, “Effect of vehicle properties and driving environment on fuel consumption and co2 emissions of timber trucking based on data from fleet management system,” Transp. Res. Interdiscip. Perspect., 15 100671 (2022). doi:10.1016/J.TRIP.2022.100671.
- Light Duty Vehicle Performance Committee, “Fuel economy measurement road test procedure,” SAE Mobilus, (2008). doi:10.4271/J1082_200802.
- Presidential Regulation of the Republic of Indonesia, “Amendments to Presidential Regulation Number 40 of 2016 concerning Determination of Natural Gas Prices,” Jakarta, 2020.
- J.E. Meseguer, C.T. Calafate, J.C. Cano, and P. Manzoni, “Assessing the impact of driving behavior on instantaneous fuel consumption,” 2015 12th Annual IEEE Consumer Communications and Networking Conference, CCNC 2015, 443–448 (2015). doi:10.1109/CCNC.2015.7158016.
- D. Rimpas, A. Papadakis, and M. Samarakou, “OBD-ii sensor diagnostics for monitoring vehicle operation and consumption,” Energy Reports, 6 55–63 (2020). doi:10.1016/J.EGYR.2019.10.018.
- H.E. Doǧan, O.A. Kutlar, M. Javadzadehkalkhoran, and A. Demirci, “Investigation of burn duration and no emission in lean mixture with cng and gasoline,” Energies 2019, Vol. 12, Page 4432, 12 (23) 4432 (2019). doi:10.3390/EN12234432.
- Mustang Dynamometer, “MD-awd-150 series manual,” MD-AWD Dynamometer, (2016). https://www.mustangdyne.com/products-services/chassis-dynamometers/awd-dynamometers/md-awd-150/ (accessed September 22, 2025).
- V.E.E.S.D.S. Committee, “E/e diagnostic test modes,” (2017). doi:10.4271/J1979_201702.
- SNI 09-7118.1-2005, “Mobile Source Exhaust Emissions Part 1: Testing Method for Category M, N, and O Motor Vehicles with Spark Ignition Drives at Idle Conditions,” Jakarta, 2005.
- “Regulation - 2017/1154 - en - eur-lex,” (n.d.). https://eur-lex.europa.eu/legal-content/EN/TXT/?qid=1587690691481&uri=CELEX:32017R1154 (accessed December 3, 2025).
- S. Aljamali, W.M.F.W. Mahmood, S. Abdullah, and Y. Ali, “Comparison of performance and emission of a gasoline engine fuelled by gasoline and cng under various throttle positions,” Journal of Applied Sciences, 14 (4) 386–390 (2014). doi:10.3923/JAS.2014.386.390.
- Y. Putrasari, A. Praptijanto, A. Nur, B. Wahono, and W.B. Santoso, “Evaluation of performance and emission of SI engine fuelled with CNG at low and high load condition,” in: Energy Procedia, Elsevier Ltd, 2015: pp. 147–156. doi:10.1016/j.egypro.2015.03.243.
- M. Ameri, F. Kiaahmadi, and M. Khanaki, “Comparative analysis of the performance of a dual-fuel internal combustion engine for cng and gasoline fuels,” Journal of Power Technologies, 92 (4) 214–226 (2012).
- Z. Han, Z. Wu, Y. Huang, Y. Shi, and W. Liu, “Impact of natural gas fuel characteristics on the design and combustion performance of a new light-duty cng engine,” International Journal of Automotive Technology, 22 (6) 1619–1631 (2021). doi:10.1007/S12239-021-0140-1/METRICS.
- M.H. Hassan, M.A. Kalam, T.M.I. Mahlia, I. Aris, M.K. Nizam, S. Abdullah, and Y. Ali, “Experimental test of a new compressed natural gas direct injection engine,” Energy and Fuels, 23 (10) 4981–4987 (2009). doi:10.1021/EF8011382.
- F. Afreza, R. Fatti, T. HP, and J. Liauw, “Environment and cost analysis of using compressed natural gas as alternative fuels in jakarta,” Advances in Transportation and Logistics Research, 2 (0) 261–266 (2019). doi:10.25292/ATLR.V2I0.171.
- A.A. Yontar, and Y. Doğu, “Experimental and numerical investigation of effects of cng and gasoline fuels on engine performance and emissions in a dual sequential spark ignition engine,” Energy Sources, Part A: Recovery, Utilization, and Environmental Effects, 40 (18) 2176–2192 (2018). doi:10.1080/15567036.2018.1495783.
- M. A. Kalam, “Power boosting of a modified natural gas engine,” International Journal of the Physical Sciences, 6 (28) (2011). doi:10.5897/ijps11.1021.
- D. Ramasamy, Z.A. Zainal, K. Kadirgama, and H. Walker-Gitano Briggs, “Effect of dissimilar valve lift on a bi-fuel cng engine operation,” Energy, 112 509–519 (2016). doi:10.1016/J.ENERGY.2016.06.116.
- M.M. Tahir, M.S. Ali, M.A. Salim, R.A. Bakar, A.M. Fudhail, M.Z. Hassan, and M.S. Abdul Muhaimin, “Performance analysis of a spark ignition engine using compressed natural gas (CNG) as fuel,” in: Energy Procedia, Elsevier Ltd, 2015: pp. 355–362. doi:10.1016/j.egypro.2015.03.266.
- J. Lee, C. Park, J. Bae, Y. Kim, S. Lee, and C. Kim, “Comparison between gasoline direct injection and compressed natural gas port fuel injection under maximum load condition,” Energy, 197 (2020). doi:10.1016/j.energy.2020.117173.
- E.R. Jayaratne, Z.D. Ristovski, N. Meyer, and L. Morawska, “Particle and gaseous emissions from compressed natural gas and ultralow sulphur diesel-fuelled buses at four steady engine loads,” Science of the Total Environment, 407 (8) 2845–2852 (2009). doi:10.1016/j.scitotenv.2009.01.001.
- P. Bielaczyc, J. Woodburn, and A. Szczotka, “An assessment of regulated emissions and co2 emissions from a european light-duty cng-fueled vehicle in the context of euro 6 emissions regulations,” Appl. Energy, 117 134–141 (2014). doi:10.1016/j.apenergy.2013.12.003.
- O. Bordelanne, M. Montero, F. Bravin, A. Prieur-Vernat, O. Oliveti-Selmi, H. Pierre, M. Papadopoulo, and T. Muller, “Biomethane cng hybrid: a reduction by more than 80% of the greenhouse gases emissions compared to gasoline,” J. Nat. Gas Sci. Eng., 3 (5) 617–624 (2011). doi:10.1016/j.jngse.2011.07.007.
- D.D. Nguyen, H. Moghaddam, V. Pirouzfar, A. Fayyazbakhsh, and C.H. Su, “Improving the gasoline properties by blending butanol-al2o3 to optimize the engine performance and reduce air pollution,” Energy, 218 (2021). doi:10.1016/j.energy.2020.119442.
- Y. Wang, Z. Xing, H. Xu, and K. Du, “Emission factors of air pollutants from cng-gasoline bi-fuel vehicles: part i. black carbon,” Science of The Total Environment, 572 1161–1165 (2016). doi:10.1016/J.SCITOTENV.2016.08.027.
- S.A.F. Al-Arkawazi, “Analyzing and predicting the relation between air–fuel ratio (afr), lambda (λ) and the exhaust emissions percentages and values of gasoline-fueled vehicles using versatile and portable emissions measurement system tool,” SN Appl. Sci., 1 (11) (2019). doi:10.1007/s42452-019-1392-5.
- S. Hasan, N. Rahman, P.K. Paul, M. Halder, M.A. Alam, M.A. Raquib, P.A.K. Islam, M. Hasan, S. Rahman, N. Paul, P.K. Halder, M. Alam, M.A. Islam, and P.A. Khan, “Analysis of Exhaust Emission of Vehicles in Dhaka City of Bangladesh,” 2013.
- M.U. Aslam, H.H. Masjuki, M.A. Kalam, H. Abdesselam, T.M.I. Mahlia, and M.A. Amalina, “An experimental investigation of cng as an alternative fuel for a retrofitted gasoline vehicle,” Fuel, 85 (5–6) 717–724 (2006). doi:10.1016/j.fuel.2005.09.004.
- M.I. Khan, T. Yasmin, and A. Shakoor, “Technical overview of compressed natural gas (cng) as a transportation fuel,” Renewable and Sustainable Energy Reviews, 51 785–797 (2015). doi:10.1016/j.rser.2015.06.053.
- A. Jaworski, H. Kuszewski, K. Balawender, P. Woś, K. Lew, and M. Jaremcio, “Assessment of ch4 emissions in a compressed natural gas-adapted engine in the context of changes in the equivalence ratio,” Energies (Basel)., 17 (9) (2024). doi:10.3390/en17092095.
- S.A. Flamarz Al-Arkawazi, “The gasoline fuel quality impact on fuel consumption, air-fuel ratio (afr), lambda (λ) and exhaust emissions of gasoline-fueled vehicles,” Cogent Eng., 6 (1) (2019). doi:10.1080/23311916.2019.1616866.
- B.A. Sudikna, P. Saksono, M. Ferdnian, and S.N.S. Sidabutar, “The effect of fuel type on exhaust emissions of the otto engine injection system,” JOURNAL OF APPLIED MECHANICAL ENGINEERING AND RENEWABLE ENERGY (JAMERE), 5 (1) 43–50 (2025). https://journal.isas.or.id/index.php/JAMERE.
- S. Ahmed Flamarz Al-Arkawazi, “Studying the relation between the engine size and manufacturing year of gasoline-fueled vehicles and exhaust emission percentages and concentrations,” J. Mater. Environ. Sci, 2020 (2) 196–219 (2020). http://www.jmaterenvironsci.com.
- “Car exhaust five gas analyzer diagnostic chart | walker exhaust systems,” (n.d.). https://www.walkerexhaust.com/support/tech-tips/five-gas-diagnostic-chart.html (accessed November 29, 2025).
- M. Usman, N. Hayat, and M.M.A. Bhutta, “SI engine fueled with gasoline, cng and cng-hho blend: comparative evaluation of performance, emission and lubrication oil deterioration,” Journal of Thermal Science, 30 (4) 1199–1211 (2021). doi:10.1007/s11630-020-1268-4.
- F.R. Saputro, A.M. Ithnin, D.A. Sugeng, W.N.I. Wan Mahdi, W.J. Yahya, W. Prabowo, T. Anggoro, and E. Rosyadi, “Effects of oxyhydrogen enrichment on diesel engine performance and emissions using b35 and its water-in-biodiesel emulsion,” Int. J. Hydrogen Energy, 142 109–121 (2025). doi:10.1016/j.ijhydene.2025.05.359.
- F. Ma, Y. Wang, H. Liu, Y. Li, J. Wang, and S. Zhao, “Experimental study on thermal efficiency and emission characteristics of a lean burn hydrogen enriched natural gas engine,” Int. J. Hydrogen Energy, 32 (18) 5067–5075 (2007). doi:10.1016/j.ijhydene.2007.07.048.