
Abstract
Economic development in Indonesia is currently unequal and more concentrated in western regions such as Java and Sumatra. Nusa Tenggara Timur (NTT) has high economic potency from fishery, tourism, mining, and livestock products. High inflation and price disparity become ecomomy problem which dominated by volatile food inflation and administered prices. To support equitable development by enhancing economic interaction between regions through inter-island trade, the government initiated the Tol Laut program in the underdeveloped, remote, outermost, and border areas (3TP) to reduce price disparities through subsidizing sea transportation services. This research aims to analyse the utilization of ferry ro-ro as alternative for Tol Laut’s cargo carrier by analyzing logistic processes, logistic cost, supply-demand, and price disparity. The analysis result shows that Jangkar-Kupang ferry route which connected East Java and NTT can be utilize as new Tol Laut alternative route which has advantages such as high frequency, ability to bridge inter-island door to door logistic distribution, and cumulatively can increase market size of Tol Laut’s cargo as foundation to control price disparity and promote return cargo as sustainable inter island trade. Government agencies need to build collaboration to control the distribution of Tol laut’s cargo to end user.
Keywords: Ferry Ro-Ro, Logistic, Ship, Shipping, Tol Laut
Outline
1. Introduction
Indonesia has territories that spread from the west to east, each region has different economic potential. The diversity of regional potentials which are scattered are then grouped into economic corridors1). Economic development in Indonesia is currently unequal and more concentrated in western regions such as Java and Sumatra2,3). To support equitable development, it is necessary to have economic interaction between regions, one of which is the inter-island trade4). Trade connectivity in eastern Indonesia is still highly dependent on Java, the largest volume and value of inter-island trade is conducted with East Java province5). The archipelago which is separated by sea and strait makes sea transportation the main supporter of connectivity between the economic center region in Java and other regions in eastern Indonesia, which is highly dependent on break bulk general cargo vessels6,7). Low port efficiency and unsupporting infrastructure are transportation problems in eastern Indonesia, resulting in higher logistics costs8,9). The high price disparity, especially in eastern Indonesia can be caused by high logistics costs10,11). In 2015 the President of the Republic of Indonesia initiated the Tol Laut program to fill the logistics needs of the people in the underdeveloped, remote, utmost, and border areas (3TP) in order to reduce price disparities through subsidizing sea transportation services12).
East Nusa Tenggara is an archipelago province which has high economy potency from fishery, tourism, mining, and livestock products13). Even so, there are still economic problems in this region, namely high inflation rates14). Inflation in East Nusa Tenggara is dominated by volatile food inflation (foodstuffs group) and administered prices (transportation, communication, and financial services group)15). Inadequate transportation infrastructure complicates the connectivity of the NTT region with centers of economic growth outside its territory. The Indonesian government carried out this Tol Laut program with the main objective of implementing a more effective and efficient delivery function from western Indonesia to the east to reduce economic inequalities and prices16). In the perspective of port operations, the establishment of Tol Laut is expected to have multiple effects for seaport competitiveness by increasing seaport performance, capacity, hinterland proximity, service variations, and trade volume17).
Tol Laut as subsidize sea transportation service dominantly uses container ships and general cargo ships with several types of subsidies, namely ship operational cost subsidies, container tariff subsidies and cargo hold usage subsidies. Ship operators consist of state-owned enterprises and private shipping companies which are determined by mandatory and through an auction process. Each route is served by 1 ship, out of 33 routes 22 of them use ship operational cost subsidy with an estimated operating cost of between 17-21 billion rupiah per ship every year18). Another Tol Laut subsidy is in the form of container tariffs, the government pays a certain percentage of freight rates for containers transported by existing private vessels that already serving routes in the 3TP area. For general cargo, cargo hold subsidies are used, namely the government pays for the use of cargo hold at a certain volume for Tol Laut cargo. Tol Laut in other eastern Indonesian regions in Papua has begun to use ro-ro ferries but the type of cargo is still dominant in the form of general cargo which is hand-carry of passengers with a very small quantity.
Ferry ro-ro contribute to shortening of shipment route in relation to the alternative road transport and, hence, to reduction of total external costs generated in transport, which is the main aim of sustainable development19). Ferry ro-ro also has the flexibility to transport types of ro-ro container loads so that it supports the door-to-door distribution concept20,21). Tol Laut as a program that relies on the ability of government subsidies requires effective and efficient implementation. Started with 6 routes, now it has served 33 routes. The demand for new routes from local government that continues to increase is a problem because the number and capacity of ships are limited, so that the effective sailing day for each route is getting longer, approaching one month per round trip route, so that ports on one route are sometimes only able to be served once a month22).
This research aims to create a new concept for the distribution of Tol Laut containers via Ro-Ro (Roll on – Roll off) ferry ship with a point-to-point operating pattern which connecting East Java and Kupang, as an alternative to the existing concept by considering the competitive advantages of ro-ro ferries.
As literature review, related topics has been identified by several previous research. These two research 13) and 15) explained the economy problem in NTT and its relation to the transport sector. There are still few international publications that discuss Tol Laut specifically. Even so, research 16-17) has obtained an overview of the urgency of Tol Laut as sea transportation support to bridge trade between regions. In this study it was also identified that Tol Laut has another impact on improving port performance, but regulatory coordination between agencies is still a boundary. Research 19-20) has explained well the advantages of ro-ro ferries in the perspective of short sea shipping to connect regions domestically and between countries.
Research 21) focuses on discussing safety aspects by identifying potential types of ferry accidents in Indonesia. Previous research has become a reference for authors in determining research purpose as well as identifying research gaps. Several research gaps have been identified from this research. The actual impact of the transportation sector in units of monetary value on the price of goods disparities between the economic centers in east Java and the NTT region has not yet been found. Research on ro-ro ferries mostly focuses on short sea shipping while Tol Laut projected as long-distance ferry crossing trajectory.
Research on the safety aspect provides insight to the authors because Tol Laut transports various types of cargo so that safety aspects need to be considered, especially regarding the risk potential for fire and capsized. Research gaps that have been identified from previous research substance and recommendations for further research will then be discussed in this study in order to give scientific contributions.
Based on a comparison with previous research, a research gap was identified in the form of an implication gap where in the Tol Laut concept, liner carriers have never used Ro-Ro type ships. The research gap this study aims to address is the absence of a Tol Laut concept utilizing Ro-Ro vessels, as current operations predominantly rely on container ships. The exploration of a Tol Laut model employing Ro-Ro ships will thus constitute a novel contribution to existing research.
2. Research Method
This study uses a mixed method that combines qualitative and quantitative methods with the support of primary data and secondary data with research framework can be seen in Figure 1. The qualitative method used is in the form of interpretation of data from focus group discussions and field surveys23). The quantitative method used is the empirical method for analysis of supply-demand, market, logistics costs and price disparities. Supply-demand analysis uses a statistical approach based on the consumption index of primary and important goods relative to population. This value is then compared with local production for the same commodity. Comparison results that have a positive value indicate a surplus condition, whereas if the value is negative it indicates a deficit so these needs must be met from other regions through trade. Market analysis uses a hierarchy identification method by looking at the complexity of a trading company's supporting business units. Primary data respondents are representative personnel from related stakeholders who have jobdesk and authority in accordance with the research topic. Primary data was obtained through FGDs and direct surveys. The secondary data are port performance data24), regional characteristics25), and logistic cost that collected from related agencies. The research was carried out in Kupang, East Nusa Tenggara in 2022-2024 with the hinterland of the island of Timor. FGD as a follow-up to the results of the initial analysis of survey data was carried out together with representative stakeholders from the Directorate General of Sea Transportation, Directorate General of Land Transportation, Ship operator association and local government representatives. This FGD mapped the actual conditions of Tol Laut implementation and identified opportunities for integrating the concept of using Ro-Ro ships as carriers.
The analysis phase then continued with creating an initial distribution model, which is then compared with the actual conditions of the logistics supply chain, especially the cargo distribution process from East Java to Kupang hinterland using the flow logistics analysis method. The distribution model commences with the identification of potential logistic locations26), which are determined by distributors utilizing information technology27). Within the tol laut program, the SITOLAUT application is applicable for this purpose28,29). Concurrently, a supply and demand analysis was conducted using comparative methods, considering the consumption index, local production, and population distribution. The initial stage involves forecasting for primary and imported goods, categorized as tol laut cargo, using the moving average method to obtain consumption and demand index data based on population. Similarly, local production data for primary and essential goods are acquired through an analogous approach30,31). The subsequent step involves comparing these supply and demand Figures to ascertain the average stock levels32).
This analysis aims to identify the fulfilment of demand for the needs of the people in NTT which are supplied with various modes of transportation from other regions, as well as identify the potential for local production as self-consumption and can be marketed to other regions. Market aspect analysis uses market penetration and price disparity comparative methods. This analysis commences with the segmentation of locations33) and a descriptive mapping of business centers, trade networks, and domestic local enterprises34). Additionally, local community characteristics35) are assessed through interview methods to determine price disparities between economic centers and rural areas36,37). The results of the previous series of analysis stages are then used to evaluate the concept of the distribution model compared to the actual logistics flow conditions. The feasibility of the distribution model is evaluated from 2 aspects, namely point to point distribution time efficiency and cost efficiency.
3. Analysis And Discussion
3.1. Supply and Demand Analysis
Identifying potential demand and supply in research area based on time series statistical data (2017-2021) for population, production and consumption of specific good types that consist of rice, soya bean, cayenne pepper, red chilli, shallot, onion, palm oil, sugar, flour, beef, broiler, egg, and corn. The types of ingredients analyzed are limited to food ingredients in accordance with the list of types in the Tol Laut regulations. Time series data then forecasted for next 5 years period. Estimated population based on forecasting is 1.926.250 then compared with consumption index value to identify potential demand, in parallel there is also forecasting to identify estimated production capacity from hinterland areas. Analysis result can be seen in following Table 1 and Figure 2.
Cumulatively the production capacity has exceeded the demand for consumption, most of production surplus contributed by corn production. Based on data in the table above, significant deficit is from the commodity that not been produced in NTT like palm oil, sugar, and flour. There are also commodities that been produced in NTT, but the quantity is not enough to fulfil the cumulative demand of peoples like rice, soya bean, and egg. Vice versa, some commodities like red chilli, cayenne, shallot, beef, broiler, onion, and corn provide surplus and become potency for traded outside the area. Staple food consumption characteristic of peoples in NTT are slightly different from another area, most of peoples here prefer eating corn than rice. Even that, there have been a shift in consumption pattern from corn to rice consumption38). Rice demand in this area mostly supplied from East Java and South Celebes by ship. By filtering data from Table 1 been identified that average rice supply from outside Kupang is 11.794 ton, cumulatively with total production is still less than half of people’s demand but it can be covered by corn surplus production. Based on same data been identified that Kupang port also become transhipment port, it shows that rice and egg also transported from Kupang to another area in NTT.

Table 1: Supply and demand of commodities in NTT
| Commodities | Consumption index value (kg/year) | Demand (ton) | Production (ton) | Stock (ton) |
|---|---|---|---|---|
| Rice | 112.88 | 217,435 | 79,974 | -137,461 |
| Soya bean | 2.61 | 5,028 | 336 | -4,692 |
| Red chilli | 0.272 | 524 | 2,313 | 1,789 |
| Cayenne | 0.706 | 1,36 | 4,216 | 2,856 |
| Shallot | 1.717 | 3,307 | 4,74 | 1,432 |
| Palm oil | 8.916 | 17,174 | - | -17,174 |
| Sugar | 6.784 | 13,068 | - | -13,068 |
| Flour | 1.251 | 2,41 | - | -2,41 |
| Beef | 0.4068 | 784 | 8,769 | 7,985 |
| Broiler | 1.481 | 2,853 | 4,757 | 1,905 |
| Egg | 5.58 | 10,748 | 1,184 | -9,565 |
| Onion | 1.717 | 3,307 | 6,096 | 2,788 |
| Corn | 91.25 | 175,77 | 369,902 | 194,132 |
Fig, 2: Supply-demand based on commodities
The main concern is from commodities without substitute product and depend on supply from another area like palm oil, sugar, flour, and egg. Unavailable of flour in local marketplace can be replaced by local production like sago flour and corn-starch. In general, logistic supply in Kupang and its hinterland mostly depend on sea transportation. The availability of commodities in the market will have an impact on society. If the number of goods available matches or exceeds the consumption index, it means that people in an area will easily get and buy it at low prices. Conversely, if the available goods are lacking, it will lead to scarcity of goods and high price disparities in an area. NTT’s poverty percentage is high at 20,05% as impact of inflation where transportation, services, and food price are main contributor.
3.2. Logistic Process, Cost and Price Disparity
Inter-island trade as part of logistic supply chain requires long distribution process started from producer area to end customers, and supported by several activities like shipping, packaging, cargo handling, storage, administration, and land transportation. Cargo distribution process and cost from East Java to Kupang by sea transportation shown in Figure 3.
Cargo distribution from East Java to Kupang is a complex process with involvement of many stakeholders, entrepreneur in this process mostly become cargo owner. In form of company, each entrepreneur has different business network which implemented in cargo distribution concept. Based on the survey, several company types based on supporting units have been identified in Kupang in Table 2.
The table shows that each company have different variety of supporting business unit, there are companies with complete supporting unit and there also companies with minimum supporting unit. Company type A and B mostly located in Kupang City and make it easier to coordinate with their supporting unit, in advancement these types also have retail network in hinterland area. Companies type C, D, and E have spread in the hinterland area outside Kupang City. Quantity of type A and B companies is small, but with complexity of supporting business unit it can be stated that these companies are in top hierarchy of logistic sector, in contrary there are more of type C, D, and E companies in lower hierchy.
In trade business within Timor Island there is interaction between different type of companies, type A and B mostly become dominant supplier for type C, D, and E companies in same network. Type C companies can also transformed become independent supplier but still connected with type A or B companies who provide freight forwarder and warehouse services. Trade relationship and transportation is an important part in inter island trade. Companies in Kupang need to establish trade connection with another companies in Surabaya, mutual connection in another area will provide access to buy potential cargo in high quantity and lower price. Mutual connection with freight forwarder service provider also needed for shipping cargo to Kupang. After completion of port activities and administration in Tenau Port, cargo then transported to freight forwarder warehouse in Kupang City for unstuffing and preparation for land transportation to specific drop point in hinterland areas as requested by consignee. In some case There is also direct delivery from Tenau port to warehouse area in hinterland outside Kupang City for type C company as distributor for D and E type companies.
Distribution flow shows that cargo been through chain process, each of the process are handled by different operators. As business, the operators will aim for financial profit. The more process involved means more cost, the retails then consider cumulative of fixed cost and variable cost to determine selling price to consumers. Transportation sector impact to logistic cost calculated by using logistic flow analysis, base scenario will follow Figure 2. Initial step is identifying origin producer area in East Java for rice farm, poultry, and factories. Next step is truck haulage cost calculation in 2 scenarios, the first one is direct delivery to Tanjung Perak Port and the second is transhipment in distributors warehouse in Surabaya. Result can be seen in Table 3.

Table 2: Business model
| Company Type | Availability of supporting business unit | ||||||
|---|---|---|---|---|---|---|---|
| Trade relationship | Freight forward | Storage unit | Land Transportation | Head store | Branch store | Retail | |
| A | √ | √ | √ | √ | √ | √ | √ |
| B | √ | √ | √ | √ | √ | ||
| C | √ | √ | √ | √ | |||
| D | √ | √ | |||||
| E | √ | ||||||
Table 3: Logistic cost from hinterland to port in East Java
| Commodities | Origin | Direct delivery to Tanjung Perak Port | Warehouse transhipment in Surabaya City | ||||||
|---|---|---|---|---|---|---|---|---|---|
| Avg distance (km) | Truck haulage (IDR/TEUs) | Stripping /stuffing (IDR/TEUs) | Stacking (IDR/TEUs/day) | Avg distance (km) | Truck haulage (IDR/TEUs) | Stripping /stuffing (IDR/TEUs) | Storage (IDR/TEUs/day) | ||
| Poultry | Blitar | 153 | 2,748,000 | 200,000 | 25,000 | 145 | 2,349,800 | 1,400,000 | 250,000 |
| Rice farm | Ngawi | 178 | 2,974,600 | 184 | 2,623,400 | ||||
| Palm oil factory | Surabaya | 20 | 810,000 | 20 | 810,000 | ||||
| Flour factory | Surabaya | 20 | 810,000 | 20 | 810,000 | ||||
| Sugar factory | Kediri | 135 | 2,608,000 | 126 | 2,522,000 | ||||
Warehouse transhipment in hinterland activity mostly become unavoidable because the main distributor may purchase from several producers if there is an order in high quantity and use the warehouse to consolidate the cargo. Comparation between cargo handling tariff in port and private sector warehouse shows that in same measurement unit, cumulative cargo handling activities outside port working area is twice as expensive, and there will be an additional truck haulage cost to transport the cargo from warehouse to port. These additional activities will increase variable cost in parallel with amount of time cargo in warehouse and port container stacking yard.
Sea freight is another primary service in logistic flow between East Java and Kupang by direct and indirect route. After badly disturbed by the Covid 19 pandemic in 2020, Kupang’s port performance report in 2021 started to show increasement of shipcall and cargo productivity from Surabaya. However, cargo imbalance still an existing problem in western-eastern Indonesian trading. Insufficient quantity of return cargo from eastern ports to western make it difficult for shipping lines, to cover ship operational cost then shipping lines set high freight rates. Most of consumer use freight forwarder as agency with port-to-port tariff range 13,000,000 IDR to nearly 20,000,000 IDR, excluded the logistic cost outside the port. Government intervention in Tol Laut’s logistic process is limited in container freight rate by subsidies more than 75% of normal freight rate. Logistic cost per TEUs container from origin area in East Java to Kupang can be seen in following Figure 4.
The comparison result shows that total cost of subsidize Tol Laut’s cargo are much cheaper more than half of normal freight rate. The result also same in kg (kilogram) as measurement unit. Cargo logistics goes through many distribution stages from the initial stage from the economic center area in Java, the same conditions also occur in Kupang from the port to the final consumer. Logistics activities starting at the Tenau port, distribution to expedition warehouses, distribution to consignee warehouses, to distribution via road transport to the hinterland area are carried out by different operators and

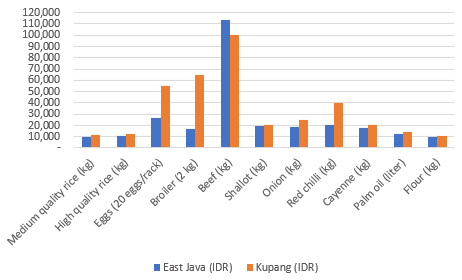
each operator will profit financially from the cargo handled. The length of the logistics supply chain and the costs arising from each of these additional activities have a major impact on increasing the selling price of goods at the final consumer level in the hinterland area. The cargo owner will consider the cumulative costs for transhipment and distribution activities to be an additional variable cost charged to the selling price of the commodity to the end consumers. Price disparity between East Java and Kupang can be seen in Figure 5.
High price disparity in NTT is one of direct impact of high logistic cost, this also reduce peoples purchasing ability. Monthly per capita expenditure of NTT is the lowest in Indonesia (884,102 IDR) and below national average value (1,327,782 IDR). More detail, percentage of monthly food per capita in research area is in range between 42,77% up to 63,60%, where the lowest percentage is in Kupang as capital city of NTT, the rest value is in Kupang’s hinterland areas. It can be identified that residents in Kupang have more purchasing ability for the secondary need (non-food), in contrary the residents in rural area mostly prioritize buying food. Table 1 shows that there are unsubstituted commodities and depend on supply from another area like soya bean, palm oil, sugar, and egg. Scarcity of this commodity in Java as main producer and economy central is a serious challenge to Indonesian food security and may lead to a national price increase.
3.3. Tol Laut Ro-Ro as Alternative Concept
Tol Laut as government program aims to fulfil logistical needs and reduce price disparity in several 3TP areas including NTT by using subsidize sea transportation. Before establishment of Tol Laut, consumer goods supplied by private sector companies and government-owned company. Private sector companies are more flexible in providing more type of consumer goods, meanwhile The Indonesian Logistic Bureau (BULOG) mostly focus as market balancer and stock monitoring for food type like rice and palm oil. BULOG in Kupang as branch for NTT province not only responsible for stock control of goods in Timor Island but also for another island in NTT administrative territories, BULOG also depend on sea transportation for inter-island distribution. There are huge obstacles in getting these cargoes into the hands of those who need them most because Tenau Port is not included in the Tol Laut route, so there must be an effective and efficient alternatives supply chain logistics so that Tol Laut is able to present positive market disruptions in this area.
Tol Laut routes are connecting economy centre in Java and 3TP areas through Tanjung Priok and Tanjung Perak port in Java as existing national main connectivity in inter-island trade. The Tol Laut program that initiated in 2015 was followed up with the initial realization of 6 routes in 2016 with codes T-1 to T-6, until the 2022 fiscal year has grown to 33 routes. Increasing the number of routes is a positive performance indicator that shows more and more 3TP areas that can be served. The increasing coverage of the Tol Laut service certainly has its own consequences, the limited number of ships and the current capacity of ships have not been able to accommodate all the requests for new routes that continue to increase, and operationally have an impact on:
1)The addition of a new transit port will increase the shipping distance (nautical miles) because it is combined with the nearest existing Tol Laut route.
2)Additional round voyage days per route in the form of sail time and port time, which will directly add to the subsidy costs for ship operating costs.
3)The limited capacity of ships due to the increasing number of transit ports on each route has resulted in a reduction in the container user quota at each port.
Directorate General of Sea Transportation then do route optimization in 2 ways; shorten the route by eliminating not productive port, or split the existing route become 2 different new routes. This implementation can be seen on the Tol Laut route in East Nusa Tenggara, in the 2016 fiscal year Route T-3 serves the port of Tanjung Perak – Larantuka – Lewoleba – Rote – Sabu – Waingapu – Sabu – Rote – Lewoleba – Larantuka – Tanjung Perak with 2078 NM and 28 days per round voyage. This route was then separated into 2 separate routes, namely T-13 (Tanjung Perak – Rote – Sabu – Tanjung Perak) with 1408 NM and 17 days per round voyage, and T-14 (Tanjung Perak – Larantuka – Lembata – Kalabahi – Tanjung Perak) with 1537 NM and commission days of 19 days per round voyage. If in the future there is an additional request from the local government for Tol Laut new tranship port in this area, then the same problem will be repeated.
Logistic distribution in Indonesia is dominantly served by sea transportation, and each ships type has different competitive advantage. Container ships are better in terms of long-distance route and cargo capacity, meanwhile ferry ships are better choice for point-to-point round service and able to carry Ro-Ro vehicles.
Tol Laut’s alternative distribution in this research will use ferry Ro-Ro ship as liner carrier for a logistic truck, initial concept shown in Figure 6.
Conceptual model in this research is a point-to-point distribution scenario by using Ferry Ro-Ro ship. Main purpose of this concept is creating seamless distribution without cargo transhipment or double handling, pre-determined criteria as follow.
1)Direct connection between East Java with Kupang.
2)Using available existing ferry route.
3)Using ferry Ro-Ro with max tonnage 3000 GT (Gross Tonnage).
4)Ferry Ro-Ro capable of carrying 20 ft (feet) container truck.
Model analysis use Jangkar-Kupang ferry route consider that this route will directly connecting East Java and Kupang. Jangkar-Kupang ferry route is 610 NM and estimated travel time is 2,5 days per trip in mandatory travel speed 10 knot based on ferry ship minimum service standards39). Jangkar ferry port is in Situbondo around 243 km (kilometers) from Surabaya and also connected to another cities like Malang, Blitar, Jember, and Banyuwangi as centre of agriculture and poultry farms. Ferry port berthing capacity in Jangkar and Kupang can accommodate ferry ship up to 3000 GT.

Kupang ferry port berthing capacity construction from 1500 GT to 3000 GT in 2022 fiscal year make it suitable for new potential route for several ferry ships that eliminated from Merak-Bakauheni ferry crossing. Tonnage range of existing ferry ships in east Indonesia are between 500 – 1100 GT make it difficult to load 20 ft container truck, limited to Colt Double Diesel (CDD).
By using more bigger ships make it possible to load 20 ft container truck onboard. There are 4 ferry Ro-Ro ships from Merak-Bakauheni ferry route that suitable for Jangkar-Bolok route: Trimas Laila, Caitlyn, Munic I, and Windu Karsa Dwitya40). Each ship has different dimension that consider by ships operator to maximize the vehicles arrangement in car deck. In peak season where all vehicle types are available, then ship operator will use SUP (unit production) measurement unit based on occupancies volume that applied differently based on vehicle class. Car arrangement of each ship shown in following Table 4.
The ship’s car deck construction is multideck, the top deck in stern side and connected to the port by elevated side ramp for smaller vehicles especially for class IV, and the rest are loaded in car deck on main deck especially for truck through ramp door access. SUP comparison between main deck and top deck is 80 : 20. Truck for Tol Laut Ro-Ro especially for class VII vehicles which more suitable for full load 20 ft container to comply Tol Laut’s SOP (Standard Operating Procedure)41). Based on available space, the main deck will fully load with Tol Laut trucks.
The simulation is carried out by including the Tenau Port to the nearest Tol Laut route, namely T-13 (Surabaya – Rote – Sabu – Surabaya). T-13 serviced by Kendhaga Nusantara 11 container ship with 100 TEUs capacity and there are 56 TEUs Tol Laut’s quota per voyage for 17 voyages per year as contracted. The quote not yet fully occupied with only average 15 TEUs per voyage for 2 destination ports. Comparison analysis of market size potency and logistic cost between Tol Laut sea freight, Tol Ro-Ro and non-Tol cluster in Table 5 and Figure 7.
Table 4: Car arrangement
| Vehicle class | Unit Production | Trimas Laila | Caitlyn | Munic I | Windu Karsa Dwitya | ||||
|---|---|---|---|---|---|---|---|---|---|
| A | B1 (onboard) | A x B1 | B2 (onboard) | A x B2 | B3 (onboard) | A x B3 | B4 (onboard) | A x B4 | |
| IV | 33,26 | 18 | 598,68 | 30 | 997,8 | 35 | 1164,1 | 32 | 1064,32 |
| V | 61,55 | 12 | 738,6 | 17 | 1046,35 | 10 | 615,5 | 10 | 615,5 |
| VI | 100,51 | 22 | 2211,22 | 9 | 904.59 | 4 | 402,4 | 10 | 1005,1 |
| VII | 135,21 | 2 | 270.42 | 6 | 811,26 | 1 | 135,21 | 5 | 676,05 |
| VIII | 188,75 | 1 | 188,75 | 1 | 188,75 | 1 | 188,75 | 1 | 188,75 |
| IX | 272,74 | 1 | 272,74 | - | - | - | - | - | - |
| TOTAL A x B(n) | 4,280.41 | 3,948.75 | 2,505.96 | 3,531.72 | |||||
| Class VII max unit onboard | 25 | 23 | 14 | 20 | |||||
Table 5: Market size simulation of Tol Laut’s cargo in Kupang
| Non-Tol Laut | Tol Laut T-13 (sea freight) | Tol Laut Ro-Ro (concept) | ||
|---|---|---|---|---|
| min (15 TEUs) | max (25 TEUs) | min (15 TEUs) | max (25 TEUs) | |
| A (ton) | B1 (ton) | B2 (ton) | B1 (ton) | B2 (ton) |
| 74,812 | 5,100 | 8,500 | 14,400 | 24,000 |
| Market size (Bn/A) | 7% | 11% | 19% | 32% |


Simulation is divided by 2 scenarios; minimum scenario uses average capacity and maximum scenario use the remaining capacity to meet the maximum quota as shown in Table 5. Non-Tol Laut cargo use port performance report24) filtered by the amount of yearly average inbound cargo based on commodities in Table 1. Insufficient amount of cargo causing Tol Laut unable to balancing the supply in the market, on the contrary the similar commodities of non-Tol Laut cluster which controlled by private sector become dominant42).
Point to point distribution with ferry ro-ro resulted in higher ship call frequency compared to T-13 route, as it goes it will become an opportunity to add inbound and return cargo quantity from Tol Laut so that create a significant change in market size. The Ro-Ro Tol Laut service offers the potential for increased ship call frequency, with current operations demonstrating 2-3 ship calls per month. This contrasts with conventional container ship services operating under the Tol Laut program, which typically manage only one ship call monthly due to extensive port rotations within a single turnaround voyage. The efficiency of using the Tol Laut Ro-Ro for container truck cargo can also be seen in the significant reduction in cargo transhipment points (Figure 8) compared to distribution via container ship (Figure 3). Reducing transhipments will also reduce logistics costs.
Historically, prior to the government's implementation of the Tol Laut initiative, the provision of primary and essential goods to East Nusa Tenggara was primarily facilitated by the private sector. This was supported by existing private trade networks and private sector shipping lines, which cumulatively fulfilled the region's needs. So cumulatively, market size for non-Tol Laut cargo still dominate the market with percentage around 70%, so that it is not possible to distribute the Ro-Ro Tol Laut cargo evenly to be marketed to all hinterland areas. The reduction in price disparities is a further impact of the availability of cargo from the Tol Laut in the community, when it is available in significant quantities it will make prices more stable, but if there is very little Tol Laut cargo in circulation then the selling price will follow the price of goods from the non-Tol Laut cluster43,48).
Majority of Tol Laut cargo are sold out in big cities near to port shows lack of Tol Laut penetration to hinterland areas, while there is high price disparity in this area. Kupang City and Kupang Regency are two centre locations for economic activity which become main basis non-Tol Laut cargo as logistic centre. Centralize Tol Laut cargo for end consumer in rural areas can be one of marketing strategies adaptation44). If demand product segmentation is carried out based on the number of residents in each regency, the market size of the Ro-Ro Tol Laut cargo will be in a dominant position between 58% and 77%.
East Kupang District in Kupang Regency area still be the first potential entry point location to build Tol Laut logistic center since it is near to the port of Kupang City and near to three-way junction towards Naikliu and Belu through national highway access road. Ro-Ro Tol Laut cargo take 63% in market size so that it is possible to sell 10% of it to other areas such as Kupang City or Timur Tengah Selatan Regency as a potential expansion for Tol Laut cargo market. Establishment of Tol Laut not only by setting up logistic centre, it can be done also by empowering the local communities in hinterland areas as Tol Laut reseller. Most potential local communities are Small and Medium Enterprises (SME) because most of end consumers will do direct trading with them. SME's involvement in Tol Laut in Kupang can be one of the supports for increasing the volume of trade between regions and can even become a potential for export activities. SME will also consider lower logistics costs in order to be able to get profitable profit margins.
For this regard, in line with the government's plan to develop land transportation tariffs zonally, designate a goods transportation network, and guarantee minimum service standards and tariff, as a form of support for the Tol Laut program in East Nusa Tenggara45,46,47).
Local government plays a crucial role in supporting the distribution of goods via the Tol Laut Road to the hinterland, especially given the private sector's continued dominance in logistics distribution from Kupang to these areas. Currently, the absence of established operational and cost standards contributes to potential increases in logistics transportation expenses, as operators determine pricing. However, this challenge is being addressed proactively: the local government has drafted a Governor's Decree to regulate operational standards and tariffs based on regional zoning within East Nusa Tenggara. This decree is presently undergoing the ratification process. Once implemented, this regulation is anticipated to foster equality and equity, thereby enabling logistics businesses, from traders to end consumers, to access efficient logistics distribution facilities. Such facilities are vital for balancing supply and demand and mitigating price disparities.
By simulating the use of ferries for Tol Laut which gives positive results in terms of fulfilling supply-demand with high service frequency and low cost, it is hoped that connectivity between the economic centers of East Java and East Nusa Tenggara will be able to increase inter-regional trade, reduce price disparities as well as bridge East Nusa Tenggara local production marketing to East Java as return cargo. This research was carried out over several years with data analysis based on the year the survey was conducted, so that in the future there could be changes, especially in dynamic conditions such as population, prices, consumption patterns, change of ships, or even influenced by situations not studied in this research such as political aspects.
4. Conclusion
Tol Laut is a strategic government program connecting East Java, one of Indonesia's economic centers, with East Nusa Tenggara, a 3TP region, through subsidized container shipping. The existing program utilizes container ships with numerous transhipment ports, requiring long turnaround voyages and an average shipcall frequency of only once a month. Tol Laut using Ro-Ro ships, is an alternative offered in this study, leveraging the competitive advantage of Ro-Ro ships serving only two ports, thereby increasing shipcall frequency. Furthermore, its ability to load container trucks will support door-to-door inter-island distribution. This study uses various analytical methods based on logistics planning stages, beginning with determining the supply-demand of primary and important goods, price disparities, comparing transportation cost components, and comparing inbound cargo. The analysis results show that, in general, several commodities still need to be imported from outside the East Nusa Tenggara region, and in actual conditions, these are still predominantly supplied by non-Tol Laut clusters. By using the Tol Laut Ro-Ro concept which is supported by selecting strategic entry point locations, the market size of the Tol Laut product can be increased from 19% to 32%. To optimize the distribution of cargo to the hinterland, it is recommended to create a logistics center that provides integrated services from several government agencies and other stakeholders of the Tol Laut. Subsequent research can discuss the efficient distribution pattern of Toll Laut cargo in the port hinterland area. Implementation of this concept needs to pay attention to several future challenges which also open up opportunities for further research development, such as the limitations of Ro-Ro ships which do not actually have reefer plugs so they are not yet able to transport reefer containers, responsibility for carrying out loading-unloading or stuffing-unstuffing container activities, as well as adjustments to related regulations.
Acknowledgment
The authors would like to thank the Head of Transportation Mode Policy Center, Directorate General of Land Transportation, Directorate General of Sea Transportation, BPTD Kelas II Nusa Tenggara Timur, PT. ASDP, GAPASDAP, and other parties who supported us in this research. This research was funded by the Transportation Policy Agency – Ministry of Transportation with grant Number SK.13/HK.206/2/13/BLTL.
References
- M. Berawi, P. Miraj, and H. Sidqi, “Economic corridor of industrial development in Indonesia,” IOP Conf. Ser.: Earth Environ. Sci., 109(1), 012032 (2017). https://iopscience.iop.org/article/10.1088/1755-1315/109/1/012032/meta
- M. Kuncoro, “Economic Geography of Indonesia: can MP3EI reduce inter-regional inequality,” South East Asian J. Contemp. Bus. Econ. Law, 2(2), 17–33 (2013). https://seajbel.com/wp-content/uploads/2014/07/Economic-Geography-Of-Indonesia-%E2%80%93-Can-Mp3ei-Reduce-Inter-Regional-Inequality-Mudrajad-Kuncoro.pdf
- H. Hill, “What’s Happened to Poverty and Inequality in Indonesia over Half a Century?,” Asian Dev. Rev., 38(1), 1–32 (2021). https://doi.org/10.1162/adev_a_00158 [DOI]
- D. W. Prabowo and A. Priantomo, “The Analysis of Inter-Island Trade Data Collection,” ICOT 2019, 151–154 (2019). 10.2991/icot-19.2019.32
- Central Statistics Agency, “Interregional Trade in Indonesia 2021,” BPS (2022). https://www.bps.go.id/en/publication/2024/03/01/49016c4556ea47b96d62e9bf/perdagangan-antar-wilayah-indonesia-2023.html
- F. Zen and M. H. Yudhistira, “Maritime Highway and Eastern Indonesia Development,” Joint Study ERIA, LPEM UI (2022). https://www.eria.org/uploads/Maritime-Highway-and-Eastern-Indonesia-Development.pdf (accessed December 27, 2024)
- United Nations, “Review of Maritime Transport 2020,” UNCTAD (2020). https://unctad.org/system/files/official-document/rmt2020_en.pdf (accessed December 27, 2024)
- C. Amin, H. Mulyati, E. Anggraini, and T. Kusumastanto, “Impact of maritime logistics on archipelagic economic development in eastern Indonesia,” Asian J. Shipp. Logist., 37(2), 157–164 (2021). https://doi.org/10.1016/j.ajsl.2021.01.004 [DOI]
- F. A. Barata, “High cost of logistics and solutions,” INSYMA 2020, 407–410 (2020). doi:10.2991/aebmr.k.200127.083
- D. Sinha, “The Impact Of Cost Of Logistics In Pricing Of Goods For Global Markets: A Pricing Framework,” Excellence in Research and Education Conference (EREC), ISSN: 0975-1653 (2011). https://www.researchgate.net/publication/303488019_The_Impact_Of_Cost_Of_Logistics_In_Pricing_Of_Goods_For_Global_Markets_A_Pricing_Framework
- B. P. Jangam and V. Akram, “Do prices converge among Indonesian cities? An empirical analysis,” Bull. Monet. Econ. Bank., 22(3), 239–262 (2019). DOI: https://doi.org/10.21098/bemp.v22i3.1152 [DOI]
- Directorate General of Sea Transportation, “Official Launch of the Tol Laut Program,” Dephub (2015). https://dephub.go.id/post/read/program-tol-laut-resmi-diluncurkan
- S. Mahardianingtyas, D. A. Safitra, and A. Agustio, “A Blue Economy for Better Economic Development: A Case Study of East Nusa Tenggara,” APBEC 2018, 165–173 (2019). 10.2991/apbec-18.2019.22
- “Consumer Price Index and Inflation in East Nusa Tenggara Province 2021,” Indonesian Statistic (2022). https://ntt.bps.go.id/en/publication/2022/08/03/f4f0fd4f8b01d5ee7eec81ff/indeks-harga-konsumen-dan-inflasi-provinsi-nusa-tenggara-timur-2021.html (accessed December 27, 2024)
- L. Y. Mauk, A. Molidya, R. E. Fanggidae, and O. N. Pau, “Inflation Persistence in East Nusa Tenggara,” ISBEST 2019, 254–259 (2020). 10.2991/aebmr.k.200522.048
- Y. Manti, L. T. W. N. Kusuma, A. Ramadhani, and M. Majid, “Indonesia Tol Laut strategy framework directive,” ICOEMIS 2019, 394–405 (2019). 10.2991/icoemis-19.2019.54
- L. T. W. N. Kusuma and F. S. Tseng, “Analysis of the impact of the ‘Tol Laut’ program for seaports,” Appl. Sci., 9(16), 3407 (2019). 10.3390/app9163407
- LPSE Ministry of Transportation, “Electronic Procurement Service,” Dephub (2022). https://spse.inaproc.id/dephub/lelang (accessed January 11, 2025)
- I. Kotowska, “The role of ferry and Ro-Ro shipping in sustainable development of transport,” Rev. Econ. Perspect., 15(1), 35–48 (2015). doi:10.1515/revecp-2015-0010
- A. Ariyanto, “Comparison Analysis of Container Transport with Ro-Ro Ships: Case Study Semarang – Sampit,” Repos. ITS (2018). https://repository.its.ac.id/56140/ (accessed December 27, 2024)
- K. Heryandri, “The Importance of Ferry Ro-Ro Transportation in Indonesia,” Adv. Transp. Logist. Res., 1, 641–651 (2018). DOI: https://doi.org/10.25292/atlr.v1i1.69 [DOI]
- “Transportation Minister Opens 2023 National Coordination Meeting on Maritime Toll Roads, Showing Increase in Ship Loads” Bureau of Communication and Public Information. https://kemenhub.go.id/post/read/menhub-buka-rakornas-tol-laut-2023,-realisasi-muatan-kapal-terus-meningkat (accessed January 11, 2025)
- “Integration and Utilization of Ro-Ro Ferry Ships in NTT,” LSDP Zoom Webinar (2022). https://us06web.zoom.us/rec/play/2ITOzn9y7ASTQE-7DOPgne35gIQzK_1xGArU1CJiRk-6iC4DDTaa5x2hpQ7NXrXY_hbs5cgYjNGr_BYY (accessed January 11, 2025)
- Port Authority of Tenau Kupang, “Tenau Port Productivity,” Dir. Gen. Sea Transp. (2022).
- “East Nusa Tenggara Province in Figures 2022,” Indonesian Statistic (2022). https://ntt.bps.go.id/en/publication/2022/02/25/cc3b48ec498e16518636e415/provinsi-nusa-tenggara-timur-dalam-angka-2022.html (accessed January 11, 2025)
- Nailah. F, Sutikno, F.R, Ratri, A.A, “Evaluating Environmental Impacts of Green Logistics Initiatives in Batam Indonesia,”Evergreen 11(2)., 1081-1088 (2024) https://doi.org/10.5109/7183408. [DOI]
- D. Weigert, T. Reggelin, and J. Tolujew, “Material Flow Simulation of Logistics Processes,” MultiScience-XXXI (2017). doi:10.26649/musci.2017.048
- F. Salva, E. Pujo, and A. Nasihah, “Implementation of the Sitolaut Application,” J. Matemar, 4(2), 29–36 (2025). DOI: https://doi.org/10.59225/3jznd987 [DOI]
- “Indonesia Sea Toll Portal: Route Details,” Ministry of Transportation. https://sitolaut.dephub.go.id/detail/trayek (accessed January 11, 2025)
- J. C. Chambers, S. K. Mullick, and D. D. Smith, “How to choose the right forecasting technique,” Harv. Bus. Rev. (1971). 10.1225/71403
- R. J. Hyndman and G. Athanasopoulos, “Forecasting: principles and practice,” Heathmont, Vic. : OTexts (2014) https://archive.org/details/forecastingprinc0000hynd (accessed January 11, 2025)
- F. Esser and R. Vliegenthart, “Comparative Research Methods,” Int. Encycl. Commun. (2017). https://doi.org/10.1002/9781118901731.iecrm0035 [DOI]
- L. G. Cooper, “Market-share models,” Handb. Oper. Res. Manag. Sci., 5, 259–314 (1993). https://escholarship.org/content/qt1gk2z67m/qt1gk2z67m_noSplash_3fabc6d7de059914e4c306fc58649c48.pdf (accessed December 23, 2024)
- N. H. Tien et al., “Analysis Of Mega Market's Market Penetration Strategy,” Channels, 7, 9 (2020). https://allinnovationjournal.com/assets/archives/2020/vol2issue2/2-1-14-439.pdf (accessed December 12, 2024)
- M. Jeeweetha and D. Gayathiri, “An Analysis Of Price Disparity: Pink Tax,” JETIR, 9(5) (2022). 10.1729/Journal.30319
- J. A. Purba et al., “Analysis of Marketing Channels and Price Disparity of Shallots,” IOP Conf. Ser., 782 (2021). 10.1088/1755-1315/782/2/022002
- S. M. M. Ruslan and K. Mokhtar, “An Analysis of Price Disparity: Peninsular Malaysia and Sabah,” J. Ekon. Malays., 54(2) (2020). DOI: http://dx.doi.org/10.17576/JEM-2020-5402-5 [DOI]
- E. Be, “Impact Of Rice Production and Supply On Food Security,” J. Manaj. Agribisnis, 19(3) (2022). 10.17358/jma.19.3.407
- Ministry of Transportation, “Ministerial Decree No. PM 62 of 2019,” Dephub (2019). Link
- BKI, “BKI Reliable: Ship Register Homepage,” (2022). Link
- DGST, “Decree No KP. 804/DJPL/2021 on SOP of Ship’s Cargo Hold Booking,” in Yolanda. A, Rudianto, Rumambi. F.J, “Analysis Of The Implementation Of The H-1 Sea Highway Tray In Reducing Prices Of Basic Goods Disparities In The Tahuna Region Of The Sangihe Islands,” Journal of Social and Economics Research 6(1). (2024). https://doi.org/10.54783/jser.v6i1 [DOI]
- R. Sinaga and A. Kurniawan, “Evaluation of the Impact of Goods Transportation in Route T-3,” R&D Sea Transp. (2016).
- A. Kurniawan et al., “Evaluation of Tol Laut in Tahuna and Natuna,” IOP Conf. Ser., 1423 (2024). 10.1088/1755-1315/1423/1/012015
- B. Wu, “Marketing leadership management,” Consum. Manag., 389–417 (2011). 10.1016/b978-1-907568-07-7.50016-x
- DGLT, “Strategic Plan (Renstra) of BPTD Class II NTT 2020-2024,” BPTD (2023).
- B. S. Waloejo et al., “The Effect of Land Use on The Road’s Level of Service,” JASEIT (2024). 10.5109/7183416
- I. Surjandari et al., “Evaluation of efficiency in logistics company: last-mile delivery,” JASEIT (2023). 10.5109/6792811