
Abstract
Dwelling time is a crucial indicator of port efficiency, as prolonged container dwell time can undermine logistics competitiveness and increase operational costs. At New Makassar Container Terminal 1, which one of the main maritime gateways to Eastern Indonesia, delays especially in yard often exceed national standards, highlighting the need for operational improvement. This study hypothesizes that sector (domestic or import), container size (20 ft or 40 ft), and commodity type (food, industrial, or building materials) significantly influence container dwelling time, whether individually, through two way interactions, or through a combined three way interaction. To test these hypotheses, a quantitative approach was applied using Three-Factor ANOVA design was employed as the primary analytical framework. The results indicate that domestic and import sectors as well as between 20 ft and 40 ft containers are significantly affect dwelling time. However commodity type, two way interaction and combined three way interaction do not significantly affect dwelling time. Domestic and 20-ft containers consistently show longer dwelling times, mainly due to higher throughput and more frequent re-handling. These findings contribute to a deeper understanding of the operational dynamics influencing container flow and provide a methodological reference for analyzing multi factor effects on port performance.
Keywords: commodity, container size, dwelling time, sector
Outline
1. Introduction
The efficiency of a logistics system is one of the key determinants of a country’s competitiveness. With nearly half of global trade value relying on maritime transportation1), Some of the successes that occur in marine transport are determined by the two main components, they are ships and ports2). Futhermore Ports also pivotal hubs in the global distribution3). Improving port performance is crucial because it directly impacts logistics efficiency, increases maritime trade, and accelerates economic growth4) and The success of port development is strongly influenced by several port facilities5). Therefore, efforts to increase port efficiency are an important agenda for developing countries, including Indonesia.
One of the most widely used indicators to measure port efficiency is dwelling time6), According to Government Regulation No. 20 of 20107), loading and unloading is an activities at ports including stevedoring, cargodoring, yard stacking, and delivery which are the components of dwelling time. Some of the main obstacles in the Indonesian logistics chain are long dwelling times at ports8). The consequences of long dwell times can reduce port operational efficiency and have a negative impact on the economy in general9).
In an effort to improve logistics efficiency and port competitiveness, the Indonesian government continues to update standards and regulations related to dwelling time. Based on the latest data from the Ministry of Transportation, the national target for dwelling time at Indonesia’s main ports is set at no more than 3 days. This standard is an adjustment from the previous target of 4-5 days, which shows the government's commitment to continuously improve port performance10). However, field observations show that, the average dwelling time at the New Makassar 1 Container Terminal is still above the government's target, which is more than three days11). Makassar Port is one of the five main ports in Indonesia, along with Belawan, Tanjung Priok, Tanjung Perak, and Balikpapan holds a highly strategic position, as it serves as a route for international shipping lines from countries such as Australia, Japan, and other East Asian nations passing through the Makassar Strait12).
Previous research on port dwelling time can be categorized into three main themes: infrastructure, administrative policy, and digital transformation. This thematic structure illustrates the evolution of existing studies and helps identify remaining research gaps. From Infrastructure perspective according to Tongzon13), port efficiency in Southeast Asian countries, including Indonesia, is significantly impacted by infrastructure limitations and administrative bottlenecks that create cascading effects on overall logistics performance. Lam and Notteboom14) highlighting that "capacity constraints at major Indonesian ports, particularly inadequate yard space and outdated handling equipment, represent fundamental barriers to achieving competitive dwelling times”. In addition, the challenges of integration between maritime and land transportation networks in Indonesia remain significant, with limited intermodal facilities and inadequate backwater connectivity hampering port efficiency15), haryani et al16) also note that the success of port development is strongly influenced by the adequacy of supporting facilities and infrastructure. Under the administrative policy theme, a study by Asian Development Bank17) reveals that "regulatory complexity and fragmented institutional frameworks contribute significantly to extended cargo dwelling times at Indonesian ports, with multiple agencies requiring separate clearances creating administrative bottlenecks. In terms of Digital transformation in Indonesia port operations remains limited, with insufficient integration of information systems among port stakeholders leading to process inefficiencies and coordination challenges18). Notteboom et al.19) similarly argue that research in Southeast Asia has traditionally emphasized physical infrastructure expansion, while digital technology integration and stakeholder coordination warrant greater academic attention. This research gap is further emphasized by Wang and Cullinane20), who note that empirical studies examining the relationship between administrative reform, technology adoption, and port performance in developing economies such as Indonesia remain limited.
Several previous studies also have identified key factors that affect dwelling time. Such us, Wardana et al21) highlighted that the document inspection process, loading and unloading delays, and stacking yard capacity are the main factors affecting dwelling time. Recommended Reduction strategies include imposing fines, accelerating licensing procedures, and improving warehousing facilities. However, their study has not specifically discussed other aspects, by comparing the domestic and import sectors and considering variations in container size and commodity type. Especially in developing countries, this aspect is rarely discussed in depth22).
Furthermore, existing studies are often descriptive or conceptual in nature. Sunitiyoso23) uses a systems thinking approach to map the interactions between factors that affect port performance, such as policy, human resources, and technology. However, this approach remains conceptual and does not quantitatively assess the direct effects of operational variables on dwelling time. Although it provides a comprehensive conceptual overview, it lacks empirical evidence that can be translated into actionable efficiency improvement strategies. Marikka Heikkilä24) uses the method of scenario analysis based on literature and studies to build a conceptual and strategic understanding of smart ports. The application of automation that includes Industry 4.0 based technology is considered capable of increasing the efficiency of operational activities while reducing container dwelling time, the study discusses port automation in general and does not examine specific cargo or logistics operational categories that theoretically influence dwelling time, particularly in the context of Indonesian ports.
Sugeng santoso25), using descriptive and simulative methods based on secondary data, highlighting that logistics costs in Indonesia are very high, reaching 23.2% of GDP. One of the causes is the inefficiency of coordination between institutions which has an impact on the length of dwelling time. However, this study adopts a macro level perspective and does not provide a micro level analysis at the container terminal level.
These limitations indicate a significant research gap. First, most previous studies have focused on macro level aspects, while empirical studies at the micro level, particularly in container terminals are rare. Second, important variables such as container size, commodity type, and the differences between domestic and import services have not been studied in depth. Third, few studies have used a quantitative approach based on the latest operational data to examine the influence of these factors on dwelling time. Therefore, research that is not only descriptive but also analytical and data driven is needed to make a significant contribution to strategies for improving port performance. The conceptual framework of this study is illustrated in Figure 1.
To fill the gap that has not been widely discussed in previous studies, this study aims to analyze the effect of interactions between the sector, commodity and container size on dwelling time at New Makassar 1 Container Terminal. This study hypothesizes that these three factors could influence the length of dwelling time. Therefore, it proposes that these factors, whether individually, through two-way interactions, or through their combined three-way

interaction, significantly impact dwelling time. Specifically, the study examines whether sector (domestic or import) significantly affects container stay duration, whether variations in commodity (food, industrial, or building materials) contribute to differences in dwelling time, and whether container size (20 ft and 40 ft) leads to significant differences in this duration. Additionally, it examines potential interaction effects between sector and commodity, sector and container size, commodity and container size, and the three-way interaction among all three factors on container dwelling time. These hypotheses are empirically tested using a three-way ANOVA to determine whether these factors, individually or combine, contribute significantly to variations in container dwelling time at the port. By utilizing the latest operational data and a quantitative approach, this study is expected to make a real contribution to efforts to optimize port performance in Eastern Indonesia and reduce dwelling time. Thus, this study seeks to develop an empirical framework based on container operational data through the application of multivariate ANOVA analysis, which can strengthen academic understanding while offering a practical basis for decision making in the port logistics sector.
2. Method
This research adopts a quantitative approach with purposive sampling. The study population comprises all ships that called at Makassar Port between January and December 2023. Samples were selected based on operational frequency and the completeness of available data. The analysis utilizes secondary data obtained directly from the port operator’s official operational records. These data provide information on the average monthly dwelling time of vessels for each factor analyzed, thereby representing the port’s operational conditions in an aggregated and consistent manner throughout the observation period. This process aims to reduce the potential bias generated by extreme variations in individual data, thereby producing a more objective general representation for each group.
The dataset includes information on service sector (domestic and import), container dimensions (20 ft and 40 ft), and commodity categories such as foodstuffs, industrial products, and construction materials. To maintain reliability, incomplete entries or irregular records were excluded, and uniform procedures were applied for time measurement across all operational stages.
The analytical method employed is a Three-Factor ANOVA, chosen over alternatives such as Two-Way ANOVA, as it permits simultaneous testing of three independent variables sector, container size, and commodity type while also assessing their interaction effects. This approach generates more comprehensive insights than regression or simpler ANOVA designs. Assumption testing involved the Shapiro–Wilk test for normality and Levene’s test for homogeneity of variances. Although the normality assumption was partially violated, the robustness of ANOVA with large sample sizes26).
Through Three-Factor ANOVA, dwelling time was analyzed by decomposing total variance into components attributable to individual factors, their interactions, and residual error. This method evaluates whether mean differences across groups formed by the combinations of factors are statistically significant using the F-test. For example, the analysis explored whether the effect of container size differs between domestic and import services, or whether commodity type influences dwelling time differently across service sectors. A common practice in statistical testing is to assume a 95% confidence level in the results for the effect to be categorized as statistically significant, which means that the p-value must be less than 0.0527). A three-way interaction was also tested to determine whether the combined influence of sector and container size varies depending on commodity type. The overall research procedure is presented in Figure. 2.

3. Result
3.1. Data Description
This section presents a descriptive analysis of data from the New Makassar 1 Container Terminal, focusing on two critical variables: length of stay and the number of containers. By examining these metrics, the analysis identifies emerging trends and potential inefficiencies, providing insights that can inform efforts to optimize terminal performance and strengthen operational effectiveness.
Based on the descriptive data for January to December 2023 at the New Makassar 1 Container Terminal, Table 1 indicates that among four processes analyzed using combined commodity-level data, the stevedoring and cargodoring stages show average handling times that remain within the normal operational range and are lowest than those of the other processes, This is reflected in the maximum values recorded for each respective process, as outlined below.
Stevedoring: The unloading of containers from ship to wharf, shows a clear efficiency gap between import and domestic shipments. Import operations are relatively stable : 20 FT containers require between 2 to 13.1 minutes, while 40 FT containers are handled much more quickly, typically between 0.2 and 3.5 minutes. In contrast, domestic operations display greater variability. A 20 FT domestic containers may be unloaded in as little as 0.2 minutes or take up to 33.1 minutes. Although 40 FT domestic containers are generally processed faster, their handling times also demonstrate significant inconsistency, occasionally extending beyond 9 minutes. The monthly stevedoring performance data are presented in Table 1.
Cargodoring: The unloading of containers from the wharf to the container yard for import, flows shows that 20 FT unit typically ranges from 8.7 to 16.0 minutes, while a 40 FT unit require between 5.8 and 11.0 minutes. A consistent trend throughout the year shows that 40 FT import containers are handled more quickly than their 20 FT counterparts. In contrast, the unloading times for domestic display far greater variability and significantly wider ranges.
A 20 FT domestic container requires 7.6 to 40.0 minutes, while a 40 FT ranges from 6.7 to 23.0 minutes. Notably, data for April and October shows extreme fluctuations, with maximum unloading times far exceeding the typical monthly averages. This significant variance, particularly within the domestic category, indicates potential operational inconsistencies or disruptions during those periods, and reinforces that import container handling is generally more stable and efficient. The monthly cargodoring performance data are presented in Table 2.
Table 1: Container Unloading From Ship To Wharf (Stevedoring) In Minutes
| Month | Impor | Domestic | ||
|---|---|---|---|---|
| 20 FT | 40 FT | 20 FT | 40 FT | |
| January | 3.0 - 7.5 | 0.9 - 1.6 | 0.2 - 28.6 | 0.1 - 8.3 |
| February | 4.7 - 13.1 | 1.0 - 3.5 | 0.2 - 20.0 | 0.2 - 9.1 |
| March | 1.4 - 3.0 | 0.3 - 1.0 | 1.2 - 9.8 | 0.2 - 4.8 |
| April | 2.4 | 1.6 | 1.4 - 26.9 | 0.1 - 7.0 |
| May | 2.0 - 4.8 | 0.2 - 0.5 | 1.1 - 33.1 | 0.1 - 5.8 |
| June | 2.2 - 5.8 | 0.3 | 0.5 - 12.3 | 0.1 - 2.3 |
| July | 2.1- 4.9 | 0.5 – 1.1 | 1.5 – 23.0 | 0.3 – 2.4 |
| August | 2.3 – 5.2 | 0.3 – 2.2 | 0.7 – 14.2 | 01 – 6.2 |
| September | 2.7 – 6.7 | 0.2 – 0.7 | 0.6 – 12.8 | 0.2 – 8.3 |
| October | 3.5 – 8.1 | 0.7 – 1.3 | 1.3 – 22.5 | 0.1 - 9.3 |
| November | 2.3 – 4.5 | 0.3 – 1.2 | 1.2 - 27.3 | 0.4 – 7.8 |
| December | 3.2 – 7.6 | 0.4 | 0.7 – 13.9 | 0.1 – 9.5 |
Table 2: Container Unloading From Wharf To Container Yard (Cargodoring) In Minutes
| Month | Impor | Domestic | ||
|---|---|---|---|---|
| 20 FT | 40 FT | 20 FT | 40 FT | |
| January | 10.1 - 12.6 | 8.0 - 9.3 | 7.6 - 12.9 | 6.8 - 9.4 |
| February | 9.5 - 16.0 | 7.8 - 11.0 | 8.3 - 17.0 | 7.0 - 11.5 |
| March | 9.3 - 11.5 | 7.6 - 8.8 | 8.1 - 13.4 | 7.0 - 9.7 |
| April | 11.5 | 8.7 | 8.1 - 40.0 | 7.0 - 23.0 |
| May | 8.7 - 13.7 | 5.8 - 7.3 | 8.4 - 16.2 | 7.2 - 11.1 |
| June | 9.8 - 10.5 | 7.9 - 8.2 | 7.8 - 16.4 | 6.9 - 11.2 |
| July | 9.0 - 13.5 | 7.5 - 9.0 | 7.9 - 15.8 | 6.7 - 10.8 |
| August | 10.2 - 14.0 | 8.2 - 9.5 | 8.0 - 18.0 | 7.1 - 12.0 |
| September | 9.6 - 11.8 | 7.7 - 8.9 | 8.2 - 14.0 | 7.1 - 10.0 |
| October | 11.0 - 12.8 | 8.5 - 9.1 | 8.3 - 35.0 | 7.3 - 20.0 |
| November | 8.9 - 14.2 | 6.0 - 7.5 | 8.5 - 16.5 | 7.3 - 11.3 |
| December | 9.7 - 10.8 | 7.8 - 8.3 | 7.9 - 16.0 | 6.8 - 11.0 |
Yard Stacking: The duration containers spend in the stacking yard after unloading, measured in days. For import containers, generally shows short minimum stacking times, often less than half a day., indicating that some containers are moved out of the yard relatively quickly. However, maximum stacking times for import containers, particularly 20 FT, can extend significantly, frequently exceeding 15 days, and peaking at 19.43 days in October. This wide disparity suggests that while many import containers are quickly processed, others experience substantial delays within the yard. A similar pattern is observed for domestic containers, the maximum stacking times for domestic containers can also be quite prolonged, consistently reach the upper teens of days, and in some cases surpass 19 days. The monthly yard stacking duration data are presented in Table 3.
Delivery (Waiting Handling): waiting and handling times for container unloading shows wide variability across both import and domestic flows. For import containers, the lowest waiting times are often below 5 minutes for 20 FT containers. However, the highest waiting times frequently reach 60 minutes for both 20 FT and 40 FT import containers. Minimum waiting times for 20 FT domestic containers are consistently low, often typically around 2-4 minutes, while 40 FT domestic containers generally show slightly higher minimums. As with imports, maximum waiting times for domestic containers frequently reach 60 minutes for both sizes throughout the year.
The descriptive results above indicate that the yard stacking is primary contributors to the overall handling duration of unloaded containers (dwelling time). As noted earlier, the longest yard stacking times occur in the domestic sector. Accordingly, the subsequent analysis focuses on a detailed examination of domestic container data. The following section provides a commodity-level breakdown of yard stacking performance within the domestic segment. The monthly delivery data are presented in Table 4.
Table 3: Container Unloading At Stacking Yard (Yard Stacking) In Days
| Month | Impor | Domestic | ||
|---|---|---|---|---|
| 20 FT | 40 FT | 20 FT | 40 FT | |
| January | 0.13 - 17.35 | 1.37 - 14.19 | 0.04 - 16.5 | 0.04 - 18.75 |
| February | 0.55 - 15.8 | 0.18 - 10.39 | 0.03 - 19.85 | 0.06 - 18.95 |
| March | 0.67 - 13.74 | 0.79 - 15.03 | 0.03 - 18.9 | 0.04 - 18.98 |
| April | 0.46 - 14.97 | 0.44 - 17.07 | 0.05 - 18.3 | 0.05 - 18.74 |
| May | 0.27 - 15.35 | 0.39 - 11.37 | 0.03 - 19.56 | 0.03 - 19.08 |
| June | 0.24 - 18.68 | 0.24 - 18.68 | 0.02 - 19.66 | 0.03 - 18.07 |
| July | 0.30 – 13.77 | 0.15 – 15.05 | 0.04 – 10.90 | 0.04 – 10.98 |
| August | 0.36 – 18.45 | 0.34 – 17.45 | 0.02 – 11.34 | 0.03 – 17.09 |
| September | 0.40 – 17.88 | 0.25 – 15.67 | 0.03 – 10.97 | 0.03 – 16.09 |
| October | 0.39 – 19.43 | 0.30 – 18.76 | 0.03 – 09.45 | 0.04 – 17.98 |
| November | 0.23 – 18.53 | 0.30 – 19.66 | 0.01 – 11.78 | 0.02 – 16.04 |
| December | 0.43 – 17.95 | 0.45 – 15-74 | 0.04 – 10.56 | 0.02 – 17.76 |
Table 4: Container Unloading Delivery (Waiting Handling) In Minutes
| Month | Impor | Domestic | ||
|---|---|---|---|---|
| 20 FT | 40 FT | 20 FT | 40 FT | |
| January | 1.12 - 42.58 | 29.97 | 1.88 - 60.0 | 2.8 - 50.0 |
| February | 14.67 - 44.74 | 14.97 - 39.5 | 1.8 - 59 | 3.88 - 60.0 |
| March | 4.13 - 60.0 | 37.66 - 43.5 | 2.16 - 60.0 | 7.97 - 60.0 |
| April | 2.7 - 58.71 | 16.28 - 60.0 | 1.93 - 60.0 | 2.25 - 60.0 |
| May | 1.26 - 60.0 | 18.64 - 60.0 | 3.2 - 60.0 | 2.56 - 60.0 |
| June | 14.19 - 60.0 | 6.43 - 60.0 | 3.77 - 60.0 | 6.04 - 60.0 |
| July | 5.25 - 55.0 | 12.50 - 45.0 | 2.50 - 60.0 | 4.75 - 60.0 |
| August | 10.0 - 60.0 | 20.0 - 50.0 | 2.0 - 60.0 | 5.0 - 60.0 |
| September | 3.5 - 60.0 | 25.0 - 60.0 | 1.75 - 60.0 | 3.0 - 60.0 |
| October | 8.0 - 58.0 | 15.0 - 60.0 | 2.25 - 60.0 | 4.5 - 60.0 |
| November | 6.0 - 60.0 | 10.0 - 60.0 | 3.5 - 60.0 | 5.5 - 60.0 |
| December | 15.0 - 60.0 | 8.0 - 60.0 | 4.0 - 60.0 | 7.0 - 60.0 |
3.2. Domestic Sector Yard Stacking Precess Descriprion Details
Based on the data shown in Figure 3, a total of 7,398 domestic 20 FT containers were unloaded and stacked in the yard between January and December 2023. The distribution of storage durations shows that most containers experienced relatively short dwell time. In total, 56.47% of the containers stayed in the yard for up to three days, with 19.65% cleared within one day, 18.03% within two days, and 18.79% within three days.
Containers that stayed in the yard for more than three days accounted for 43.53%, indicating the presence of delays or bottlenecks in some logistics processes. The proportion of containers stayed for four to six days was also significant, at 16.13%, 9.39%, and 6.60%. respectively, suggesting periods of congestion within the supply chain. After six days, the number of containers dropped quickly, with only 4.38% staying for six to seven days and less than 3% remaining in the yard thereafter.
Extreme cases were also observed in which containers stayed in the yard for up to 19 days, although this happened very rarely only 0.03% or two units were recorded in June and October. While infrequent, these outliers are significant because they can affect the average dwell time and may indicate issues such as delays in cargo pickup or administrative problems. Overall, most unloading and cargo release activities happens within the first few days, and there is a noticeable decrease after day four.
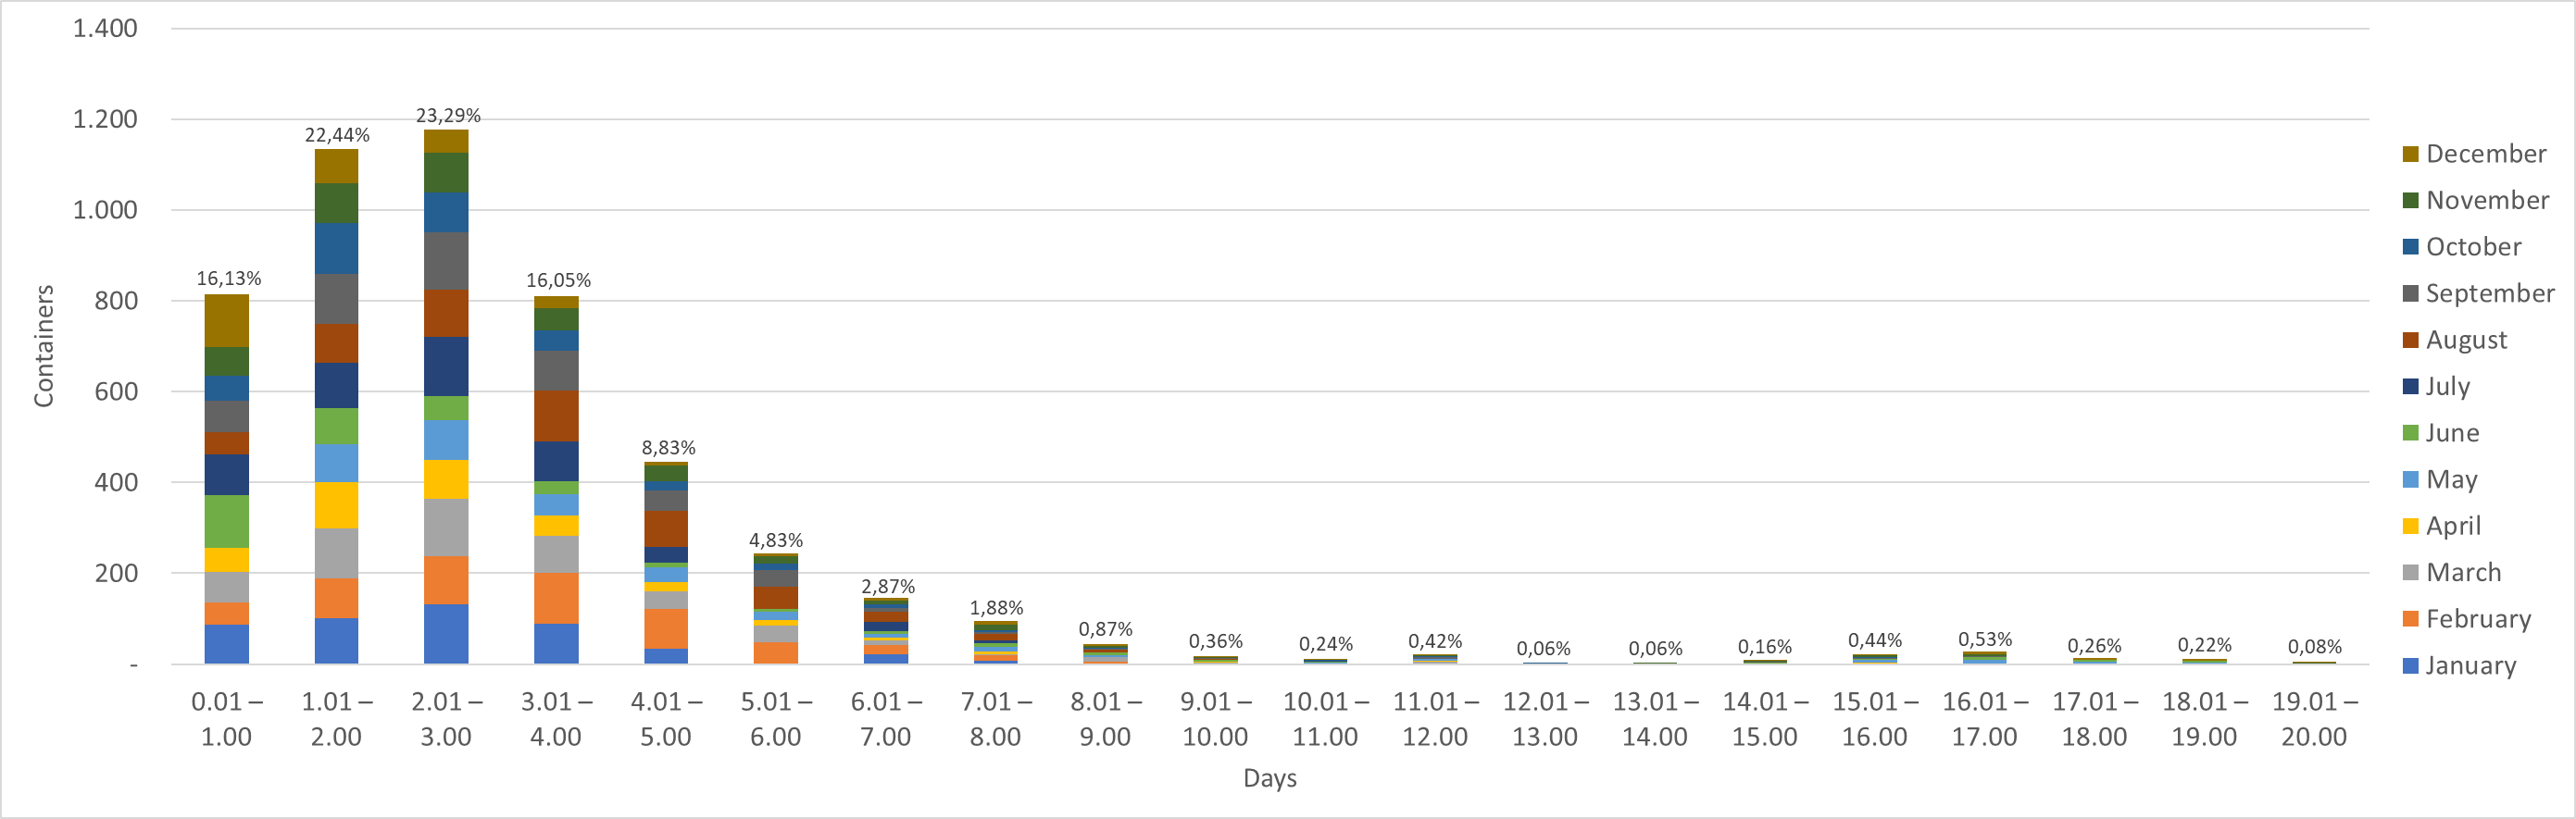
According to Figure 4, a total of 5,053 domestic 20 FT containers carrying industrial goods were unloaded and stored in the yard between January and December 2023. The majority of these containers had short dwell times, with 61.86% cleared from the yard within the first three days: 16.13% cleared within one day, 22.44% within two days, and 23.29% within three days.
However, 38.14% of containers stayed in the yard for more than three days, indicating potential bottlenecks in downstream logistics operations. The proportions of containers cleared for four and five days were 16.05% and 8.83%, respectively, before significantly declining on the fifth day. The data show a consistent decrease in container dwell time following the three-day peak, with only 4.83% remaining for up to six days and less than 3% stored beyond that duration.
There were a few extreme cases where containers stayed in the yard for up to 20 days. These represented only 0.08% of the total, or four units, and occurring in May, June, November, and December. Although extreme, these cases can influence average dwell time and may indicate issues such as delayed pick up or administrative problems. Overall, industrial cargo moves quickly with most containers cleared within the first three days and long-term storage remaining uncommon.

Based on Figure 5, a total of 2,908 domestic 20 FT containers carrying building materials were unloaded and stacked in the yard between January and December 2023. The distribution of dwell times shows that most containers experienced relatively short storage durations. With 64.86% of the containers cleared from the yard within the first four days, 11.07% cleared within one day, 14.31% within two days, 21.39% within three days, and 18.09% within four days.
However, 35.14% of the containers stayed in the yard for more than four days, suggesting delays in downstream distribution or postponed cargo pickup. The proportion of containers staying five, six, and seven days was still notable at 13.14%, 10.01%, and 6.43%. After seven days, the numbers dropped quickly, with fewer than 3% of containers remaining beyond eight days. A small number of extreme cases where containers stayed in the yard for up to 20 days. These accounted for just 0.21% of the total, or six units, and occurred in June and November.
According to graphic shown in Figure 6, the majority of 6,398 domestic 40 ft food containers in 2023 remained in storage for fewer than four days. In total, 63.15 percent were cleared from the yard within this period: 13.24% within first day, 16.46% within second day, 17.76% within third day, and 15.70% within fourth day.
After the fourth days, the proportion of containers stayed in the yard decreased. Approximately 11.44% stayed until the fifth day, and 9.36% until the sixth day. The percentage continued to decrease, with only 5.55% staying up to seven days and less than 2% stayed after nine days. Only three containers, representing 0.05% of the total, stayed as long as 16 days, occurring in March and September.


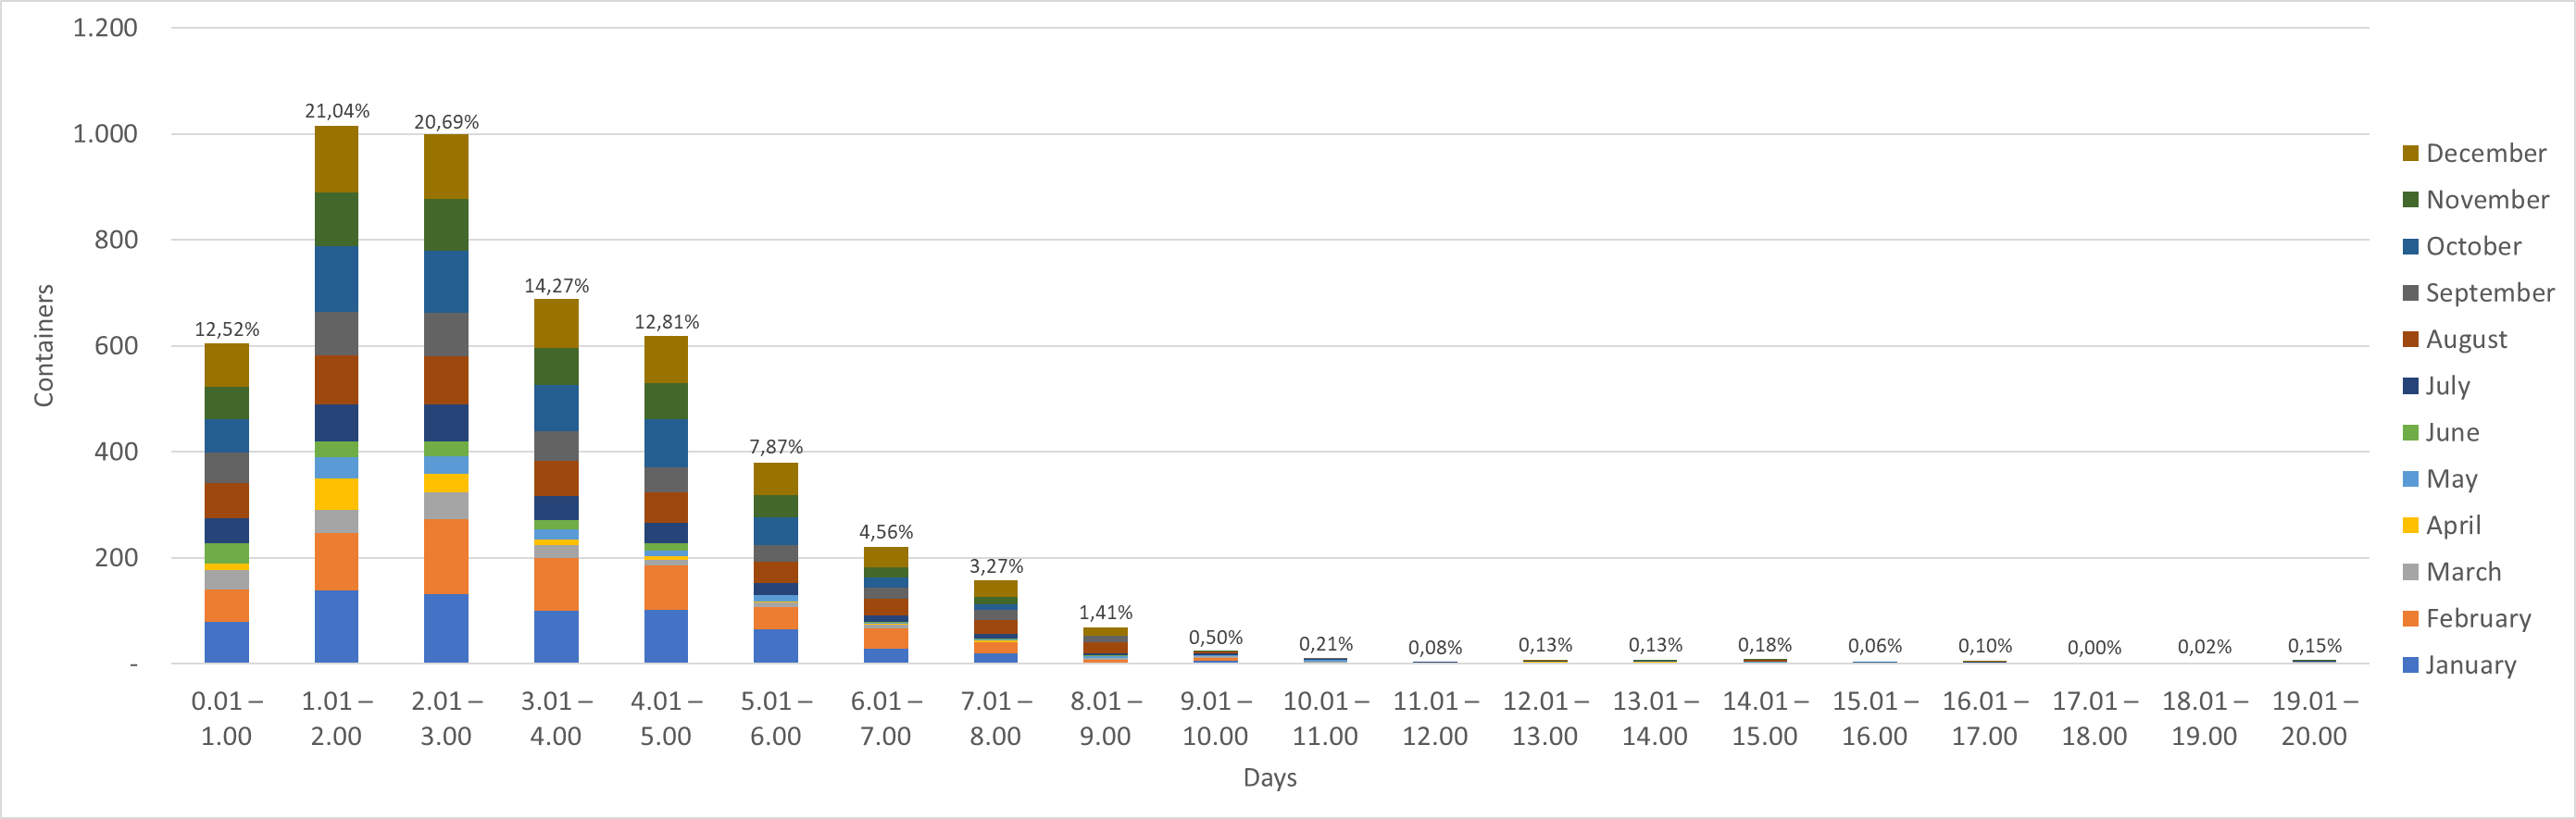
Based on Figure 7, the dwell time distribution for 40 FT domestic containers carrying industrial goods from January to December 2023 shows that more than half of the total 4,826 containers (54.25%) cleared the port within three days. Specifically, 12.52% were cleared after one day, 21.04% after two days, and 20.69% after three days.
The data also indicate that 45.75% of containers stayed in the yard for more than three days. Between the fourth and seventh days, the proportion were still relatively high at 14.27%, 12.81%, 7.87%, and 4.56% respectively. After the first week, the number of containers stayed in the yard dropped, with only 3.27% staying up to eight days and less than 2% remaining beyond the ninth day. A small number of containers experienced dwell times of up to 20 days, accounting for just 0.15% (seven units), recorded in March, June, July, and November.
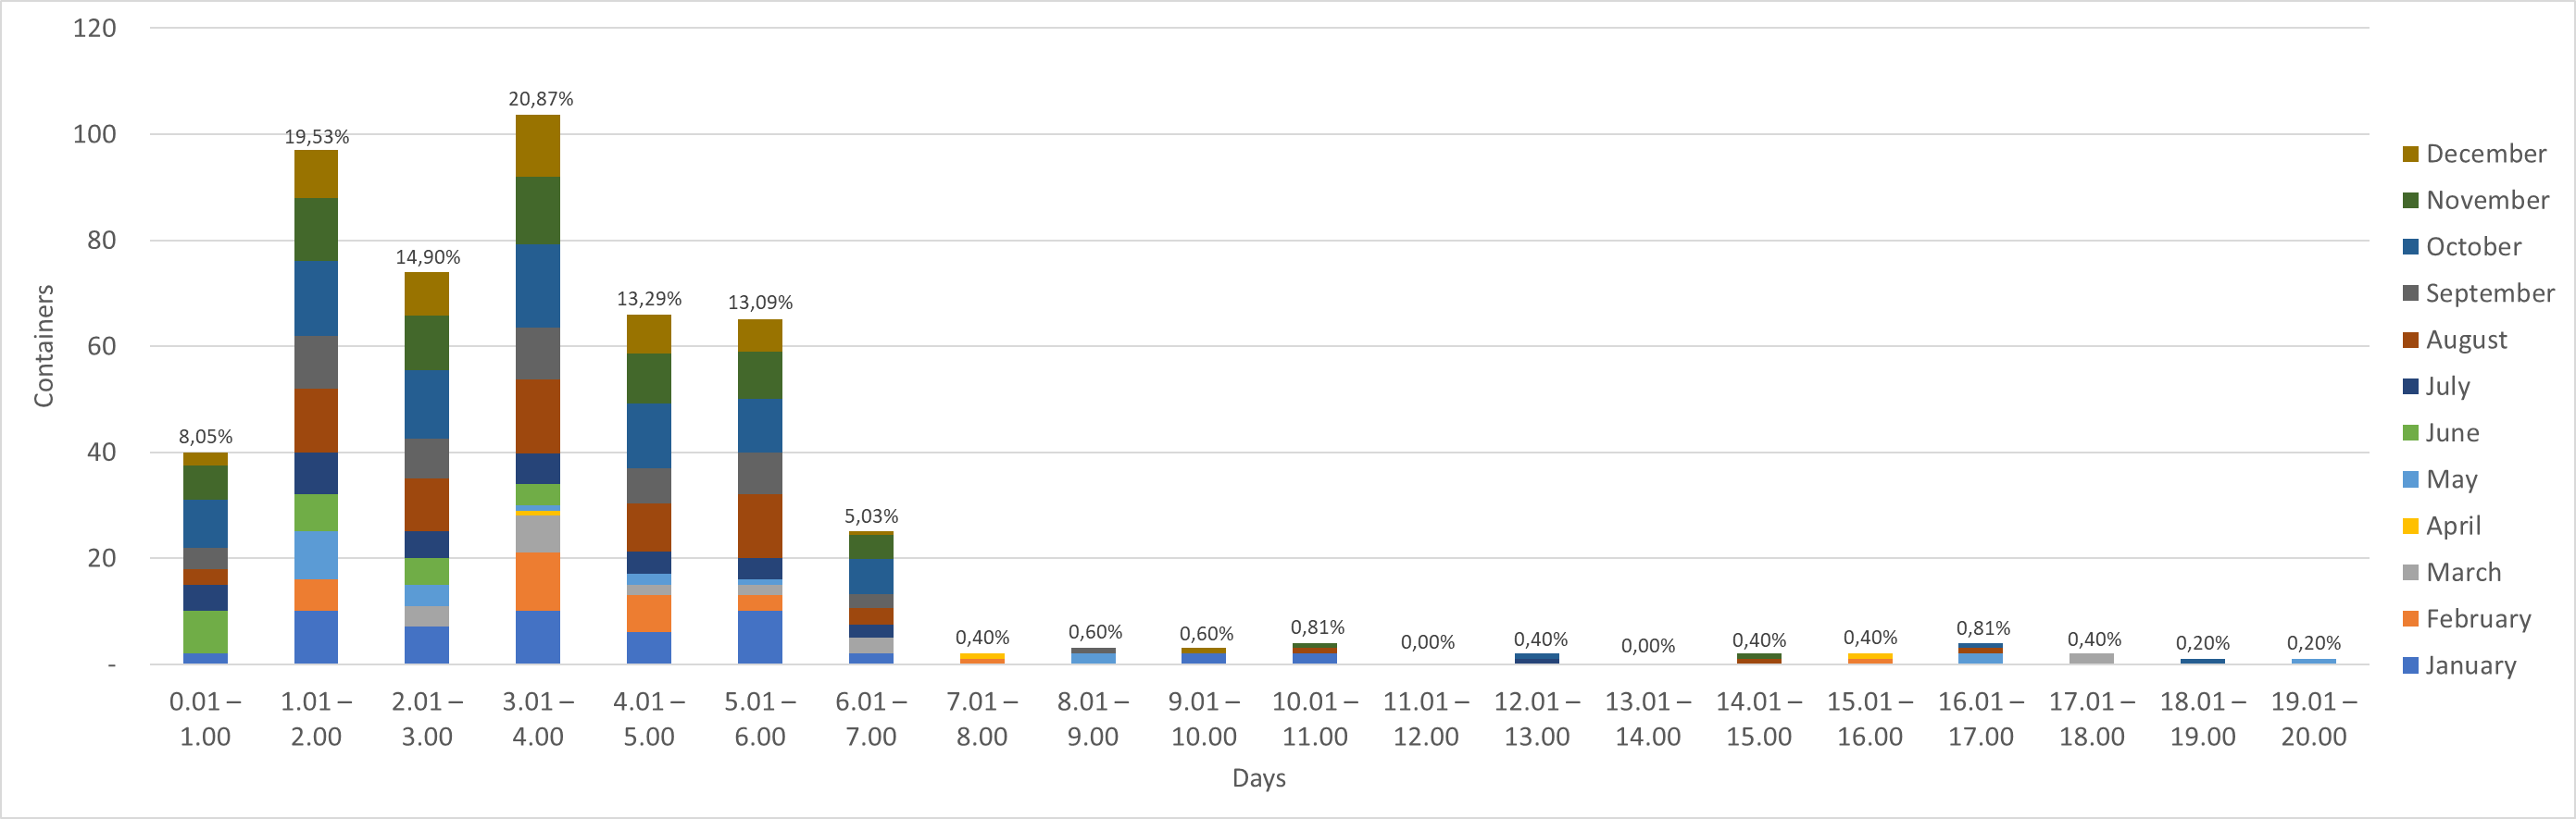
Based on Figure 8, The analysis of dwell time distribution for 40 ft domestic containers carrying building materials in 2023 shows that, out of a total of 497 recorded units, 63.36% cleared from the yard before exceeding four days. Specifically, 8.05% were cleared within one day, 19.53% within two days, 14.90% within three days, and 20.87% within four days.
After four days, the pattern changes. About 36.64% of containers stayed longer than four days, with 13.29% staying up to five days and 13.09% up to six days. A small number of outliers were observed, including one container that stayed for 20 days in May, representing 0.20% of the total.
Reviewing six charts on container dwell times in the stacking yard from January to December 2023 shows clear patterns in domestic cargo flow. Most containers were stayed for only a short time. More than half were cleared within three to four days, with rates ranging from 54% to 64%, depending on commodity type and container size. This cases is efficient in the early stages, especially for food and building materials that need to move quickly to keep quality and supply chains running smoothly.
After the first few days, the number of containers in the yard drops sharply. By the fourth or fifth day, more than half have cleared, and by the ninth day, less than 2% remain. This shows that most cargo is released quickly and that prolonged stays are uncommon. However, a noticeable slowdown occurs between days four and seven across all cargo types, suggesting potential bottlenecks such as paperwork delays, late pickups, or downstream supply chain issues.
A notable contrast is observed between containers that exit the port quickly and those that remain for extended periods. While more than half cleared from the yard within three to four days, the proportion of containers staying beyond seven days consistently remains below 10%. This disparity highlights an efficiency gap that warrants attention in operational planning. Only a very small number of containers less than 0.2% remain for 16 to 20 days, but they can affect average dwell times and may signal specific problems in the system improvement strategies whether in logistics management, cargo flow regulation, or broader port service policies.
policies.
3.3. ANOVA Three-Way
A three-way ANOVA was conducted using SPSS 27 to examine the effects of sector, container size, commodity type, and their interactions on average monthly dwelling time. From the Table 5, it can be seen that the average value differs depending on the sector, commodity and container size, in the import sector the average value has a range of 5.53 – 7.91, in the domestic sector it has a range of average values ranging from 2.68 – 4.72. The highest value in the import sector is seen in the industry goods commodity for 20 ft containers at 7.91, standard deviation 1.45, this shows little variation in dwelling time, while for the domestic sector is from food goods for 20 ft at 4.72, standard deviation 2,12. From the same number of samples in each group of import/domestic (N = 72), food/industry/building (N = 24), and 20 ft/40 ft containers (N = 12).
Assumption tests for the Three-Factor ANOVA were conducted to verify the statistical validity of the model. First, the Shapiro–Wilk test was applied to examine the normality of residuals. The results (W = 0.952, p = 5.54 × 10⁻¹¹) indicated that the residuals did not follow a perfect normal distribution, with p-values well below the 0.05 significance threshold. This suggests the presence of skewness or outliers within the data, which is not unusual in operational port studies where handling times are often influenced by irregular events such as administrative delays or equipment breakdowns.
Second, the Levene’s test was used to assess the homogeneity of variance across groups. The test result (F = 2.81, p = 0.495) indicated that variances were statistically equal among the factor levels (service sector, container size, and commodity type). This outcome is important, as homogeneity of variance is considered a more critical assumption for the robustness of ANOVA compared to strict normality, especially when the design is balanced with similar group sizes.
Although the assumption of normality was not fully satisfied, the violation is considered acceptable given the large sample size (n > 100) in this study. According to Blanca et al26), ANOVA remains a valid and reliable method even under moderate deviations from normality, provided that group variances are homogeneous and the sample sizes are sufficiently large. This robustness is further supported by the central limit theorem, which ensures that sampling distributions of the mean tend toward normality as sample size increases.
Therefore, despite the departure from normality, the combination of a large dataset, homogeneity of variance, and balanced group designs justifies the continued use of ANOVA in this research. The results are considered statistically sound and can be confidently interpreted for decision-making in the context of port operational management and policy formulation regarding dwelling time reduction strategies.
Table 5: Descriptive Analysis of Factors Affecting Dwelling Time Dependent Variable: DT
| SCT | CMD | SIZE | Mean | Std. Deviation | N |
|---|---|---|---|---|---|
| Import | Food Goods | 20FT | 4.7233 | 2.11488 | 12 |
| 40FT | 3.7542 | 1.95710 | 12 | ||
| Total | 4.2388 | 2.05329 | 24 | ||
| Industry Goods | 20FT | 4.2300 | 1.97247 | 12 | |
| 40FT | 2.6783 | 0.87256 | 12 | ||
| Total | 3.4542 | 1.68907 | 24 | ||
| Building Goods | 20FT | 4.7225 | 2.07147 | 12 | |
| 40FT | 3.7542 | 1.48384 | 12 | ||
| Total | 4.2383 | 1.83026 | 24 | ||
| Total | 20FT | 4.5586 | 2.00813 | 36 | |
| 40FT | 3.3956 | 1.54907 | 36 | ||
| Total | 3.9771 | 1.87450 | 72 | ||
| Domestic | Food Goods | 20FT | 7.3133 | 2.08140 | 12 |
| 40FT | 5.5342 | 2.16914 | 12 | ||
| Total | 6.4238 | 2.26892 | 24 | ||
| Industry Goods | 20FT | 7.9075 | 1.44668 | 12 | |
| 40FT | 6.3892 | 1.73055 | 12 | ||
| Total | 7.1483 | 1.74202 | 24 | ||
| Building Goods | 20FT | 7.3142 | 1.00638 | 12 | |
| 40FT | 5.5333 | 2.46756 | 12 | ||
| Total | 6.4238 | 2.05518 | 24 | ||
| Total | 20FT | 7.5117 | 1.55506 | 36 | |
| 40FT | 5.8189 | 2.12153 | 36 | ||
| Total | 6.6653 | 2.03403 | 72 | ||
| Total | Food Goods | 20FT | 6.0183 | 2.44152 | 24 |
| 40FT | 4.6442 | 2.21556 | 24 | ||
| Total | 5.3312 | 2.40860 | 48 | ||
| Industry Goods | 20FT | 6.0688 | 2.52778 | 24 | |
| 40FT | 4.5337 | 2.32135 | 24 | ||
| Total | 5.3013 | 2.52299 | 48 | ||
| Building Goods | 20FT | 6.0183 | 2.07094 | 24 | |
| 40FT | 4.6438 | 2.18880 | 24 | ||
| Total | 5.3310 | 2.21938 | 48 | ||
| Total | 20FT | 6.0351 | 2.32184 | 72 | |
| 40FT | 4.6072 | 2.21144 | 72 | ||
| Total | 5.3212 | 2.37023 | 144 |
Table 6: Anova Table of Factors Affecting Dwelling Time Dependent Variable: DT
| Source | Type III Sum of Squares | df | Mean Square | F | Sig. | Partial Eta Squared |
|---|---|---|---|---|---|---|
| Corrected Model | 355.955a | 11 | 32.360 | 9.547 | .000 | .443 |
| Intercept | 4077.355 | 1 | 4077.355 | 1202.942 | .000 | .901 |
| SCT | 260.150 | 1 | 260.150 | 76.751 | .000 | .368 |
| CMD | .029 | 1 | .014 | .004 | .996 | .000 |
| SIZE | 73.402 | 1 | 73.402 | 21.655 | .000 | .141 |
| SCT * CMD | 18.216 | 2 | 9.108 | 2.687 | .072 | .039 |
| SCT * SIZE | 2.525 | 1 | 2.525 | .745 | .390 | .006 |
| CMD * SIZE | .206 | 2 | .103 | .030 | .970 | .000 |
| SCT * CMD * SIZE | 1.427 | 2 | .713 | .210 | .810 | .003 |
| Error | 447.419 | 132 | 3.390 | |||
| Total | 4880.728 | 144 | ||||
| Corrected Total | 803.374 | 143 | ||||
a.R Squared=443 (Adjusted R Squared= .397)
The results of the three-factor ANOVA test show that at Table 6 is the sector factor has a significant effect on dwelling time, F(1,132)=76.75, p<.001, η²p=.368. This confirms that the difference between the import and domestic sectors contributes significantly to the variation in dwelling time. Specifically, domestic containers consistently showed longer dwell times with higher delay intensity compared to import containers, reflecting a structural disparity between the two sectors.
The second factor KMD (Commodity) is slightly different from the previous results where KMD did not have a significant effect on Dwelling Time, with F = 0.04 and Sig. (0.996) greater than the 5% significance level. These results indicate that there is no difference between Food Goods, Industrial Goods and Building Goods Commodities in terms of average waiting time. From the average seen previously, there is no clear difference between the commodities analyzed.
The analysis also shows that container size has a significant effect on dwelling time, F(1,132)=21.65, p<.001, η²p=.141. These results indicate that the difference between 20 FT and 40 FT containers contributes significantly to the variation in dwelling time. Specifically, 20 FT containers consistently experience longer dwell times with higher delay intensity compared to 40 FT containers, confirming that container size is an important factor in determining operational efficiency.
In addition to the main influence of each factor, the test results show no significant interaction in the sector to commodity, sector to container size, commodity to container size and between Sector, Commodity, and Container Size each has a Sig. value above 5%. This indicates that variations in dwelling time do not depend on changes in sector, commodity type, or container size. In other words, the combined influence of these three factors is not evident when viewed through the monthly average dwelling-time data.
4. Discussion
This study analyzes the factors affecting dwelling time at New Makassar 1 Container Terminal, focusing on the differences between the domestic and import sectors, container size, and commodity type. The findings enhance understanding of the terminal’s operational dynamics and highlight several opportunities for improving process efficiency.
4.1. Differences Between Domestic and Import sectors
The statistical results (p < 0.05) indicates that the sector plays a crucial role in influencing container dwelling time. Descriptive analysis shows that domestic containers have a substantially longer average dwell time of 6.67 days, compared with 3.98 days for import containers. The extended dwelling time of domestic containers is primarily driven by the high volume of domestic cargo, which places substantial pressure on yard capacity and slows down the overall container movement cycle. These findings support the argument that Nguyen28) argument that strengthening governance mechanisms, improving regulatory efficiency, and investing in logistics infrastructure are critical to enhancing logistics competitiveness. From an operational perspective, the results highlight the need for yard management strategies that can better adapt to fluctuations in domestic cargo flows. From a policy standpoint, they emphasize the importance of stronger coordination among domestic stakeholders to help prevent yard congestion.
Several studies have also highlighted similar findings, such as Sirajudin29) emphasized that one of the strategies to reduce dwelling time is by deregulating administrative procedures. Theoretically, this is in line with the concept Institutional Bottlenecks, Rahayu et.al 30) mentioning that Most challenges in the maritime transport sector stem not from physical constraints, but from the lack of coordination and fragmented institutional arrangements in governance. Gordon et al31) also emphasizes that weaknesses in institutional arrangements have the potential to disrupt the necessary consistency between economic conditions, governance structures, and port development strategies.
Tongzon32) in the study of logistics in Southeast Asia highlighted significant variations in domestic cargo handling efficiency between countries. The study pointed out that differences in domestic regulation and the structure of the logistics market play a substantial role in influencing cargo handling efficiency.
4.2. Influence of Container Size
The analysis shows that 20 ft containers have longer handling times than 40 ft containers, which is unexpected given their smaller size. Kutin et al33), in their evaluation of 50 ASEAN container ports, highlight that differences in shipment frequency, cargo flow characteristics, and terminal-specific operating conditions contribute significantly to efficiency gaps among container types.
Containers in the bottom tier often require re handling because they are stacked two to three tiers high, adding time and effort to delivery. Therefore, when 20 ft containers are positioned in the bottom tier, it require longer handling time compared to 40 ft containers placed in the same position. In this context, improving the efficiency of container loading arrangements should involve consideration not only of the disassembling process but also of the assembling stage34).
The implication is that optimization must focus on 20 FT, through yard allocation strategies, special scheduling, and equipment adjustments. These findings also indicate that operational complexity at the container level can be as influential as commodity-based factors in determining dwelling time.
4.3. Effect of Commodity Type
The absence of significant differences in handling times between food goods, industrial goods, and building goods commodities suggests a good level of standardization in terminal operational procedures. This pattern is consistent with broader findings in port performance literature indicating that standardized and streamlined handling processes generally improve terminal efficiency and service predictability35). However, the same literature also emphasizes that some degree of operational flexibility is required to accommodate cargo-specific needs and contextual variations
From a practical perspective, the implication is that terminal operators need to maintain standardized procedures as the basis for efficiency, while still preparing adaptive mechanisms for specific conditions, such as flexibility in allocating stacking yards or scheduling for commodities with high demand during peak seasons. Conceptually, these findings confirm that commodity based differences have less influence than institutional factors and operational complexity at the container level, so that efforts to improve efficiency should focus more on governance reform and container handling strategies than on differentiation based on commodity type.
These findings also carry broader implications that extend beyond the specific context of Makassar Port, offering alternative strategies for improving port efficiency on a global scale. The two significant factors that influence dwelling time at Makassar Port are sector and container size, which reflect similar challenges that are likely faced by many ports, particularly in developing countries. Although the literature directly linking these two factors to the global context remains limited, the results of this study expand current insights into port efficiency enhancement strategies and provide a foundation for future research. Such studies could further investigate how container flow management, based on shipment category and variations in container size, can be optimized to support smoother supply chain operations and strengthen international maritime connectivity.
5. Conclusion
The sector and container size are significant factors influencing dwelling time at New Makassar 1 Container Terminal. This finding confirms that 20 ft containers are more prone to longer dwelling times due to higher cargo volumes and more frequent re handling operations. These conditions highlight the importance of implementing more targeted operational strategies to address delays and improve overall terminal performance.
Practically, the findings suggest that terminal operators should implement adaptive yard-allocation strategies and prioritize efforts to minimize re-handling, particularly for 20 ft containers. Strengthening coordination among domestic stakeholders is also essential, especially at operational points where inefficiencies most commonly arise. Improved collaboration across actors within the logistics chain can help smooth container flows and reduce congestion within the terminal.
Futhermore, the adoption more efficient processes, such as digitalization, can serve as a strategic step to optimize terminal operations. Digital technologies enable real-time monitoring and faster decision-making, which in turn help reduce dwelling times and enhance overall operational efficiency.
References
- J. Verschuur, E.E. Koks, and J.W. Hall, “Ports’ criticality in international trade and global supply-chains,” Nat. Commun., 13 (1) 1–13 (2022). doi:10.1038/s41467-022-32070-0.
- M.H. Huzaifi, M.A. Budiyanto, and S.J. Sirait, “Study on the carbon emission evaluation in a container port based on energy consumption data,” Evergreen, 7 (1) 97–103 (2020). doi:10.5109/2740964.
- N.M.R. Fuadi, Iskendar, D.H. Waskito, C. Sasmito, N.I. Gutami, A.R. Ispandiari, N. Yustina, Z. Qonita, A. Roschyntawati, and R. Saputra, “Integration between photovoltaic arrays, port energy requirements, and pilot boats to achieve net zero emission: a case study of the port of lembar,” Evergreen, 11 (4) 3457–3469 (2024). doi:10.5109/7326982.
- Z.H. Munim, and H.-J. Schramm, “The impacts of port infrastructure and logistics performance on economic growth: the mediating role of seaborne trade,” J. Shipp. Trade, 3 (1) 1–19 (2018). doi:10.1186/s41072-018-0027-0.
- N. Firdausiyah, F.R. Sutikno, and A.A. Ratri, “Evaluating Environmental Impacts Of Green Logistics Initiatives In Batam Indonesia,” Evergreen, 11 (2) 1081–1088 (2024). doi:10.5109/7183408.
- M. Saini, and T. Lerher, “Assessing the Factors Impacting Shipping Container Dwell Time: a Multi-Port Optimization Study,” (2024). doi:10.3846/btp.2024.19205.
- Government of Indonesia, “Government Regulation No. 20 of 2010 concerning Water Transportation,” Jakarta, (2010).
- H. Anggraeni, D. Wardhana, , D. Wardhana, and D. Hadi Kushendar, “Dwelling time and its impact on logistics costs and competitiveness: challenges and policy solutions in Indonesia,” Indones. J. Soc. Sci. Res., 2025 (1) 262–270 (2025). doi:10.11594/ijssr.06.01.28.
- G. Raballand, S. Refas, M. Beuran, and G. Isik, “Economic Premise: Why Cargo Dwell Time Matters in Trade,” (2012).
- Government of Indonesia, “Regulation of the Minister of Transportation of the Republic of Indonesia Number PM 116 of 2016 concerning the Transfer of Goods that Exceed the Stacking Time Limit (long stay). The four ports are Tanjung Priok Port - Jakarta, Tanjung Perak Port - Surabaya, Belawan Port - Medan, and Makassar Port.,” (2016).
- Z.Y. Idris, G. Sitepu, Misliah, and Indrabayu, “Optimizing Dwelling Time at the New Makassar 1 Container Terminal in Supporting the Regional Development of South Sulawesi,” in: Proc. 3rd Int. Conf. Marit. Dev. (ICMMAD 2023), Atlantis Press, 2024: pp. 217–232. doi:10.2991/978-94-6463-628-4_23.
- I. Imamuddin, “The significance of makassar port in the context of cargo containers and passenger traffic: a literature review,” Migr. Latter, 20 (8) 145–156 (2023). doi:10.59670/ml.v20i8.5229.
- J.L. Tongzon, “The challenge of hub port competition: the case of singapore,” Transp. Res. Part A Policy Pract., 46 (6) 1089–1103 (2012). doi:10.1016/j.tra.2012.04.001.
- T. Lam, J. S. L.Notteboom, “The greening of ports: a comparison of port management tools used by leading ports in asia and europe,” Transp. Rev., 34 (2) 169–189 (2014). doi:10.1080/01441647.2014.891162.
- K. Brooks, M. R. Cullinane, “Governance models defined,” Res. Transp. Bus. Manag., 22 1–2 (2017). doi:10.1016/S0739-8859(06)17018-3.
- S. Haryani, I.W. Agustin, F. Usman, W.O.S. Tunnaja, and J. Hiddlestone-Mumford, “Development of a ferry port in bajoe village to support tourism on bokori island, southeast sulawesi, based on the linkage system,” Evergreen, 11 (2) 1103–1115 (2024). doi:10.5109/7183412.
- A.D. Bank, “Digital Trade Facilitation in Asia and the Pacific,” ADB Publishing, Manila, (2019).
- S. Heilig, L. Lalla-Ruiz, E. Voß, “Digital transformation in maritime ports: analysis and a game theoretic framework,” NETNOMICS Econ. Res. Electron. Netw., 18 (2–3) 227–254 (2017). doi:10.1007/s11066-017-9120-1.
- J.P. Notteboom, T. Pallis, A. Rodrigue, “Disruptions and resilience in global container shipping and ports: the covid-19 pandemic versus the 2008–2009 financial crisis,” Marit. Econ. Logist., 23 (2) 179–210 (2021).
- K. Wang and C. Cullinane, “Traffic consolidation in east asian container ports: a network flow analysis,” Transp. Res. Part A Policy Pract., 61 152–163 (2016). doi:10.1016/j.tra.2013.12.002.
- D.F.R. Wardana, and I Gede Made Artha Dharmakarja, “A study of dwelling time at tanjung perak harbor surabaya indonesia,” J. Perspekt. Bea Dan Cukai, 8 (1) 55–71 (2024).
- W. Li, O.P. Hilmola, and Y. Panova, “Container sea ports and dry ports: future co2 emission reduction potential in china,” Sustain., 11 (6) (2019). doi:10.3390/su11061515.
- A.R. Sunitiyoso, Y., Nuraeni, S., Pambudi, N. F., Inayati, T., Nurdayat, I. F., Hadiansyah, F., & Tiara, “Port performance factors and their interactions: a systems thinking approach,” Asian J. Shipp. Logist., 38 (2) 107–123 (2022). doi:https://doi.org/10.1016/j.ajsl.2022.04.001. [DOI]
- M. Heikkilä, and J. Saarni, “Innovation in smart ports : future directions of digitalization in container ports,” (2022). doi:https://doi.org/10.3390/jmse10121925. [DOI]
- S. Santoso, R. Nurhidayat, and G. Mahmud, “Measuring the total logistics costs at the macro level : a study of indonesia,” (2024). doi:https://doi.org/10.3390/logistics5040068. [DOI]
- M.J. Blanca, R. Alarcón, J. Arnau, R. Bono, and R. Bendayan, “Non-normal data: Is ANOVA a valid option?,” Psicothema, 29 (4) 552–557 (2017). doi:10.7334/psicothema2016.383.
- N. Nisrina, M.I. Kemal, I.A. Akbar, and T. Widianti, “The effect of genetic algorithm parameters tuning for route optimization in travelling salesman problem through general full factorial design analysis,” Evergreen, 9 (1) 163–203 (2022). doi:10.5109/4774233.
- N.T. Thu Hien, “Examining the influence of governance quality and institutional policies on logistics growth in vietnam,” Int. J. Multidiscip. Res. Anal., 08 (05) 2686–2693 (2025). doi:10.47191/ijmra/v8-i05-47.
- Sirajuddin, “Five-key strategies for reducing indonesia ports’ dwelling time,” J. Tek. Ind., 22 (2) (2020). doi:10.9744/jti.22.2.Five-k.
- L. Rahayu, T. Busscher, T. Tillema, and J. Woltjer, “Maritime transport governance challenges in the global south,” Mar. Policy, 163 (January) 106147 (2024). doi:10.1016/j.marpol.2024.106147.
- G. Wilmsmeier, A.A. Pallis, S.L. Schorch, and D.L. Trujillo, “Port governance and the implications of institutional fragmentation: lessons from colombia,” Res. Transp. Bus. Manag., 56 (July 2023) (2024). doi:10.1016/j.rtbm.2024.101179.
- J.L. Tongzon, “Regulatory Challenges in the Philippine Logistics Industry,” 2018. https://pidswebs.pids.gov.ph/CDN/PUBLICATIONS/pidspn1801.pdf.
- N. Kutin, T.T. Nguyen, and T. Vallée, “Relative efficiencies of asean container ports based on data envelopment analysis,” Asian J. Shipp. Logist., 33 (2) 67–77 (2017). doi:10.1016/j.ajsl.2017.06.004.
- V. Kovalenko, O. Turchyn, V. Alieksieiev, V. Stryzhak, M. Strelkov, and O. Poliakov, “Improving the energy efficiency of container stack assembly-disassembly operations at container terminal yard,” Bull. Natl. Tech. Univ. «KhPI». Ser. Automob. Tract. Constr., (2) 22–34 (2024). doi:10.20998/2078-6840.2024.2.03.
- A.F. Parola, M. Risitano, M. Ferretti, E. Panetti, and M. Ferretti, “The drivers of port competitiveness: a critical review,” Port Econ., 37 (1) 1–23 (2016). doi:10.1080/01441647.2016.1231232.