
Abstract
This study investigates the application of caudal foundations inspired by snake locomotion to improve lateral stress distribution and enhance soil-structure interaction in pile foundations. This study presents a bioinspired snakeskin-inspired caudal pile geometry that contextually modifies the lateral earth pressure coefficient (K) and skin resistance (Q_s) terms within the classical Meyerhof pile bearing capacity framework. Laboratory tests were conducted on four steel pile models with a diameter of 10 mm: one smooth pile (plain model) and three caudal designs with varying L/H ratios of 20, 26.67, and 33.33. A small-scale automated loading press, equipped with a stepper motor and a continuous stress-strain recording system, ensured precise real-time data acquisition during the tests. Results indicated that the caudal foundation with an L/H ratio of 20 achieved the highest improvement in skin resistance (Q_s = 0.0280 kN) and lateral earth pressure coefficient (K = 3.94) compared to the smooth pile. These findings confirm a direct correlation between L/H ratio and lateral stress distribution, offering theoretical insights into bioinspired foundation designs and practical recommendations for optimizing foundation performance under diverse geotechnical conditions. Future research is suggested to examine the role of pile diameter and other geometric parameters in validating these trends.
Keywords: L/H ratio, caudal foundation, coefficient of lateral earth, Meyerhof equation, skin resistance
Outline
1. Introduction
The term "caudal," commonly used in anatomy to describe a position relative to an animal's body, is adopted in this study to conceptualize a bioinspired foundation design. Pile foundations frequently encounter challenges in distributing lateral pressures effectively, resulting in inefficiencies in load transfer mechanisms1). Inspired by the locomotion principles of snakes, this study proposes a caudal foundation design that mimics anisotropic frictional behavior to enhance soil-structure interaction2). The unique shape and rigidity of snake scales enable the mobilization of higher frictional forces3), providing insights for improving foundation performance4).
Understanding and applying bioinspired mechanisms can lead to more efficient and sustainable engineering solutions5–7), while also offering new insights into addressing modern geotechnical challenges8–11). Previous studies emphasize the importance of surface roughness in influencing shear strength at the interface between steel and soil12). Engineered textured surfaces with structured roughness have been shown to mobilize higher friction angles compared to randomly rough surfaces13). For instance, textured pile foundations can increase the friction angle up to 50% compared to smooth surfaces in sand. A clear relationship exists between the ratio and normalized surface roughness (): in uniform sand, an value of 0,01 corresponds to a ratio of 0,7, whereas a () value of 0,06 corresponds to a ratio of 1,214). These findings highlight the potential of tailored surface roughness in improving the performance of pile foundations in sandy soils.
Using caudal designs in small-scale tests on 10 mm diameter steel piles with an ratio of 40 in Ottawa F65 sand demonstrated a 780% improvement in load-bearing capacity compared to smooth piles, with a relative capacity increase of 340% for caudal piles15). DEM analysis of 40 mm diameter piles revealed that caudal installation with an ratio of 6.25 produced a pore resistance of 2.5 kN, while an ratio of 4.16 resulted in a resistance of 3.7 kN. Conversely, caudal foundations with an ratio of 6.25 achieved a lower pore resistance of 2.0 kN under similar conditions16). These findings highlight the influence of ratios and installation methods on the performance of bioinspired pile foundations in granular soils.
Bioinspired design provides a systematic approach to translating biological mechanisms into engineering solutions, particularly where conventional designs show efficiency limitations. In granular soils, load transfer along pile foundations is mainly controlled by frictional interaction and lateral stress mobilization, both of which depend strongly on surface geometry. Inspired by the anisotropic friction behavior of snake caudal scales, caudal-inspired pile surfaces are hypothesized to modify lateral earth pressure distribution and enhance skin resistance, directly linking this concept to classical bearing capacity formulations.
The bearing capacity of pile foundations in sandy soils is governed by the combined contribution of point resistance and skin resistance, both of which are influenced by soil strength and stress distribution. The internal friction angle () represents the shear strength of granular soils and directly controls the magnitude of bearing capacity factors, which increase nonlinearly with increasing . Skin resistance () arises from frictional interaction along the pile–soil interface and is governed by the effective vertical stress, interface friction angle, and the coefficient of lateral earth pressure (). The parameter K defines the ratio between lateral and vertical stresses acting on the pile shaft and plays a critical role in mobilizing frictional resistance, particularly for piles with modified surface geometries.
The bearing capacity of pile foundations is derived from the plastic behavior of materials under load17) and governed by differential equations18). The ultimate bearing capacity () is expressed as the sum of the pile's point resistance () and skin resistance ()19–21). Several factors influence this equation, including pile size (), depth of the loaded area (), and the bearing capacity factor (), which varies depending on the soil's internal friction angle (). For instance, ranges from 1 to 81.27 for values between 0° and 40°22), from 1 to 392.8 for values between 0° and 50°23), and from 12.4 to 930 for values between 20° and 45°24).
In the skin resistance () component, the coefficient serves as a correction factor representing the redistribution of vertical stress into lateral stress acting on the pile shaft. This coefficient relates to the soil's internal friction angle using the formula , with values such as = 0.8525), = 0.2926), ranging from 0.39 to 0.527), = 0.45 for values between 33° and 43°28), = 0.38 for = 38.5°29), 30), and 31). This variability highlights the importance of K in accurately predicting pile skin resistance and overall bearing capacity.
The skin resistance () of a pile foundation is influenced by the frictional interaction between the foundation surface and the surrounding soil, which is largely governed by the soil's lateral pressure32,33). The coefficient of lateral earth pressure () represents the ratio of lateral to vertical stress. It plays a critical role in determining the distribution of lateral stress along the depth of the foundation24). Key parameters include the effective vertical stress (), the friction angle between the soil and the foundation surface (δ), and the surface area of the pile in contact with the soil ()25). The value of is highly dependent on soil conditions, such as density and type. In dense sandy soils, often approaches , the coefficient of earth pressure at rest, which reflects an improved distribution of lateral stress and enhances soil-structure interaction26).
The caudal concept has been24), adopted to develop an empirical bearing capacity equation for the design of more efficient and stable foundations34,35). To achieve this, the equation must be adapted to integrate the bioinspired caudal movement concept, inspired by snake locomotion. This research builds on previous findings, focusing on the adaptation of snake movements and their application in modern foundation design.
Recent studies have increasingly explored bio-inspired surface geometries to enhance soil–structure interaction, particularly through anisotropic friction mechanisms and textured pile interfaces in granular soils. Experimental investigations have demonstrated that modified pile surface geometries can significantly influence lateral stress development and skin resistance. However, most existing studies predominantly focus on large-scale piles or installation-induced effects, with limited experimental attention given to small-diameter steel piles and the explicit relationship between caudal asperity ratio, lateral earth pressure coefficient (), and skin resistance () under controlled laboratory conditions. Therefore, this study aims to experimentally evaluate the influence of caudal asperity ratio on pile skin resistance and lateral earth pressure mobilization in sandy soil, assess the statistical significance of these effects using analysis of variance (ANOVA), and examine the applicability of Meyerhof’s bearing capacity framework for bio-inspired caudal pile surfaces.
2. Methodology
2.1. Materials and Tools
The material used in this study is Brantas sand (Table 1),

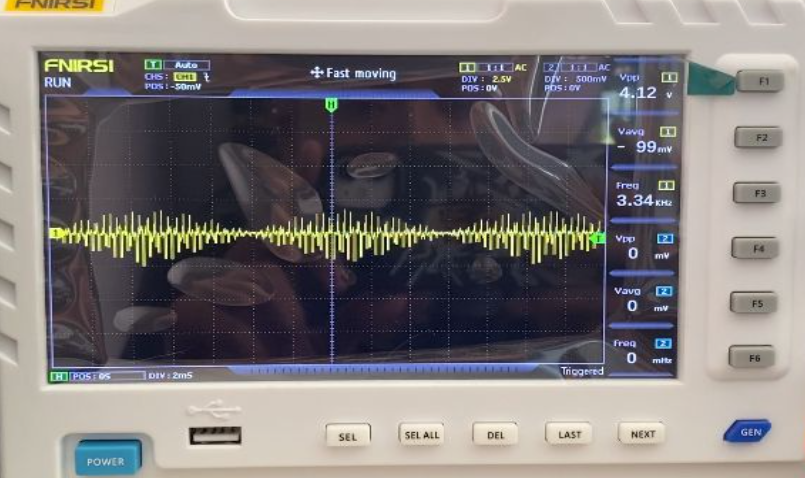
with its particle size distribution illustrated in Figure 1. The sand was characterized by its controlled particle size distribution, high density, and dry conditions, which were consistently monitored throughout the experiments. As shown in Figure 2, the target dry unit weight of 16.7 kN/m³ was achieved using a vibrating table (Figure 3a) operating at a frequency of 3.34 kHz for 48 seconds (Figure 3b).
Shear strength parameters were obtained through Automatic Direct Shear Tests, with the shear angle measured and recorded using a data logger (Figure 4). A custom-built compression machine equipped with real- time data logging capabilities was employed to conduct pile load tests. Sand compaction was carried out using a vibrating table to ensure uniform density. The selected asperity ratios (20, 26.67, and 33.33) were chosen to represent low, medium, and high surface modulation while maintaining manufacturability at small scale. A pile diameter of 10 mm was adopted to ensure uniform stress distribution and compatibility with the laboratory test box dimensions, while an embedment depth of 240 mm was selected to minimize boundary effects and allow full mobilization of shaft resistance (Figure 5).

Table 1: Brantas Sand Properties
| Properties | Value |
|---|---|
| Sand Type | SP |
| (%) | 70 |
| Dry unit weight (γt) [kN/m³] | 16.69 |
| Coefficient of curvature Cc | 3.42 |
| Uniformity coefficient Cu | 0.96 |
| Average particle size [mm] | 0.40 |
| Void ratio () | 0.71 |
| Maximum void ratio | 0.91 |
| Minimum void ratio | 0.62 |
| Porosity (%) | 38.24 |
| Specific Gravity () | 2.76 |
| Friction angle φ [°] | 30 |





2.2. Design Experiment
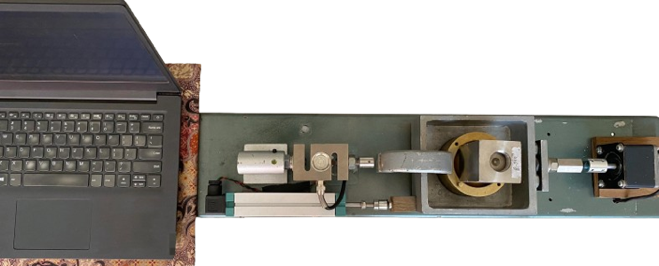
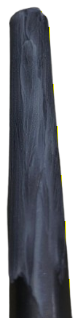
Steel piles with a diameter of 10 mm and a length of 300 mm were prepared in two configurations: smooth piles and tail piles with varying 𝐿/𝐻 ratios. These piles were tested under controlled conditions to a depth of 240 mm. As a control, the smooth piles (Figure 5a) were tested first using an automatic compression machine (Figure 6). The tests were conducted with Brantas Sand (Table 1), contained in a test box measuring 350 × 350 mm with a height of 500 mm (Figure 3a). Each test configuration was conducted under identical sand preparation procedures, including controlled dry unit weight, consistent pouring method, and fixed vibration duration. This approach was adopted to ensure repeatability of test results and to minimize experimental bias associated with soil density variation. Pressure data and settlement distribution were recorded using a data logger. Subsequently, the caudal pile foundations (Figures. 5b, 5c, and 5d) were subjected to identical testing conditions. These tests aimed to evaluate the influence of varying 𝐿/𝐻 ratios on the bearing capacity and settlement behavior of the caudal piles compared to the smooth piles.

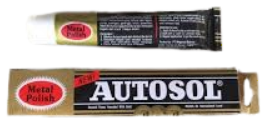

This test aims to determine the ultimate bearing capacity () and isolate the skin resistance () from the test results. To directly measure the point resistance (), an isolation technique was employed by coating the pile shaft surface with a lubricant (e.g., Autosol, Figure 7). The lubricant acts as a friction-reducing agent, effectively eliminating interaction between the pile shaft and the surrounding soil, ensuring that the skin resistance () is negligible during the test. This approach allows the point resistance () to be measured directly. Using the results of both the isolated and combined tests, the skin resistance () is calculated as the difference between the ultimate bearing capacity () and the point resistance (), as shown in Equation 124).
This study aimed to investigate the impact of the ratio on lateral stress distribution and the value. Test data from smooth and caudal piles were analyzed to establish relationships between depth (), depth-to-diameter ratio (), and the increase in skin resistance (). Using Equation 1, the value for each foundation model was calculated from the test results, enabling the determination of values at various depths based on experimental observations.
where,
= coefficient of lateral earth,
= skin resistance (Equation 1),
= angle of internal skin friction,
= skin surface area.
The skin resistance () was obtained by subtracting the measured point resistance from the total bearing capacity. Subsequently, the coefficient of lateral earth pressure () was back-calculated using Equation (2) based on the experimentally derived values. Experimental results were statistically validated using Analysis of Variance (ANOVA), a method that evaluates the significance of independent variables on a dependent variable by analyzing variability within and between groups36–40). In this study, ANOVA was employed to assess the influence of the ratio and pile configuration on skin resistance () and the coefficient of lateral earth pressure () the analysis aimed to determine whether variations in ratios significantly impacted and values. The F-statistic and corresponding p-values were calculated at a significance level (α) of 0.05 to evaluate the effects of geometric modifications on these performance metrics39–43).
3. Results and Discussion
3.1. Results
a)Distribution of Pile Skin Resistance () with Depth
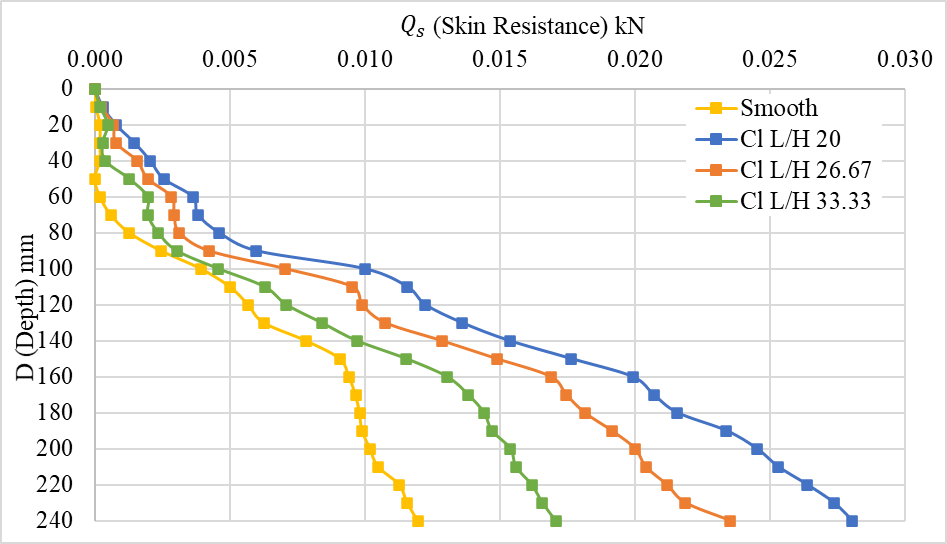
The skin resistance () values presented in this study are calculated using the relationship in Equation 1 from the experimental design. The graph in Figure 8 illustrates the relationship between pile skin resistance () and depth () for Smooth Pile Foundations and three asperity configurations ( = 20, = 26.67, = 33.33). The Smooth Pile recorded a maximum of 0.0119 kN at a depth of 240 mm, with a gradual increase in resistance observed across all soil layers. For the = 20 asperity configuration, the highest bearing capacity of 0.0280 kN was achieved at a depth of 240 mm. The distribution pattern remained consistent throughout the soil strata, reflecting the system's efficiency in enhancing bearing capacity. The = 26.67 asperity configuration recorded a peak of 0.0235 kN at the same depth, with more pronounced variations observed in the intermediate soil layers. In contrast, the = 33.33 asperity configuration exhibited a maximum bearing capacity of 0.0171 kN at 240 mm, with a relatively less stable distribution pattern across the depth. These results highlight the impact of ratios on the performance and efficiency of pile foundations under varying asperity configurations.
b)Increase in Skin Resistance () with Depth
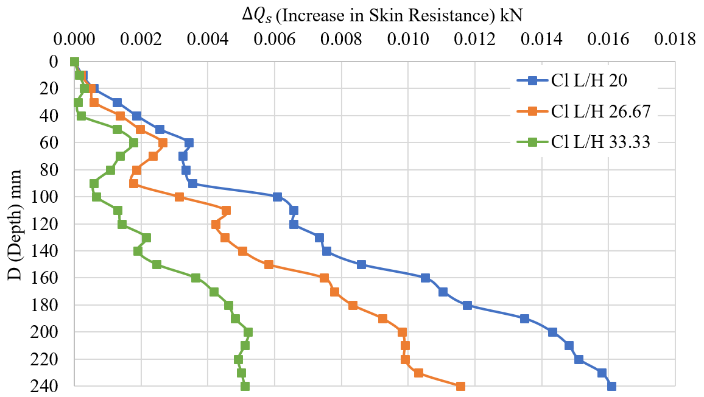
Figure 9 illustrates the relationship between the increase in skin resistance () and depth (). For the = 20 configuration, a maximum of 0.0160 kN was recorded at a depth of 200–240 mm, followed by a gradual reduction to zero at 240 mm. The = 26.67 asperity design achieved a peak of 0.0115 kN at a depth of 200–240 mm, with the capacity increase diminishing more rapidly compared to = 20. In contrast, the = 33.33 asperity configuration yielded the highest of 0.0052 kN at 200 mm, followed by a sharp reduction beyond this depth. These results highlight the varying performance of asperity configurations, with = 20 demonstrating the most consistent increase in across the tested depths.
c)Distribution of Skin Resistance () with Respect to the Ratio
Figure 10 illustrates the relationship between skin resistance () and the depth-to-diameter ratio () for Smooth Pile Foundations and three asperity configurations. The Smooth Pile recorded a maximum bearing capacity of 0.0119 kN at = 24, with a consistent performance across all tested ratios. The = 20 asperity configuration achieved the highest capacity of 0.0280 kN at = 24, demonstrating a more uniform distribution compared to other designs. The = 26.67 asperity design showed a maximum of 0.0235 kN at = 24, with slightly lower performance than = 20. For the = 33.33 asperity configuration, a maximum bearing capacity of 0.0171 kn was observed at = 24. However, the capacity experienced a rapid decline after = 10, reflecting a less efficient load transfer mechanism at lower depth-to-diameter ratios.


d)Increase in Skin Resistance () with Respect to the Ratio
Figure 11 illustrates the distribution of the increase in skin resistance () with respect to the depth-to-diameter ratio (). For the = 20 configuration, the highest increase in of 0.0160 kN was achieved at = 24, with a stable performance across all tested ratios. The = 26.67 asperity design recorded a maximum of 0.0115 kN at = 24, showing a steeper reduction in relative to other designs. In contrast, the = 33.33 asperity configuration exhibited a maximum increase of 0.0052 kN at = 2, followed by a significant decrease beyond = 20. Among the configurations, = 20 demonstrated the most consistent improvement in across the tested ratios, highlighting its efficiency in enhancing load transfer performance.
e)Comparison of Skin Resistance for Different Asperity
Although the intrinsic soil friction angle of Brantas sand remained constant at = 30°, the experimental results clearly indicate that the mobilized interface friction, reflected in the measured , varies significantly with asperity. As summarized in Table 2 and illustrated in Figure 12, the caudal pile with = 20 achieved the highest normalized caudal skin resistance and smooth skin resistance ratios (= 2.35), corresponding to a maximum of 0.0280 kN, and maintained a stable enhancement across the entire depth range. This behavior suggests efficient and sustained mobilization of dilatancy and mechanical interlocking along the pile–soil interface.
Table 2: Quantitative relationship between soil friction angle, asperity ratio, and measured skin resistance
| (°) | Max (kN) | Interface Mechanism | ||
|---|---|---|---|---|
| 0 | 30 | 0.012 | 1.000 | Sliding friction |
| 20 | 30 | 0.028 | 2.344 | Dilatancy and stable interlocking |
| 26.67 | 30 | 0.024 | 1.967 | Partial dilatancy |
| 33.33 | 30 | 0.017 | 1.426 | Shallow dilatancy dominance |

f)Lateral Earth Pressure Coefficient () with Depth
The lateral earth pressure (𝐾) values obtained from the graph in Figure 13 are calculated using the equation provided in Equation 2. Figure 12 illustrates the distribution of lateral earth pressure (𝐾) with depth (𝐷) for Smooth Pile Foundations and various asperity configurations. The Smooth Pile recorded a maximum 𝐾 value of 1.52 at a depth of 160 mm, with a linear distribution and minimal fluctuations. For the 𝐿/𝐻 = 20 asperity configuration, the highest 𝐾 value of 3.94 was achieved at a depth of 40 mm, demonstrating a consistent distribution across all depths. The 𝐿/𝐻 = 26.67 asperity design yielded a peak 𝐾 value of 3.27 at a depth of 30 mm, but fluctuations were observed in the shallow layers. Similarly, the 𝐿/𝐻= 33.33 configuration reached its highest 𝐾 value of 2.33 at a depth of 30 mm, followed by a sharp decline beyond 100 mm, eventually approaching the Smooth Pile value at greater depths. Among the tested configurations, the 𝐿/𝐻 = 20 asperity design exhibited the most stable lateral pressure distribution, while 𝐿/𝐻 = 26.67 and 𝐿/𝐻 = 33.33 configurations were more effective in enhancing 𝐾 values in the shallow soil layers.
g)Increase in Skin Resistance for Each
Based on statistical analysis (Table 3), the ratio significantly influences values, with a declining statistical effect as the ratio increases. At = 20, the F-statistic value reaches 10.68, with a P-value of 2.05×10⁻³, indicates a strong effect size, suggesting that variations in are predominantly governed by asperity effects rather than random within-group variability, as well as a highly statistically significant relationship. At = 26.67, the reduction in the F-statistic to 6.42 with a P-value of 1.47 × 10⁻² reflects a weakened effect size, although the observed relationship remains statistically significant. At = 33.33, the low F-statistic value of 2.07 with a P-value of 1.57 × 10⁻¹ indicates a small effect size and a statistically

Table 3: Increase in for Each
| Parameters | B10 () | ||
|---|---|---|---|
| 20 | 26.67 | 33.33 | |
| F-statistic | 10.68 | 6.42 | 2.07 |
| P-value | 2.05×10⁻³ | 1.47×10⁻² | 1.57×10⁻¹ |
Table 4: Increase in for Each
| Parameters | B10 () | ||
|---|---|---|---|
| 20 | 26.67 | 33.33 | |
| F-statistic | 99.32 | 62.53 | 17.92 |
| P-value | 4.54x10⁻¹³ | 4.05x10⁻¹⁰ | 1.09x10⁻⁴ |
insignificant relationship.
These results indicate that smaller ratios tend to produce a more effective response, whereas increasing the ratio progressively reduces its influence. Accordingly, the ratio remains a key parameter that should be considered in the performance evaluation of pile foundations.
h)Increase in Coefficient Lateral Earth for Each
Based on statistical analysis (Table 4), the ratio significantly influences the tested parameters, with its impact showing a decreasing trend as the ratio increases. At = 20, the F-statistic value reaches 99.32, with a P-value of 4.54×10⁻¹³, indicating a very strong and statistically robust relationship. When the ratio increases to 26.67, the F-statistic decreases to 62.53, with a P-value of 4.05×10⁻¹⁰, remaining significant but showing a weaker correlation. A further decline is observed at = 33.33, where the F-statistic sharply drops to 17.92, with a P-value of 1.09×10⁻⁴, though the relationship remains statistically significant. The consistently high F-values across all variations indicate a large effect size, although the magnitude of the effect tends to decrease at higher ratios. The persistence of statistically significant P-values suggests that the influence of the ratio on the lateral earth pressure coefficient () is stable and robust, and relatively less sensitive to depth variations compared to the .
These results indicate that smaller ratios are more effective in mobilizing load transfer through lateral earth pressure response, whereas larger ratios gradually reduce the intensity of this influence. This trend underscores the importance of optimizing the ratio to enhance performance efficiency in geotechnical applications, particularly in systems that strongly depend on lateral earth pressure behavior.
3.2. Discussion
a)Effect of Asperity Ratio () on Skin Resistance ()
The asperity ratio () significantly influences the skin resistance () of pile foundations. For the = 20 configuration, the maximum was recorded at 0.0280 kN at a depth of = 24, representing a 20% increase compared to the Reference Pile Foundation ( = 0.0119 kN). This improvement suggests that low to moderate asperities are more effective in distributing friction forces uniformly along the pile depth. In contrast, the = 33.33 asperity configuration achieved a of 0.0171 kN but exhibited a marked reduction in frictional effectiveness in deeper layers.
These findings align with DEM-based research, which indicates that high-angle asperities (52.4° to 74.1°) can enhance friction forces by up to 30% in poorly graded granular soils44,45). The soil properties in this study, including a friction angle (= 30°) and an average particle size ( = 0.40), support optimal interaction with lower asperities (= 20), resulting in more consistent mechanical interlocking. Among the tested configurations, the = 20 asperity design demonstrated superior friction capacity distribution across all depths, offering higher mechanical efficiency than other configurations46–49).
b)Correlation Between Dilatancy and Friction Angle
The dependence of normalized Qs on asperity geometry can be explained by dilatancy-induced mobilization of interface friction. According to Bolton’s dilatancy framework50,51), the peak friction angle mobilized during shearing () may exceed the intrinsic friction angle of the soil due to volumetric expansion associated with particle rearrangement44,45).
Previous studies indicate that the critical friction angle () of angular particles can be up to 15% higher than that of rounded particles52,53). In this study, the constant friction angle ( = 30°) represents a material property of the Brantas sand, whereas the enhancement in reflects variations in mobilized at the pile–soil interface as a result of asperity-induced dilation and interlocking. enhancement is governed by asperity design, with = 20 promoting sustained dilation and interlocking, while larger asperities ( = 33.33 limit mobilization due to localized stress concentration54–56).
c)Distribution of Lateral Pressure ()
The distribution of lateral pressure () exhibits distinct characteristics for each asperity configuration. The = 20 asperity configuration yields uniform lateral pressure up to = 24, while the = 33.33 configuration demonstrates localized lateral pressure concentration in shallow depths ( < 6). Previous studies have shown that rough asperities can increase lateral pressure by up to 25%, particularly in sandy soils with a roughness index ( = 0.926 to 1.852)57,58).
The soil's low uniformity coefficient ( = 0.96) indicates poor gradation, which amplifies lateral pressure concentration in high-asperity configurations like = 33.33. Conversely, the minimum void ratio ( = 0.62) facilitates the stabilization of lateral pressure in low-asperity configurations such as = 20. The = 20 configuration effectively distributes lateral pressure consistently across all depths, whereas the = 33.33 configuration generates higher lateral pressure but is limited to shallow layers.
d)Relevance to Meyerhof and Vesic Theories
This study aligns with the theories of Meyerhof (1976)24) and Vesic (1975)26), which suggest that skin resistance () can be enhanced through surface roughness. The reference pile, a of 0.0119 kN, corresponds to Meyerhof's predictions for steel piles under low normal pressure. The = 20 asperity configuration, demonstrating a 20% increase in capacity, highlights the effectiveness of mechanical interaction, particularly at greater depths, as supported by Vesic59,60). The asperity enhancements contribute to significant improvements in , reinforcing the relevance of classical theories in the context of small-diameter steel piles (10 mm diameter) and their applicability in modern geotechnical design.
e)Study Limitations
1)Pile Diameter: This study exclusively utilized piles with a diameter of 10 mm. This limitation may affect the external validity of the results, as differences in pile diameter can alter soil–pile interaction and the contribution of asperities to both and lateral earth pressure response. Therefore, the findings primarily represent relative behavior at the model scale, and further studies with varying diameters are required to improve generalization to field-scale applications.
2)Static Loading: The study focused solely on static load testing, without accounting for cyclic or dynamic responses. These aspects are critical for structures such as piers, offshore platforms, or earthquake-resistant foundations. Future investigations should explore the behavior of asperity configurations under dynamic loading conditions.
3)Unsaturated Soil Conditions: The tests were conducted under unsaturated soil conditions, and saturated conditions were not considered. This may influence both and , as different hydraulic conditions can significantly affect soil behavior. Accordingly, caution is required when generalizing the results to waterlogged environments, and additional studies under fully saturated conditions are recommended to enhance the applicability of the findings.
f)Future Research Directions
1)Effect of Pile Diameter: Future studies should explore the influence of varying pile diameters on skin resistance () and lateral pressure distribution () across different asperity configurations. This will help to generalize findings and assess scalability for larger or smaller pile applications.
2)Diverse Material Applications: Extending the research to include piles made of concrete, composite materials, or other alternatives could validate and expand the applicability of these findings across a broader spectrum of construction scenarios.
3)Cyclic Loading Studies: Investigating the behavior of asperity configurations under cyclic or dynamic loading conditions is essential for practical applications, especially in seismic zones, offshore structures, and other dynamic environments.
4)Performance in Saturated Soil: Further research should evaluate the performance of asperity configurations in fully saturated soil conditions. Insights from such studies would be valuable for designing foundations in waterlogged or high-moisture regions.
g)Theoretical Benefits
1)Development of Friction Capacity Theory: This study advances the understanding of how surface roughness impacts skin resistance (), reinforcing and building upon classical theories such as those proposed by Meyerhof and Vesic.
2)Correlation Between Void Ratio, Dilatancy, and Lateral Pressure: The findings contribute to geotechnical modeling by establishing a link between soil dilatancy, void ratio, and lateral earth pressure (), offering a nuanced perspective on soil-pile interactions.
3)New Insights into Lateral Pressure Distribution: The detailed analysis of lateral pressure () across various asperity configurations aids in refining pile design theories and optimizing performance in diverse soil conditions.
4)Relevance to DEM and Geotechnical Parameters: By validating correlations with geotechnical parameters such as friction angle, particle size, and roughness, this study provides empirical support for discrete element modeling (DEM) approaches, enhancing predictive accuracy in geotechnical simulations.
h)Practical Benefits
1)Optimization of Steel Pile Foundation Design: Enhances the design efficiency of steel pile foundations by improving the understanding of asperity configurations.
2)Material and Cost Efficiency: Enhances material usage and reduces construction costs by optimizing pile designs.
3)Development of Lightweight Modular Foundations: Supports the development of lightweight and modular foundation systems for various applications.
4)Application in Sandy Soil Conditions: Ensures adaptability in poorly graded sandy soils, leveraging interlocking mechanisms.
5)Strengthening Foundation Systems in Seismic Areas: Improves foundation resilience in earthquake-prone regions through enhanced mechanical interaction.
6)Increased Soil-Pile Interaction Efficiency: Maximizes the interaction efficiency between soil and piles, ensuring better load transfer.
7)Application in Waterlogged Environments: Provides solutions for designing foundations in saturated or waterlogged soil conditions.
4. Conclusion
The modification of surface asperities () significantly enhances skin resistance () and lateral pressure distribution (). The configuration increases by 20% compared to the reference pile (= 0.0119 kN), maintaining a stable distribution at a depth of = 24. In contrast, the = 33.33 asperity configuration demonstrates effectiveness in shallow depths ( < 6) but exhibits reduced efficiency at greater depths.
The observed skin resistance and lateral pressure responses are governed by dilatancy-induced mobilization of interface friction, while the intrinsic soil friction angle remains constant (φ = 30°). The L/H = 20 configuration promotes a more uniform lateral pressure distribution and sustained response with depth, whereas larger asperities (L/H = 33.33) induce localized stress concentration and reduced effectiveness at greater depths.
These findings suggest that the = 20 configuration is well-suited for structures requiring significant effective depth, such as bridges or piers. In contrast, the = 33.33 configuration is more applicable for shallow foundation systems, such as embankments or lightweight piles. This research provides a foundation for designing more efficient and stable pile foundations. Further studies are recommended to evaluate the effects of pile diameter variations, dynamic load conditions, and environmental factors.
Acknowledgement
The author would like to thank the Promoter and Co-Promoters of the Civil Engineering doctoral program at Brawijaya University for their support, which made this research possible.
References
- A. Martinez, S. Palumbo, and B.D. Todd, “Bioinspiration for anisotropic load transfer at soil–structure interfaces,” Journal of Geotechnical and Geoenvironmental Engineering, 145 (10) (2019). doi:10.1061/(asce)gt.1943-5606.0002138.
- K.B. O’Hara, and A. Martinez, “Load transfer directionality of snakeskin-inspired piles during installation and pullout in sands,” Journal of Geotechnical and Geoenvironmental Engineering, 148 (12) (2022). doi:10.1061/(ASCE)GT.1943-5606.0002929.
- J. Gray, and H.W. Lissmann, “The kinetics of locomotion of the grass-snake,” Journal of Experimental Biology, 26 (4) 354–367 (1950). doi:10.1242/jeb.26.4.354.
- H. Marvi, and D.L. Hu, “Friction enhancement in concertina locomotion of snakes,” J. R. Soc. Interface, 9 (76) 3067–3080 (2012). doi:10.1098/rsif.2012.0132.
- N. Sachdeva, and N. Shrivastava, “Sustainable use of solid waste as additives in soil stabilization: a state-of-art review,” Evergreen, 10 (4) 2536–2558 (2023). doi:10.5109/7162021.
- H. Febriansyah, T.P. Adinugroho, E. Kristiningrum, D.A. Susanto, U. Ayuningtyas, F. Isharyadi, A.T. Setyoko, and M. Ayundyahrini, “Provision of standards to support the potential utilisation of fly ash and bottom ash from coal-fired power plants for wastewater treatment,” Evergreen, 11 (4) 3520–3535 (2024). doi:10.5109/7326987.
- K. Joshi, and S. Sharma, “Optimization of stone column made by waste material of local available stone in rajasthan to help the sustainable development: an numerical study,” Evergreen, 10 (4) 2512–2519 (2023). doi:10.5109/7162016.
- T.W. Mak, and L.H. Shu, “Abstraction of biological analogies for design,” CIRP Ann. Manuf. Technol., 53 (1) 117–120 (2004). doi:10.1016/S0007-8506(07)60658-1.
- M.J. Benz, A.E. Kovalev, and S.N. Gorb, “Anisotropic frictional properties in snakes,” Bioinspiration, Biomimetics, and Bioreplication 2012, 8339 (i) 83390X (2012). doi:10.1117/12.916972.
- S. Singh, S.K. Singh, R. Kumar, A. Shrama, and S. Kanga, “Finding alternative to river sand in building construction,” EVERGREEN Joint Journal of Novel Carbon Resource Sciences & Green Asia Strategy, 09 973–992 (2022). doi:10.5109/6625713.
- M.F.C. Martinez, E.J. Liccioni, J.P.M. Corozo, D.J.M. Velazco, and M.C.N. Cejas, “Social dynamics and public policies in peripheral degraded areas in the northern zone of ecuador,” Evergreen, 11 (2) 602–611 (2024). doi:10.5109/7183317.
- M. Uesugi, and H. Kishida, “Influential factors of friction between steel and dry sands.,” Soils and Foundations, 26 (2) 33–46 (1986). doi:10.3208/sandf1972.26.2_33.
- A. Martinez, and J.D. Frost, “The influence of surface roughness form on the strength of sand-structure interfaces,” Geotechnique Letters, 7 (1) 104–111 (2017). doi:10.1680/jgele.16.00169.
- F. Han, E. Ganju, R. Salgado, and M. Prezzi, “Effects of interface roughness, particle geometry, and gradation on the sand–steel interface friction angle,” Journal of Geotechnical and Geoenvironmental Engineering, 144 (12) 10–16 (2018). doi:10.1061/(asce)gt.1943-5606.0001990.
- K.B. O’Hara, and A. Martinez, “Monotonic and cyclic frictional resistance directionality in snakeskin-inspired surfaces and piles,” Journal of Geotechnical and Geoenvironmental Engineering, 146 (11) 1–15 (2020). doi:10.1061/(asce)gt.1943-5606.0002368.
- W. Zhong, H. Liu, Q. Wang, W. Zhang, Y. Li, X. Ding, and L. Chen, “Investigation of the penetration characteristics of snake skin-inspired pile using dem,” Acta Geotech., 16 (6) 1849–1865 (2021). doi:10.1007/s11440-020-01132-2.
- L. Prandtl, “On the Hardness of Plastic Bodies,” in: News: From the Royal Society of Sciences at Göttingen, 1920: pp. 94–103.
- H. Reissner, “On the earth pressure problem,” Proceedings of the 1st International Congress for Applied Mechanics, 1 295–311 (1924).
- L. Zhang, “Experimental investigation of vertical and lateral bearing behaviors of single piles,” Soil Mechanics and Foundation Engineering, 61 (3) 239–247 (2024). doi:10.1007/s11204-024-09968-6.
- V.C. Maralapalle, M.B. Nadaf, S. Dutta, A.A. Zende, S.S. Mishra, and S. Charhate, “Load-settlement and skin friction behaviour of piles in dry sand: experimental and numerical study,” Sadhana - Academy Proceedings in Engineering Sciences, 49 (1) 4 (2024). doi:10.1007/s12046-023-02362-2.
- Y. Wang, and L. Liu, “Analysis of comparison of calculation methods for downdrag of single pile,” IOP Conf. Ser. Earth Environ. Sci., 218 (1) (2019). doi:10.1088/1755-1315/218/1/012002.
- K. Terzaghi, “Theoretical Soil Mechanics,” John Wiley & Sons, 1943. doi:10.1002/9780470172766.
- A.B. Vesic, “Bearing capacity of deep foundations in sand,” Highway Research Record, 39 112–153 (1963).
- G.G. Meyerhof, “Bearing capacity and settlement of pile foundation,” Journal of the Geotechnical Engineering Division, 102 (3) 197–228 (1976). doi:10.1061/ajgeb6.0000243.
- G.G. Meyerhof, “The ultimate bearing capacity of foundations,” Geotechnique, 2 (4) 301–332 (1951). doi:10.1680/geot.1951.2.4.301.
- A.S. Vesic, “Bearing Capacity of Shallow Foundations,” in: Foundation Engineering Handbook, Van Nostrand Reinhold, New York, 1975: pp. 121–147.
- J.H. Lee, and R. Salgado, “DETERMINATION of pile base resistance in sands,” Journal of Geotechnical and Geoenvironmental Engineering, 125 (8) 673–683 (1999). doi:10.1061/(ASCE)1090-0241(1999)125:8(673).
- N. Hataf, and A. Shafaghat, “Optimizing the bearing capacity of tapered piles in realistic scale using 3d finite element method,” Geotechnical and Geological Engineering, 33 (6) 1465–1473 (2015). doi:10.1007/s10706-015-9912-6.
- J.S. Moon, and S. Lee, “Static skin friction behavior of a single micropile in sand,” KSCE Journal of Civil Engineering, 20 (5) 1793–1805 (2016). doi:10.1007/s12205-016-0918-2.
- A. Martinez, and J.D. Frost, “Undrained behavior of sand–structure interfaces subjected to cyclic torsional shearing,” Journal of Geotechnical and Geoenvironmental Engineering, 144 (9) 1–13 (2018). doi:10.1061/(asce)gt.1943-5606.0001942.
- H. Wang, L.Z. Wang, Y. Hong, B. He, and R.H. Zhu, “Quantifying the influence of pile diameter on the load transfer curves of laterally loaded monopile in sand,” Applied Ocean Research, 101 (June) (2020). doi:10.1016/j.apor.2020.102196.
- O.A. Shulyatyev, and S.O. Shulyatyev, “Influence of pile foundation technology on the skin friction,” Smart Geotechnics for Smart Societies, 2100–2108 (2023). doi:10.1201/9781003299127-321.
- C. Liang, and R. Liu, “Calculation method for the vertical bearing capacity of a riser-surface casing composite pile,” Ships and Offshore Structures, 16 (S2) 66–76 (2021). doi:10.1080/17445302.2020.1861711.
- A. Martinez, and J. Tao, “Editorial for special issue on bio-inspired geotechnics,” Acta Geotech., 19 (3) 1137–1138 (2024). doi:10.1007/s11440-024-02323-x.
- V.L. Gayathri, and P. Vangla, “Shear behaviour of snakeskin-inspired ribs and soil interfaces,” Acta Geotech., 19 (3) 1397–1419 (2024). doi:10.1007/s11440-023-02009-w.
- A. Kuznetsova, P.B. Brockhoff, and R.H.B. Christensen, “LmerTest package: tests in linear mixed effects models,” J. Stat. Softw., 82 (13) 1–26 (2017). doi:10.18637/JSS.V082.I13.
- P. Kumar, F. Almeida, A. AR, and Q. Al-Mdallal, “Construction of optimised theoretical model using anova -taguchi methodology for transient flow of carreau nanofluid through microchannel prone to radiation,” Alexandria Engineering Journal, 112 411–423 (2025). doi:10.1016/j.aej.2024.10.111.
- Y. Yang, H. Wang, Q. Hu, L. Ji, Z. He, W. Shi, X. Song, and L. Zhou, “Two-phase flow investigation of sewage pumps with different tip clearance via computational fluid dynamics and multi-factor anova,” Engineering Applications of Computational Fluid Mechanics, 18 (1) (2024). doi:10.1080/19942060.2024.2322514.
- K. Megdouli, T. Gholizadeh, B. Tashtoush, P. Cinnella, and A. Skorek-Osikowska, “Optimization of carbon dioxide ejector expansion transcritical refrigeration system with anova and nsga-ii,” International Journal of Refrigeration, 158 173–189 (2024). doi:10.1016/j.ijrefrig.2023.11.012.
- T. Ermergen, and F. Taylan, “Investigation of doe model analyses for open atmosphere laser polishing of additively manufactured ti-6al-4v samples by using anova,” Opt. Laser Technol., 168 (2024). doi:10.1016/j.optlastec.2023.109832.
- J. Abellan-Garcia, Y.M. Abbas, M.I. Khan, and F. Pellicer-Martínez, “ANOVA-guided assessment of waste glass and limestone powder influence on ultra-high-performance concrete properties,” Case Studies in Construction Materials, 20 (2024). doi:10.1016/j.cscm.2024.e03231.
- I. Mohan, R. Mohan, B.S. Bhau, S. Dhar, V.K. Shivgotra, and D. Pathania, “Quantitative analysis of soil quality around brick kilns using pollution indices and anova in jammu district of jammu and kashmir, india,” Environ. Res., 262 (2024). doi:10.1016/j.envres.2024.119851.
- I. Khan, and R. Umar, “Improving evaluation of groundwater heavy metal(loid)s pollution efficiencies: insights from novel shannon entropy-weight and one-way anova analysis,” Groundw. Sustain. Dev., 24 (2024). doi:10.1016/j.gsd.2023.101052.
- S.P.K. Kodicherla, “Discrete element modelling of granular materials incorporating realistic particle shapes,” International Journal of Geo-Engineering, 14 (1) (2023). doi:10.1186/s40703-023-00193-y.
- P. Vangla, B.A. Wala, V.L. Gayathri, and J.D. Frost, “Snakeskin-inspired patterns for frictional anisotropic behaviour of split set rock bolts,” Geotechnique Letters, 12 (2) (2022). doi:10.1680/jgele.21.00076.
- Y. Wu, H. Tang, Y. Zhang, and D. Wang, “The effect of particle size distribution on the collapse of wet polydisperse granular materials,” Comput. Geotech., 177 106854 (2025). doi:10.1016/j.compgeo.2024.106854.
- R. Lu, Q. Luo, T. Wang, D.P. Connolly, and T. Xie, “A combined experimental and dem investigation of grain interlocking in sheared granular assemblies,” Particuology, 90 436–451 (2024). doi:10.1016/j.partic.2024.01.015.
- N. Zhang, Y. Chen, A. Martinez, and R. Fuentes, “A bioinspired self-burrowing probe in shallow granular materials,” Journal of Geotechnical and Geoenvironmental Engineering, 149 (9) (2023). doi:10.1061/jggefk.gteng-11507.
- M. Zakarka, and Š. Skuodis, “Granular Soil Relationship Between Angle of Internal Friction and Uniformity Coefficient,” in: Lecture Notes in Civil Engineering, Springer Science and Business Media Deutschland GmbH, 2023: pp. 105–111. doi:10.1007/978-3-031-20172-1_8.
- M.D. Bolton, “The strength and dilatancy of sands,” Géotechnique, 36 (1) 65–78 (1986). doi:10.1680/geot.1986.36.1.65.
- M.D. Bolton, M.W. Gui, J. Garnier, J.F. Corte, G. Bagge, J. Laue, and R. Renzi, “Centrifuge cone penetration tests in sand,” Géotechnique, 49 (4) 543–552 (1999). doi:10.1680/geot.1999.49.4.543.
- D. Krengel, H. Jiang, J. Chen, and T. Matsushima, “The combined effect of particle angularity and inter-particle friction on micro- and macroscopic properties of granular assemblies,” Comput. Geotech., 177 (2025). doi:10.1016/j.compgeo.2024.106850.
- D. Krengel, J. Chen, and M. Kikumoto, “Effects of particle angularity on the bulk-characteristics of granular assemblies under plane strain condition,” Comput. Geotech., 164 105812 (2023). doi:https://doi.org/10.1016/j.compgeo.2023.105812. [DOI]
- H.H. Stutz, and A. Martinez, “Directionally dependent strength and dilatancy behavior of soil–structure interfaces,” Acta Geotech., 16 (9) 2805–2820 (2021). doi:10.1007/s11440-021-01199-5.
- K.A. Alshibli, and M.B. Cil, “Influence of particle morphology on the friction and dilatancy of sand,” Journal of Geotechnical and Geoenvironmental Engineering, 144 (3) (2018). doi:10.1061/(asce)gt.1943-5606.0001841.
- T. Zhang, Y. Wang, C. Zhang, and S. Wang, “DEM investigation of particle gradation effect on the stress-dilatancy behavior of granular soil,” Advanced Powder Technology, 35 (11) (2024). doi:10.1016/j.apt.2024.104692.
- A. Martinez, and S. Palumbo, “Anisotropic Shear Behavior of Soil-Structure Interfaces: Bio-Inspiration from Snake Skin,” in: American Society of Civil Engineers (ASCE), 2018: pp. 94–104. doi:10.1061/9780784481592.010.
- M. Tolun, B. Emirler, O.L. Ertugrul, and A. Yildiz, “Effect of dilatancy on tension response of completely rough piles embedded in granular soils,” Ocean Engineering, 292 (2024). doi:10.1016/j.oceaneng.2023.116507.
- M.I. Abu Qamar, K. Weimann, Y. Khasawneh, and M.T. Suleiman, “Shear behavior at the interface of rough surfaces and cohesive soils under axial loading,” Results in Engineering, 24 (2024). doi:10.1016/j.rineng.2024.103278.
- R. Liu, S. Lou, X. Li, G. Han, and Y. Jiang, “Anisotropic surface roughness and shear behaviors of rough-walled plaster joints under constant normal load and constant normal stiffness conditions,” Journal of Rock Mechanics and Geotechnical Engineering, 12 (2) 338–352 (2020). doi:10.1016/j.jrmge.2019.07.007.