
Abstract
Material waste poses cost in the construction project management process. This research aims to determine the quantity of high-cost material waste and pinpoint the primary causes of waste in the Gedung Hunian Lembaga Pemasyarakatan Narkotika construction project. Employing a lean construction approach, data were analyzing using the IBM SPSS 26 application. Material waste levels were calculated by comparing the waste volume and the total installed material, while the Borda method was utilized to rank the most influential waste indicators. The results analysis identified three high-cost materials: threaded rebar, K-300 ready-mix concrete, and plain rebar. Specifically, the percentage of material waste level for threaded rebar were 1% (D19), 11% (D16), 3% (D13), 5% (D10); K-300 ready mix concrete was 3%; and for plain rebar were 5% (Ø12), 1% (Ø10), and 0% (Ø8). Overproduction variable, characterized by an indicator of overuse of materials that exceed the needs, emerged as the main causative waste factor, weighing 0.45. These findings provide actionable insights for minimizing material waste and improving cost efficiency in construction projects.
Keywords: borda, lean construction, material waste, waste level, waste ranking
Outline
1. Introduction
The complexity of construction projects is growing, with increasing challenges in both physical and cost aspects. Almost all projects face constraints in resources, including workers, materials, and costs1). In Indonesia, the main challenge confronting the construction industry is effective construction management. One critical issue in the construction management process is the generation of waste2). Although the immediate impact may not be visible, its persistent and intensive occurrence can lead to significant negative consequences3). These effects extend beyond the project itself, adversely impacting the environment as well4,5). Therefore, to successfully deliver projects, the project management must increase both the effectiveness and efficiency in utilizing human resources, costs, information, technology, equipment, facilities, and materials1).
Materials play a crucial role in the success of construction projects6). Materials are contributing approximately 40-60% of the total project cost7). Often, in construction projects, there is an excess of material supply or a shortage of supplies, which is often a waste due to excessive investment. An excess of material inventory can hinder the smooth running of a project, while a shortage of inventory can cause problems. Additionally, the implementation of construction projects generates unused materials, called waste materials8). Minimizing the potential for material waste in construction projects requires effective management9). Although waste cannot be eliminated, it can be reduced through good control project management10). The Lean Construction (LC) approach, adopted from the manufacturing industry, is one way to minimize waste in construction projects10).
Lean construction (LC) is a method in construction projects focusing on waste elimination and value-added optimization9). This approach tries to maximize project value while minimizing cost incurred by the consumers (project owners)11). Lean construction is part of project management that integrates knowledge, skills, and expertise by rolling out the best techniques within resource constraints, focusing on achieving optimal costs and time, and ensuring work safety12). LC is also a project management strategy that systematically reduces waste and enhances value13). The benefits of implementing LC not only provide a robust solution to manage projects but also help consultant service providers in identifying and mitigating waste, ultimately achieving the expected project outcomes.
Previous research related to lean construction has predominantly focused on finding factors that affect or cause waste materials10,14-17) or Waste Non-Value Added Activity9,18,19). In addition, studies have examined the issues in applying lean construction practices in the construction industry2,19). In this study, the potential for material-level waste in the project is first identified before looking for the cause of waste in the project with the Lean Construction approach. The waste level is calculated by comparing the volume of waste material generated to the volume of installed or used material17,20,21).
To identify the waste factors contributing to material waste in construction, this study focuses on the seven most considerable potential waste that arise in construction projects, namely: (i) transportation, (ii) inventory, (iii) motion, (iv) waiting, (v) overproduction, (vi) over-processing, (vii) defects22). The data analysis was conducted using the Borda method to determine the dominant factors causing material waste. The Borda technique is used to select the best alternative among multiple options and is applied in the decision-making process based on questionnaire responses from respondents. Additionally, Borda is used to rank, identifying the most significant contributor to waste23). The object of this research is the construction project of the Gedung Hunian Lembaga Pemasyarakatan. The study aims to calculate the material waste level and determine the dominant factors contributing to material waste within the project.
2. Research Methods
This research employs a quantitative approach within the framework of lean construction. The research process comprises several stages, beginning with research instrument development, followed by the collection of both primary and secondary data. Subsequently, the data are analyzed to identify and determine the dominant factors among several alternatives.
Table 1: Variables and Indicators of Material Waste
| No. | Variables and Indicators | Citations |
|---|---|---|
| I | Defect | 6) |
| 1 | Material damaged by weather | |
| 2 | Damage to the work tool | |
| 3 | Incorrect implementation of work rules | |
| 4 | The existence of a design change | |
| II | Over Production | 6,25) |
| 1 | Lack of material optimization on the project | |
| 2 | Overuse of materials that exceed the needs | |
| 3 | Design changes | |
| III | Waiting | |
| 1 | Duration of material arrival | |
| 2 | Out of materials or not yet available | 6) |
| 3 | Loss of tools | |
| 4 | Equipment incompatibility | |
| IV | Over Processing | 25) |
| 1 | Inconsistency of work procedures | |
| 2 | Poor equipment maintenance | |
| 3 | Failure to combine tools | |
| V | Motion | 25) |
| 1 | Inappropriate work layout | |
| 2 | Poor workplace management | |
| 3 | Inconsistent working method | |
| 4 | Un-ergonomic equipment | |
| VI | Transportation | 6,25) |
| 1 | Materials scattered in the project area | |
| 2 | Ineffective layout of workplace | |
| 3 | Ordering materials that are too far away | |
| 4 | Inappropriate delivery schedule | |
| VII | Inventory | 6,25) |
| 1 | poor storage space | |
| 2 | Limited material storage locations | |
| 3 | Improper storage techniques for material and equipment | |
| 4 | Material damaged due to too long storage |
2.1. Instrument Preparations
The research instrument was developed by identifying the variables and factors contributing to material waste. Based on lean construction principles, seven waste categories were considered: defect, overproduction, waiting, overprocessing, motion, transportation, and inventory22,24). The selection of variables was informed by previous research. Furthermore, these variables and indicators formed the basis for designing questionnaires used for primary data collection. The detailed elaboration of variables and waste indicators is presented in Table 1
Table 1 identifies twenty-six indicators explaining the causes of material waste. These indicators are incorporated into the questionnaire, which is distributed to prospective respondents of the study.
2.2. Data Collection
The data collected in this study consists of both primary and secondary data. Primary data were collected from respondents through a questionnaire, documenting the causes of material waste during construction. The detailed design of the questionnaire was informed by the variables referenced in Table 1. Respondents were selected through snowball sampling, which is particularly effective when suitable research participants are challenging to identify26). The snowball sampling technique is used to identify, select and determine samples in a network effectively and continuously based on the recommendations of previous respondents27,28). The most promising respondent was asked to recommend others who fit the criteria for subsequent respondents. The process repeats until an adequate size is achieved to support the research findings. Typically, targeting respondents is 10-30 participants 27), with 20 as the intended median. However, there are several biases in this technique. First, the potential for sample homogeneity exists, as initial respondents may refer to individuals from their own networks who tend to share similar characteristics or views29). This may reduce the diversity of perspectives and prevent the sample from being fully representative of the broader population. Second, there is a willingness bias; recruited participants are often those with strong relationships with the recruiter and a greater willingness to participate29). To mitigate this bias, initial participants were recruited from diverse backgrounds, and screening criteria were established to ensure referred respondents met the study's requirements. Secondary data included materials list to find out what materials are used in the project, as-built drawings to find out the amount of materials installed for the project, and a Bill of Quantity (cost budget plan) to obtain information regarding material volumes used in the project.
2.3. Data Analysis
The conceptual diagram (flowchart) of the lean construction analysis process for this study can be seen in

Figure 1 presents the analysis process using the Lean Construction approach to identify waste materials and their potential causes. Waste materials were identified through field observation, with findings cross-checked via interviews with project supervisors. To determine the causes of waste, questionnaires based on the 7 waste classifications (defects, overproduction, waiting, overprocessing, motion, transportation, and inventory) were distributed to respondents.
The collected material data is determined using Equation 1, which calculates waste as the difference between purchased material volume and the installed material volume. Next, the percentage of waste level is calculated by comparing the waste volume to the installed material volume, as shown in Equation 2.
To identify the factors contributing to material waste in the observed project, validity and reality tests are conducted using IBM SPSS 26 after data collection. Validity and reliability are fundamental in evaluating any measurement instrument or tool for good research30). The reliability and validity in research are to guarantee the trustworthiness of the data and the accuracy of the findings, thereby ensuring the study’s outcomes are replicable (ensuring the data collected is accurate and consistent). For example, the indicator “weather can damage materials” at a construction site is considered valid if respondents consistently perceive it as relevant. However, the indicator must also be reliable for further use. Reliability is a necessary precondition for validity; an instrument that yields inconsistent results cannot provide accurate measurements. Validity was assessed using Corrected Item-Total Correlation, where an item is considered valid if the calculated correlation value (r count) is greater than the table’s correlation value (r table) at a significant level of generally 5%. The smaller the alpha value, the more unreliable the items. The standard used is alpha > 0.70, whose reality is quite reliable as a data acquisition tool (sufficient reliability)31).
2.4. Determine the most dominant factor
The Borda method was used to analyze the questionnaire data by ranking the causes of material waste from the highest to the lowest priority. The questionnaire used a four-point Likert scale for each indicator: Very Often (VO), Frequent Occurrence (FO), Rare ®, and Very Rare (VR). Each factor associated with material waste as assigned as a weight, with the highest weight being (n-1), and the lowest being 0. To calculate the indicator value, the number of respondents for each scale should be multiplied by the Borda score using Equation 3.
After obtaining the indicator values (total of Borda score), the next step is calculating each indicator’s weight using Equation 4. The total value of the indicators owned by each variable is divided by the indicator value or the total Borda Score.
3. Results
The results of this study are aligned with the research objectives established at the beginning, to obtain the percentage level of waste material generated in the project and identify the dominant cause of the waste material. Secondary data used in this study was obtained from contractors, including the Cost Budget Plan and Shop Drawing data. Several cross-checks were carried out with contractors related to material volume data. For primary data collection, the snowball sampling technique was employed, beginning with the respondent in the highest position first, namely the Project Manager, who is presumed to possess a comprehensive understanding of the questionnaire content. The project manager then recommended a subsequent respondent from the Construction Management division and Civil Inspectorate, each of whom further identified additional qualified individuals with relevant expertise. This referral process ensured that all participants had sufficient knowledge to provide informed responses.
3.1. Calculating Waste Level
To obtain the waste level in this study, after the secondary data of the materials used in the project are obtained, a volume recapitulation of each type of material used in that building is carried out. Notably, rebar materials (threaded and plain) and concrete mix K 300 are the costliest materials in the project. Excessive waste of these materials can substantially impact overall project costs. The calculation results for the purchased material installed and material volumes can be seen in Table 2.
Based on the total recapitulation of installed and purchased materials from dominant-cost materials in Table 2, the waste level is calculated using to the formulas in equations (1) and (2). For example, applying Equation (1), the volume of waste material for ready-mix concrete K-300 was 30,41 m3 and using Equation (2), its waste level of ready-mix concrete K-300 was at 3%.
Table 2: Result of Calculation of Installed Material Volume and Purchased Material Volume
| No. | Material | Purchased Materials | Unit | Installed |
|---|---|---|---|---|
| 1 | Ready Mix Concrete K-300 | 1050,00 | M3 | 1019,59 |
| 2 | Rebar of D19 | 42730,85 | Kg | 42157,77 |
| 3 | Rebar of D16 | 38351,23 | Kg | 34546,17 |
| 4 | Rebar of D13 | 26255,5 | kg | 25607,59 |
| 5 | Rebar of D10 | 50528,34 | kg | 48168,17 |
| 6 | Rebar of Ø12 | 1171,84 | kg | 1112,06 |
| 7 | Rebar of Ø10 | 22194 | kg | 22004,688 |
| 8 | Rebar of Ø8 | 3669,41 | kg | 3655,91 |
Note: D for threaded rebar and P for plain rebar
Table 3: Result of Waste Level Volume
| No.ì | Material | Purchased Materials | Unit | Installed | Waste Volume |
|---|---|---|---|---|---|
| 1 | Ready Mix Concrete K-300 | 1050,00 | M3 | 1019,59 | 30,41 |
| 2 | Rebar of D19 | 42730,85 | Kg | 42157,77 | 573,08 |
| 3 | Rebar of D16 | 38351,23 | Kg | 34546,17 | 3805,06 |
| 4 | Rebar of D13 | 26255,5 | kg | 25607,59 | 647,91 |
| 5 | Rebar of D10 | 50528,34 | kg | 48168,17 | 2360,17 |
| 6 | Rebar of Ø12 | 1171,84 | kg | 1112,06 | 59,78 |
| 7 | Rebar of Ø10 | 22194 | kg | 22004,688 | 189,31 |
| 8 | Rebar of Ø8 | 3669,41 | kg | 3655,91 | 13,50 |
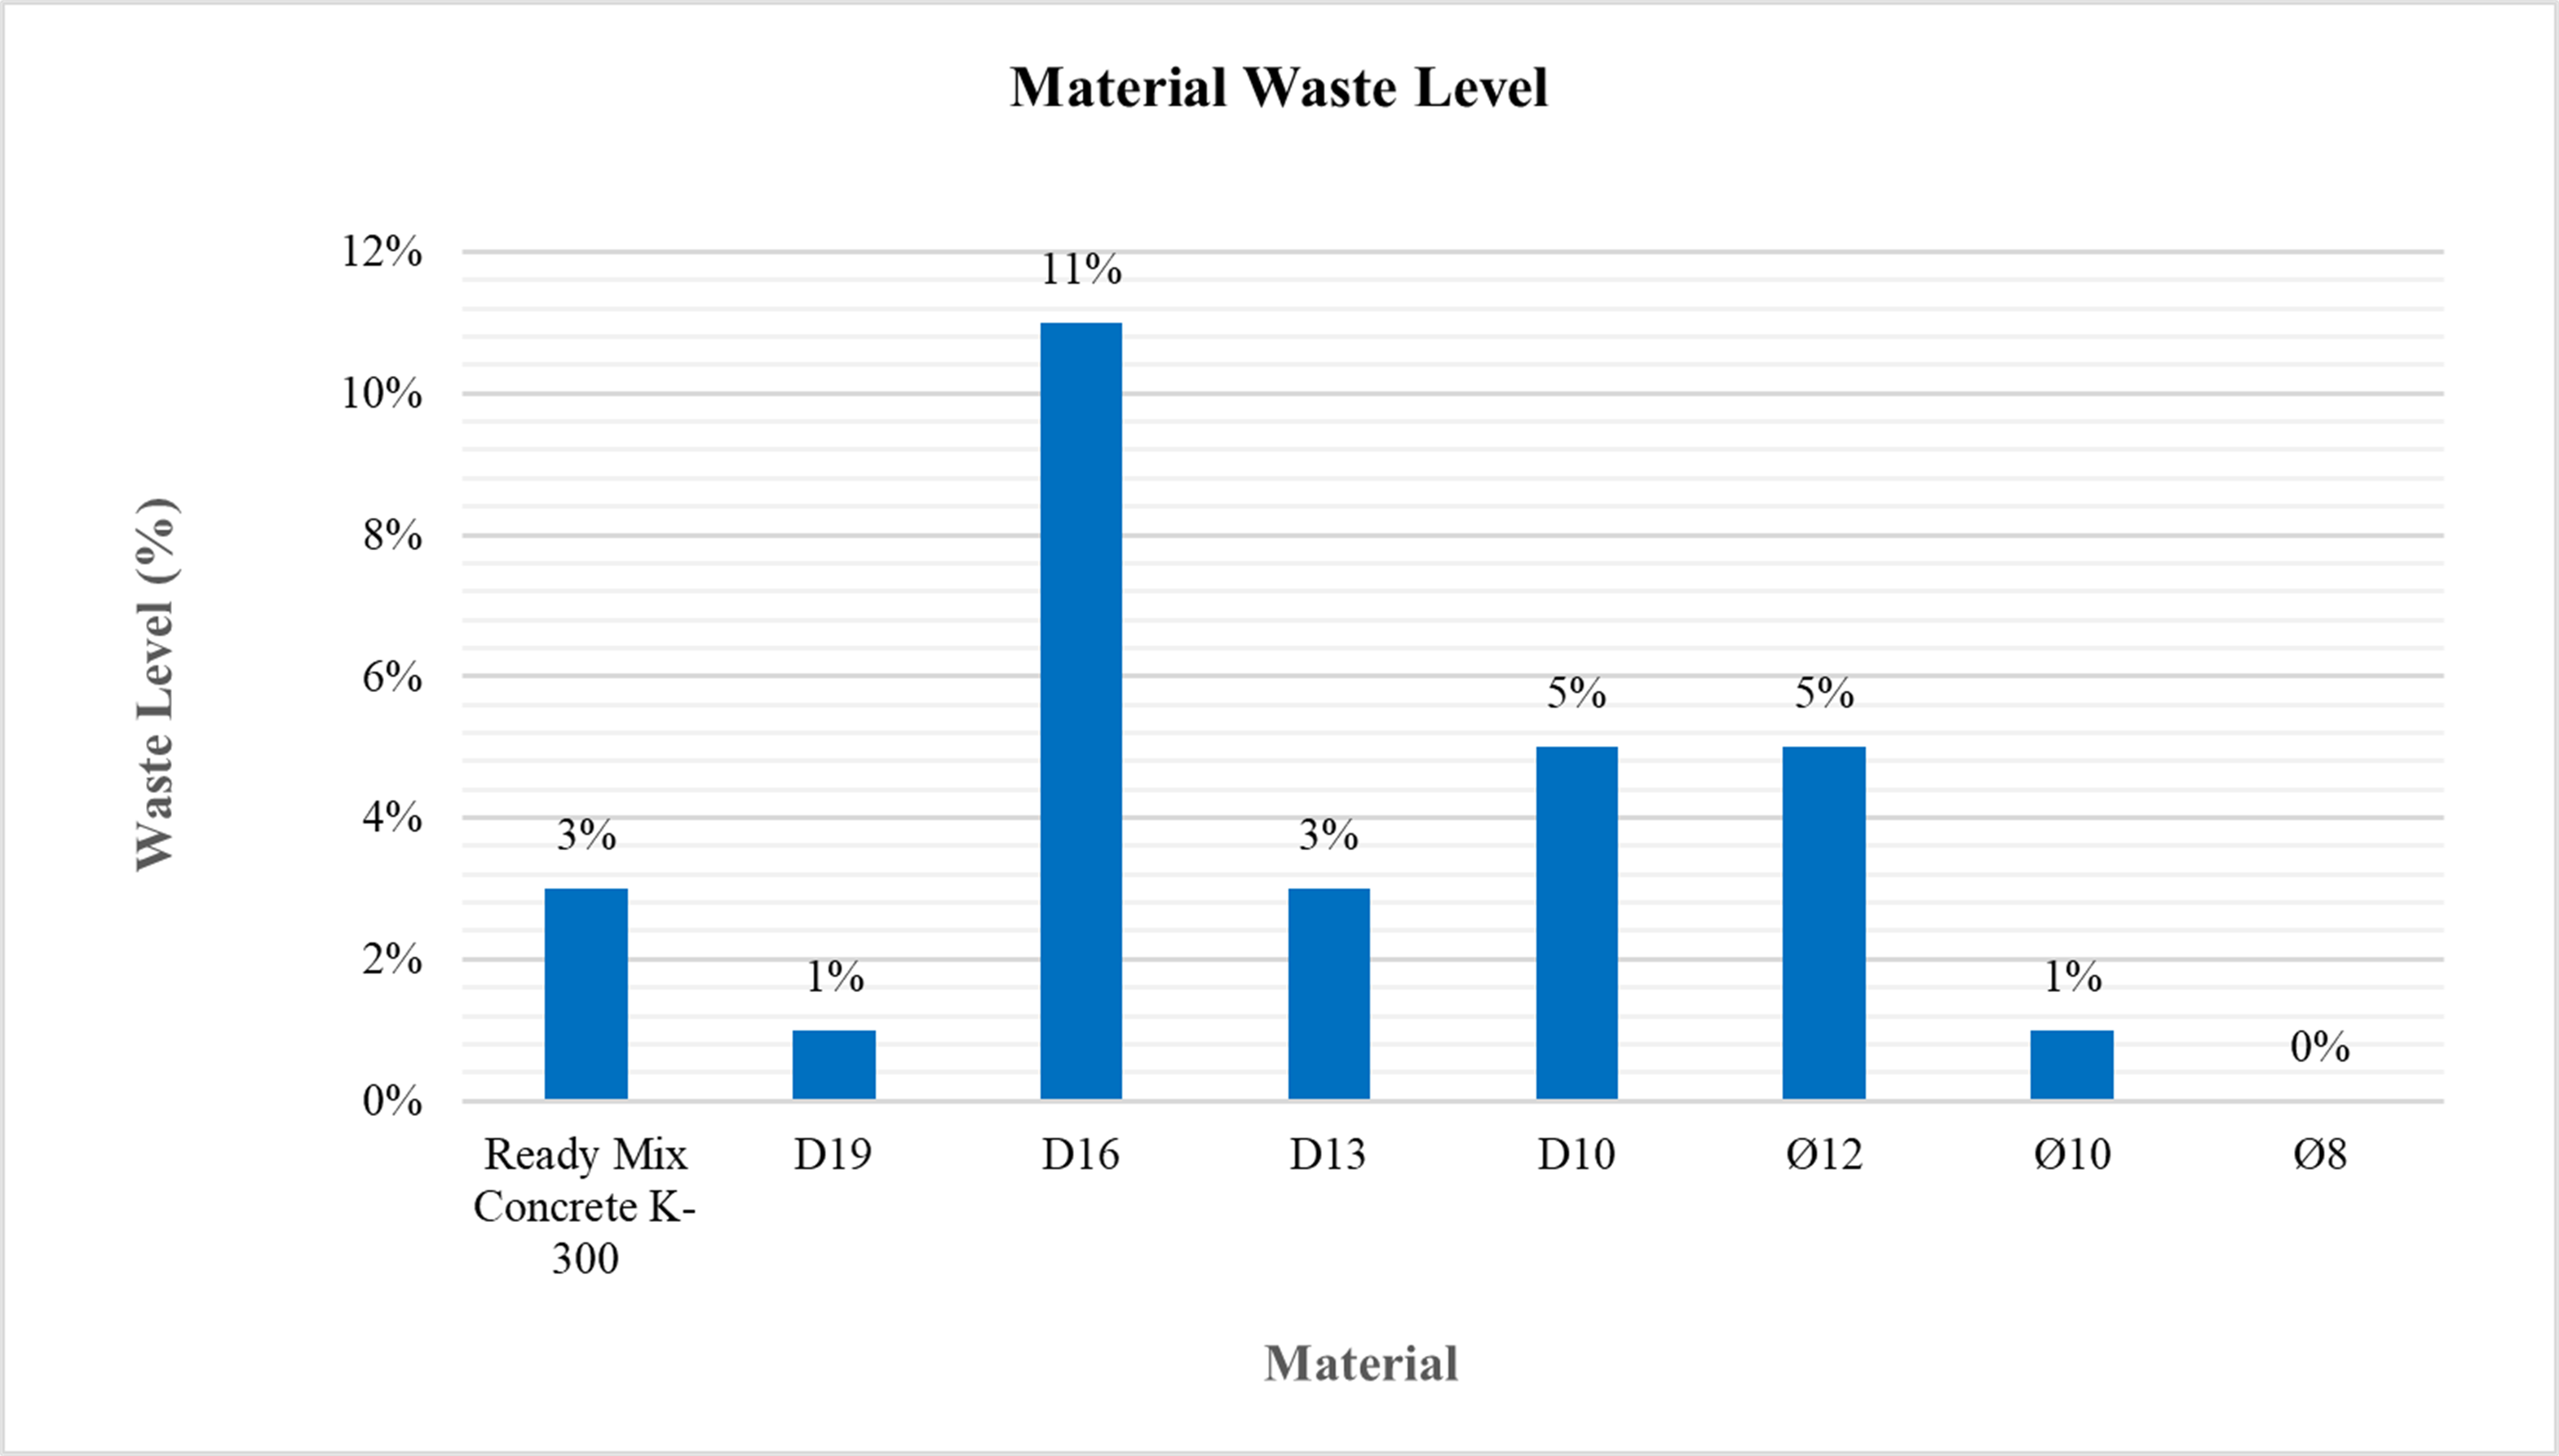


This calculation procedure was applied to all materials listed in Table 2. The overall volume as a result of the rebar and concrete waste levels calculation in the construction project of Gedung Hunian Lembaga Pemasyarakatan Narkotika, as determined by Equations (1) and (2) can be seen in Table 3, and Figure2 shows the waste level of each material.
Table 3 shows the results of varying waste material volumes across materials, with nearly material exhibiting some degree of wastege. The highest volume of waste material was rebar D16 (3,805.08 Kg), followed by D10 (2360,17 Kg) and D13 (647,91 Kg). The lowest waste of rebar volume was P8, with only 13,50 Kg. Based on Figure 2, the highest percentage of material waste level was still D16 (11%), with D10 and Ø12, both registering the next highest percentage (5%). The material with the smallest percentage of waste is Ø8, with a waste level of almost 0%. An example of material waste (rebar and concrete) found in the project location can be seen in Figure3.
Figure 3 displays two visual documentations of waste materials found at the project site, providing direct visual evidence of material wastage. In part (a), the rebar, waste is shown as a collection of rusted and unused pieces, piled up haphazardly. This supports the analysis of unused material scrap, potential material loss, and wasted costs. The bent, uneven length of the rebar, and the presence of the scrap in one waste container indicate that this waste material may have originated from cutting or bending errors. The numerous cuts and irregular shapes indicate imprecise workmanship and lack of supervision during fabrication and installation. Part (b) of Figure3 displays a lump of hardened K-300 concrete piled as waste, presumed to be leftover from casting activities. This waste likely resulted from untimely casting (delays), casting errors (overprocessing), and inconsistencies with work procedures.
3.2. Validity and Reliability Test
The validity and reliability testing were carried out after primary data related to the indicators of waste causes were obtained. Twenty respondents contributed to filling out the questionnaire, and this number is by the target respondents to be achieved, as mentioned in the methodology chapter. All respondents were workers in the Gedung Hunian Lembaga Pemasyarakatan Narkotika construction project. The IBM SPSS 26 application was used to conduct both validity and reliability tests. The results of the validity test are presented in Table 4.
Table 4: Result of the Instrument Validity Test
| Variable | Indicators | rcount | rtable | Conclusion |
|---|---|---|---|---|
| Defect | X1.1 | 0.700 | 0.468 | Valid |
| X1.2 | 0.656 | 0.468 | Valid | |
| X1.3 | 0.692 | 0.468 | Valid | |
| X1.4 | 0.874 | 0.468 | Valid | |
| Oìver Proìdulctioìn | X2.1 | 0.669 | 0.468 | Valid |
| X2.2 | 0.735 | 0.468 | Valid | |
| X2.3 | 0.695 | 0.468 | Valid | |
| Waiting | X3.1 | 0.790 | 0.468 | Valid |
| X3.2 | 0.783 | 0.468 | Valid | |
| X3.3 | 0.816 | 0.468 | Valid | |
| X3.4 | 0.794 | 0.468 | Valid | |
| Oìver Proìcessing | X4.1 | 0.800 | 0.468 | Valid |
| X4.2 | 0.748 | 0.468 | Valid | |
| X4.3 | 0.899 | 0.468 | Valid | |
| Moìtioìn | X5.1 | 0.520 | 0.468 | Valid |
| X5.2 | 0.911 | 0.468 | Valid | |
| X5.3 | 0.692 | 0.468 | Valid | |
| X5.4 | 0.863 | 0.468 | Valid | |
| Transportation | X6.1 | 0.542 | 0.468 | Valid |
| X6.2 | 0.811 | 0.468 | Valid | |
| X6.3 | 0.802 | 0.468 | Valid | |
| X6.4 | 0.758 | 0.468 | Valid | |
| Inventoìry | X7.1 | 0.817 | 0.468 | Valid |
| X7.2 | 0.892 | 0.468 | Valid | |
| X7.3 | 0.868 | 0.468 | Valid | |
| X7.4 | 0.866 | 0.468 | Valid |
Table 5: Reliability Test Results
| No. | Indicator (X) | Cronbach's Alpha if Item Deleted | Information | |
|---|---|---|---|---|
| 1 | X1.1 | 0.765 | Reliabel | |
| X1.2 | 0.779 | Reliabel | ||
| X1.3 | 0.766 | Reliabel | ||
| X1.4 | 0.767 | Reliabel | ||
| 2 | X2.1 | 0.789 | Reliabel | |
| X2.2 | 0.773 | Reliabel | ||
| X2.3 | 0.785 | Reliabel | ||
| 3 | X3.1 | 0.773 | Reliabel | |
| X3.2 | 0.777 | Reliabel | ||
| X3.3 | 0.776 | Reliabel | ||
| X3.4 | 0.771 | Reliabel | ||
| 4 | X4.1 | 0.777 | Reliabel | |
| X4.2 | 0.765 | Reliabel | ||
| X4.3 | 0.763 | Reliabel | ||
| 5 | X5.1 | 0.779 | Reliabel | |
| X5.2 | 0.778 | Reliabel | ||
| X5.3 | 0.786 | Reliabel | ||
| X5.4 | 0.787 | Reliabel | ||
| X6.1 | 0.762 | Reliabel | ||
| 6 | X6.2 | 0.776 | Reliabel | |
| X6.3 | 0.777 | Reliabel | ||
| X6.4 | 0.769 | Reliabel | ||
| 7 | X7.1 | 0.768 | Reliabel | |
| X7.2 | 0.776 | Reliabel | ||
| X7.3 | 0.780 | Reliabel | ||
| X7.4 | 0.773 | Reliabel | ||
As shown in Table 4, the values of the r count of the overall indicators of the variable causing waste in the project were bigger than the critical value (r count > r table). The R table contains numbers used to test various possible results of the validity of research data. R tables are an essential reference in statistical science used to test the validity of research data. This is done to ensure the data's validity in the research32).
In Table 4, the r table has a value of 0.468, obtained by calculating the r table with the condition df = n-2 (n=20) with a sig of 5%33,34). The comparison results of r count and r show that all indicators of waste material give valid results (r count > r table 0.468). The validity test results also show that the variable inventory provides a relatively high indicator value compared to other variables, which means the results best reflect the measured reality or are most accurate. Furthermore, a reliability test is carried out for all valid indicators. The results of the reality test can be seen in Table 5.
The reliability test result in Table 5 shows that all indicators are reliable. This is because the apparent value of each indicator variable is more than 0.70. The reliability level is considered good if the value is ≥ 0.70031,32). In Table 5, all indicators indicate that the reliability is adequate, so each item is considered reliable and the tests are consistent with reliability. The reliability test with N items is 26 (all indicators directly), as seen in Table 6.
Table 6 shows that the reliability test applied to all question items (N = 26) also gives results of more than 0.7. The Cronbach’s Alpha value is 0.773 (0.773 > 0.7), the reliability is quite reliable as a data acquisition tool (sufficient reliability). This reliability is often equated with consistency, stability, or dependability, which shows the extent to which the measurement can provide relatively similar results when measured again on the same subject.
3.3. Ranking of Material Waste Indicators
To rank the factors contributing to material waste, the Borda method was applied. The ranking of the factors was conducted to determine the most frequent causative waste factors. Based on Borda's method, each causal factor was assigned a score. The highest score is (n-1), and the lowest is 034), as detailed in Table 7. Factors were then ranked from most to least frequent based on Borda scores.
In this study, there are four alternative scales were used for each indicator, namely Very Often (VO), Frequent Occurrence (FO), Rare (R), and Very Rare (VR). Based on the Borda formula, if there are n alternatives, the first rank gets n-1 points, the second rank gets n-2 points, and so on, with the lowest rank gets 0 points34). As a result, in this context, the Borda score in this study ranged from 3 to 0. To get the values of each indicator, the number of respondents for each scale should be multiplied by the Borda score using Equation 3. This equation indicates that the total score for each indicator is obtained by summing the products of the number of respondents for VO, FO, R and VR with their respective Borda score. Once the indicator values (total of Borda score) are calculated, the next step is to compute the weight of each indicator using Equation 4.
Respondents were given a choice of a criterion for each material waste indicator. The results of the questionnaire distribution showed that respondents had varied perceptions of each option, reflecting their knowledge and experience in the construction project. Table 8 provides the results of calculating the number of respondents who gave a choice on each option multiplied by the Borda score (3-0) based on Equation 3, as well as the calculated weights for each material waste indicator based on Equation 4.
As shown in Table 8, overproduction, characterized by the overuse of materials that exceed the needs, emerged as the most influential factor causing waste material in the project construction of 0,45. The lowest indicator influenced is the existence of a design change of only 0,18. However, the dominant variable that had many indicators more than average was overprocessing. Each indicator in its variable has a total Borda score of more than 0,268 (average of all indicators) with an average weight of overprocessing variable of 0,33. On the other hand, the lowest variable of Borda’s total score was waiting, with an average total score variable of only 0,24. Detailed results for each indicator are shown in Figure4.
Table 6: Reliability Test Results
| Reliability Statistics | |
|---|---|
| Croìnbach's Alpha | N oìf Items |
| 0.773 | 26 |
Table 7: Borda Score for each criterion
| Criterion | (n) | n- 1 | Borda Score |
|---|---|---|---|
| VO (Very Often) | 4 | n-1= 4-1 | 3 |
| FO (Frequent Occurrence) | 3 | n-1= 3-1 | 2 |
| R (Rare) | 2 | n-1= 2-1 | 1 |
| VR (Very Rare) | 1 | n-1= 1-1 | 0 |
Table 8: The Weight of Each Material Waste Indicator
| No. | Variable | Indicator (X) | Indicator of factors causing waste | Number of respondents | Indicator Value (X) | Weight | |||
|---|---|---|---|---|---|---|---|---|---|
| VO (3) | FO (2) | R (1) | VR (0) | ||||||
| 1 | Defect | X1.1 | Material damaged by weather | 4 | 6 | 8 | 2 | 32 | 0,26 |
| X1.2 | Damage on the work tool | 2 | 6 | 10 | 2 | 28 | 0,23 | ||
| X1.3 | Incorrect implementation of work rules | 9 | 5 | 4 | 2 | 41 | 0,33 | ||
| X1.4 | The existence of a design change | 2 | 5 | 6 | 7 | 22 | 0,18 | ||
| 2 | Over Production | X2.1 | Lack of material optimization on the project | 3 | 7 | 6 | 4 | 29 | 0,31 |
| X2.2 | Over use of materials that exceed the needs | 11 | 2 | 5 | 2 | 42 | 0,45 | ||
| X2.3 | Design changes | 1 | 7 | 6 | 6 | 23 | 0,24 | ||
| 3 | Waiting | X3.1 | Duration of material arrival | 0 | 8 | 3 | 9 | 19 | 0,20 |
| X3.2 | Out of materials or not yet available | 1 | 7 | 5 | 7 | 22 | 0,19 | ||
| X3.3 | Loss of tools | 5 | 3 | 6 | 6 | 27 | 0,28 | ||
| X3.4 | Equipment incompatibility | 4 | 5 | 5 | 6 | 27 | 0,28 | ||
| 4 | Over Processing | X4.1 | Inconsistency of work procedures | 13 | 2 | 4 | 1 | 47 | 0,42 |
| X4.2 | Poor equipment maintenance | 5 | 6 | 5 | 4 | 32 | 0,29 | ||
| X4.3 | Failure to combine tools | 7 | 4 | 4 | 5 | 33 | 0,29 | ||
| 5 | Motion | X5.1 | Inappropriate work layout | 2 | 5 | 7 | 6 | 23 | 0,19 |
| X5.2 | Poor work place management | 3 | 7 | 3 | 7 | 27 | 0,22 | ||
| X5.3 | Inconsistent working method | 9 | 6 | 3 | 2 | 42 | 0,36 | ||
| X5.4 | Unergonomic equipment | 5 | 5 | 4 | 6 | 29 | 0,25 | ||
| 6 | Transportation | X6.1 | Materials scattered in the project area | 5 | 3 | 3 | 9 | 24 | 0,24 |
| X6.2 | Ineffective layout of work place | 5 | 6 | 3 | 6 | 30 | 0,30 | ||
| X6.3 | Ordering materials that are too far away | 3 | 4 | 5 | 8 | 22 | 0,22 | ||
| X6.4 | Inappropriate delivery schedule | 3 | 3 | 8 | 6 | 23 | 0,23 | ||
| 7 | Inventory | X7.1 | Poor storage space | 8 | 2 | 1 | 9 | 29 | 0,28 |
| X7.2 | Limited material storage locations | 3 | 4 | 9 | 4 | 26 | 0,25 | ||
| X7.3 | Improper strorage techniques for material and equipment | 4 | 2 | 9 | 5 | 25 | 0,24 | ||
| X7.4 | Material damaged due to too long storage | 4 | 3 | 6 | 7 | 24 | 0,23 | ||
| Average | 0,268 | ||||||||
Based on Figure 4, the leading indicator identified as the most influential cause of waste material in the defect variable is X1.3, which represents incorrect implementation of work rules. This condition is reflected by rebar waste (Figure3a) due to incorrect measurements and cutting, with a weight of 0,33. In the over-production variable, the most significant contributor to material waste is X2.2, namely the overuse of materials that exceed the needs, with a weight of 0,45. For the waiting variable, the highest contributing indicator is X3.3, which refers to the loss of tools, with a weight of 0.28. In the over-processing variable, X4.1, representing inconsistency of work procedures, has the highest weight at 0.42. The motion variable shows X5.3, an inconsistent working method, as

the most influential indicator, with a weight of 0.36. The transportation variable, X6.2, which represents an ineffective workplace layout, is identified as the highest indicator, with a weighted score of 0.30. The last variable, inventory, X7.1 concerning poor storage space, emerges as the most influential indicator contributing to material waste, with a weight of 0.28.
4. Discussion
Based on observations at the construction site, incorrect or inconsistent implementation of work rules was found in the project site. Instances were noted where workers installed rebar in the wrong order or used improper welding techniques, resulting in deformed rebar that required repair or replacement. Excessive purchasing and overuse of materials are necessary due to the contractor's policy to provide excess materials than planned quantities to ensure immediate replacement in case of damage or shortage. This practice has resulted in significant material residues, especially D16 rebar. Lost tools and prolonged lead times can delay project completion and require additional time. Based on the results of observations in the field, the tools that were moved to the storage warehouse were not well organized, so the tools were difficult to find and were even lost when needed. This can lead to prolonged wait times for operators to find the tool. The inconsistency of work procedures at the project site was an improper and inefficient process of cutting or bending rebars. Improper cutting of rebar can cause material to be wasted and more material to remain. Inconsistent working methods were found in the project, as a consistent standard for picking up or placing tools and materials. Workers have to walk back and forth to find the necessary tools and place materials, causing workers to perform excessive movements. Ineffective workplace layout in the project location is due to work activities that use the path of material cars passing through and the location of the ready-mix concrete plant, which is relatively far from the project site. As mentioned earlier, poor storage space can also lead to the loss of tools. Insufficient and irregular storage can damage materials such as cement, making it difficult for workers to find and access them on time.
Among the 26 indicators assessed, the overuse of materials and inconsistent work procedures emerged as the most influential contributors to material waste. Overproduction often manifests as surplus materials, unused offcuts, or the need for extra resources. Overproduction can result not only from errors in cutting, shaping, or installation—reflecting workmanship issues and limited skills—but also from inadequate managerial supervision. Additionally, overprocessing caused by inconsistent work procedures increases the chance of rework, such as components being installed out of sequence and requiring removal and reinstallation. Rework itself is one of the main contributors to material waste in construction projects. Similar findings are reported in other studies, which identify issues such as improper material storage35), inaccurate measurements in the project, cutting errors36), inconsistent following the correct sequence of work35), poor time discipline, and design changes25). These studies indicate an average rebar waste of approximately 4%. In construction practice, the acceptable threshold for material waste is generally 5%37). However, the present findings reveal that D16 rebar waste reaches 11%, exceeding the 6.3% reported by Yuni et al (2023)37), and 10.50% noted by Pradana and Putra (2024)21), and surpassing the industry’s typical 5% limit. This indicates that material waste remains a significant challenge in the construction industry.
The existence of material waste can have an impact on efficiency, time, and cost. The level of garbage directly affects the achievement of the primary goal of lean construction, which is to maximize value and minimize waste during the construction process38). Material waste potentially impedes workforce productivity by introducing delays. For instance, an error in cutting rebar necessitates reordering new materials. This not only consumes additional time but also disrupts the project schedule, causing significant delays and reducing overall productivity. Furthermore, it will also incur more costs due to both material purchases and delays. Empirical evidence from previous studies has shown that the cost of materials as waste can be 0.53% 39), 3.30%40), 7.39 %21), and 7.5%41). Based on this, the cost impact of waste arising on the project varies from 0.5 to 8%, influenced by the type or complexity of the project and the effectiveness of project management itself.
Material waste is an inherent aspect of construction projects; however, it can be substantially reduced through the application of lean construction principles, which aim to eliminate waste and enhance value. Issues related to human error must be systematically addressed to prevent unnecessary material losses. This study identifies overuse of materials and inconsistent work procedures as the primary contributors to waste material. These issues can be mitigated by implementing lean construction principles, including the development of clear and standardized work instructions or specifications, the application of the Last Planner System to streamline tasks and improve workflow efficiency, and the adoption of simpler, more effective work methods42). Standardizing, for example, could be achieved by making a database and procedures for cutting, bending, and storing rebar to enhance process consistency. Additionally, project managers are also encouraged to implement visual mapping to monitor daily and weekly waste ratios, thereby reducing steel waste. Further measures involve optimizing the organization and storage of materials, training workers in efficient tool usage, and closely monitoring the accuracy of material quantities delivered to the project site36). The adoption of software such as Cutting Optimization Pro software to minimize rebar residual43) is also recommended.
In the Indonesian construction industry, the calculation of quantity take-off with the Building Information Modelling (BIM) approach has been quite popular, even though it has not yet been mandatory to use BIM-supporting software, such as Revit or Cubicost. The implementation of BIM in construction instructions reduced material waste, below 5%, which is 1.52%44), as it can help limit the potential for material waste in the construction project by setting maximum waste limits. BIM potentially minimizes errors in translating images in the field, enabling the project building to be as identical as possible to the 3D model, thereby reducing waste material in construction projects45). Another research showed that BIM could significantly reduce reinforced concrete materials (RRCMW), especially in rework, enhance coordination between project disciplines, transfer information efficiently46,47), and help monitor quality control during work by providing a complete visualization picture48,49)as well as managing the building life cycle47). It is also recommended that project management reduce rebar waste using precast concrete as it potentially reduces cutting and saves working time in construction projects.
5. Conclusion
This study successfully identified the types, main causes, and sources of waste materials in construction projects. Based on the research conducted on the construction project, even though the average rebar waste was below 5% (max tolerance for waste in the construction industry), the highest waste percentage is D16 rebar material, with a waste percentage of 11%. The findings indicate that material waste is not solely caused by operational errors (such as overuse of materials, inconsistency of work procedures, and inconsistent working methods) but also by poor planning, ineffective coordination, and unstable material flows. To effectively address material waste, project management must examine not only what waste is, but also why and where it occurs, providing a more accurate diagnosis. Planning should not only focus on schedule and cost, but also on explicitly mapping and planning the material flow from suppliers to the point of installation. This includes planning temporary storage points (staging areas), implementing Just-In-Time delivery schedules, and enforcing material quality control. Strict implementation of Lean Construction principles has the potential to significantly reduce material waste. While this study has been trying to implement the LC concept, implementation was not always consistent. Additional methods can support the LC principle, such as using Cutting Optimization Pro software and BIM software. Further research could explore the effectiveness of integrating LC with Building Information Modelling (BIM) technology and the Internet of Things (IoT) to create an early warning system for waste generation.
Acknowledgement
The authors would like to thank Universitas Islam Riau for supporting this publication, and the respondents and contractor who provided the research data.
References
- B. Witjaksana, and S.P. Reresi, “Project cost analysis using the earned value method in performance process (case study on the Widya Mandala Pakuwon Citi-Surabaya Catholic University development project),” Jurnal Teknik Sipil Untag Surabaya, 11 (02) 45–56 (2012).
- R.S. Sanusi, Sulistyoweni, and B. Trigunarsyah, “The Problem of Waste/Unnecessary Costs in Construction Implementation in Indonesia," in: Commemoration of 25 Years of MRK Education in Indonesia, Institut Teknologi Bandung, 1–9 (2014).
- M. Solichin, “Analysis of Differential Power of Questions, Level of Difficulty, Validity of Test Items, Interpretation of Test Results and Validity of Predictions in Educational Evaluation,” Dirasat: Jurnal Manajemen & Pendidikan Islam, (2) 192–213 (2017). www.depdiknas.go.id/evaluasi-proses-.
- M. Adi Widyatmika, and N.B. Bolia, “Unveiling segregation and composting behavior in urban communities: a case study of Sarbagita municipality, Indonesia,” Evergreen Joint Journal of Novel Carbon Resource Sciences & Green Asia Strategy, 11 (02) 612–623 (2024).
- A. Zhumadilova, and S. Zhigitova, “Features of modern areas of solid waste disposal,” Evergreen Joint Journal of Novel Carbon Resource Sciences & Green Asia Strategy, 10 (02) 640–648 (2023).
- S.B.M. Akbar, and O.L. Sari, “Waste Analysis Using Lean Construction Approach in The Manggar River Bridge Project in Balikpapan,” Info Teknik, (1) (2022).
- S. Intan, R.S. Alifen, and L. Arijanto, “Analysis and Evaluation of Construction Material Waste: Sources, Quantities and Costs,” Civil Engineering Dimension, 7 (1) 36–45 (2005). http://puslit.petra.ac.id/journals/civil.
- Y. Hanafiah, “Analysis of Waste Material in Wall Plastering Work,” Yogyakarta, 2019.
- N.E.M. and M.L. Pattiapon, “Implementation of Lean Construction on PT. Pesona Graha Mandiri Ambon to Reduce Non-Added Value Activity,” National Seminar “Archipelago Engineering” (ALE), (2018).
- W.I. Budi, “Identification of Factors Causing Construction Delay Analysed Using Lean Construction Concept (Case Study of The Mall X Construction Project),” Depok, 2010.
- C. Igwe, A. Hammad, and F. Nasiri, “Influence of lean construction wastes on the transformation-flow-value process of construction,” International Journal of Construction Management, 22 (13) 2598–2604 (2022). doi:10.1080/15623599.2020.1812153.
- A. Husen, “Project Management,” Yogyakarta, 2011.
- M. G. Tamallo and A. Nursin, “Evaluation of Non-Physical Waste Using Lean Construction in Sanggala Construction Project,” PROKONS: Jurnal Teknik Sipil, 12–18 (2020).
- S. Ap and F. Firdaus, “Construction Waste: Identification of its Potentials and Causes in Housing Project in Pekanbaru,” Jurnal Saintis, 19 (02) 79 (2019). doi:10.25299/saintis.2019.vol19(02).3904.
- M.I.S. Othman, R. Zainal, N. Kasim, and M.H.I.A. Rahim, “Project Management Practices to Empower Lean Construction in Malaysia’s Construction Industry,” Research in Management of Technology and Business, 4 (1) 961–978 (2023). doi:10.30880/rmtb.2023.04.01.068.
- A.J. Gultom, and A. Sutandi, “Ranking and Factors causing of Material Waste in X Project in Serpong,” JMTS: Jurnal Mitra Teknik Sipil, 6 (2) 223–236 (2023).
- M.M. Sanaky, L.M. Saleh, and H.D. Titaley, “Analysis of the factors causing delays in the construction project of the MAN 1 Tulehu dormitory building, Central Maluku,” Jurnal Simetrik, 11 (1) 432–439 (2021).
- D. Harpriani Dewi and Sapitri, “Study of waste time and implementation of value stream mapping for sloof and column work,” Jurnal Saintis, 24 (01) 49–60 (2024).
- M.A. Marhani, N.A.S.M. Othman, and N.A.A. Ismail, “Issues and impact of lean construction implementation in the Malaysian construction industry,” International Journal of Sustainable Construction Engineering and Technology, 12 (3 special issue) 258–268 (2021). doi:10.30880/ijscet.2021.12.03.025.
- B. Sayed, K. Venkatesh, and S.S. Asadi, “Evaluation of reducing waste materials in construction projects using ranking analysis,” International Journal of Civil Engineering and Technology (IJCIET), 9 (3) 831–838 (2018).
- A. Pradana, and I.N.D.P. Putra, “Waste level and cost analysis of steel reinforcement work in construction projects,” Jurnal Ilmu Teknik, 1 (4) 156–162 (2024). doi:10.62017/tektonik.
- John Bicheno, “The Lean Toolbox: The Essential Guide to Lean Transformation,” 6th ed., PICSIE Books, Buckingham, Inggris Raya, 2020.
- D.G. Saari, “Selecting a voting method: the case for the borda count,” Constitutional Political Economy, 34 (3) 357–366 (2023). doi:10.1007/s10602-022-09380-y.
- L.J. Koskela, and J.A. Rooke, “Which are the wastes of construction?,” in: Proceedings IGLC, Fortaleza, Brazil, 3–12 (2013). https://www.researchgate.net/publication/290543537.
- Suripto, and A.R. Susanti, “Waste evaluation and implementation of lean construction for the campus X building project,” Jurnal Rivet (Riset Dan Invensi Teknologi), 1 (2) 65–72 (2021).
- R. Atkinson, and J. Flint, “Accessing Hidden and Hard-to-Reach Populations: Snowball Research Strategies,” United Kingdom, 2001.
- N. Nurdiani, “Snowball sampling technique in field research,” ComTech, 5 (2) 1110–1118 (2014).
- J.T. Chan, “Snowball Sampling and Sample Selection In A Social Network,” in: The Economic of Networks - Advances in Econometrics, Emerald Group Holdings Ltd, 61–80 (2020). doi:10.1108/S0731-905320200000042008.
- L.E.C. Rocha, A.E. Thorson, R. Lambiotte, and F. Liljeros, “Respondent-driven sampling bias induced by community structure and response rates in social networks,” J R Stat Soc Ser a Stat Soc, 180 (1) 99–118 (2017). doi:10.1111/rssa.12180.
- H.K. Mohajan, “Two criteria for good measurements in research: validity and reliability,” Annals of Spiru Haret University. Economic Series, 17 (4) 59–82 (2017). doi:10.26458/1746.
- T.J. Sitinjak, and Sugiarto, “Lisrel,” first, Graha Ilmu, Yogyakarta, 2006.
- M. Ulum, “Validity and Reliability Test,” First, Malang, 2016.
- Sugiono, “Statistics for Research,” CV Alfabeta, Bandung, 2007.
- Alan. Agresti, and Barbara. Finlay, “Statistical Methods for The Social Sciences,” 4th Edition, Pearson Prentice Hall, 2009.
- H. Sujakhu, and W. Jutidamrongphan, “Generation of construction waste in hydroelectric power station in nepal,” EVERGREEN Joint Journal of Novel Carbon Resource Sciences & Green Asia Strategy, 11 1613–1624 (2024).
- P.O. Lestari, S.A.K.A. Uda, and W. Nuswantoro, “Identification of waste material handling based on the views of contractors and consultants in Palangkaraya,” Serambi Engineering, VII (3) (2022).
- N.K.S.E. Yuni, N.P.I. Yuliana, and I.K. Sudiarta, “Analysis of rebars waste material in an effort to control construction material waste,” Jurnal Teknik Sipil Terapan, 5 (1) 22–29 (2023). http://jurnal.polimdo.ac.id/.
- A. Inge, and A.P. Waghmare, “Advances in construction: lean construction for productivity enhancement and waste minimization,” International Journal of Engineering and Applied Sciences (IJEAS), 2 (11) (2015).
- S. Agus Bambang, M.A. Salim, and A. Prastiawati, “Evaluation of construction material waste: case study of The Faculty of Syariah Building IAIN Pekalongan Construction Project,” 2022.
- R.R. Faruki, and H. Wiyanto, “Analysis of material waste and causal factors in X apartment project,” JMTS: Jurnal Mitra Teknik Sipil, 6 (4) 863–872 (2023).
- H. Sulistio and M. Wati, “Analysis of factors of rebars material waste loss from reinforced concrete in multi-storey building,” Jurnal Muara Sains, Teknologi, Kedokteran Dan Ilmu Kesehatan, 5 (1) 235 (2021). doi:10.24912/jmstkik.v5i1.10120.
- M.S. Bajjou, and A. Chafi, “The potential effectiveness of lean construction principles in reducing construction process waste: an input-output model,” Journal of Mechanical Engineering and Sciences, 12 (4) 4141–4160 (2018). doi:10.15282/jmes.12.4.2018.12.0358.
- I.G.N.E. Pratama, I.G.M. Sudika, and E.L.B. Saputra, “Analysis of rebar scraps using Cutting Optimization Pro software in building construction,” Jurnal Teknik Gradien, 15 (02) 30–38 (2023). http://www.ojs.unr.ac.id/index.php/teknikgradien.
- B.A. Rinengga, A. Trisiana, and W.Y. Widiarti, “Calculation of waste materials in the Ngudi Waluyo Hospital Intensive Care Unit (ICU) construction project in Blitar,” Jurnal Rekayasa Sipil Dan Lingkungan, 8 (1) 15–25 (2024).
- Sapitri, F.A. Aziz Azizi, A. Yulianti, D.P. Retno, Elizar, and B. Susanti, “Application of BIM Technology in Construction Industry for Modeling, Quantity Takeoff, and Scheduling Simulation,” in: 2025 7th International Conference on Smart Applications, Communications and Networking, SmartNets 2025, Institute of Electrical and Electronics Engineers Inc., Istanbul, 2025. doi:10.1109/SmartNets65254.2025.11106790.
- U. Bharadwaj, and A. Singh, “Sustainable green construction practices using Griha parameters and BIM tools implementation on building design,” Evergreen Joint Journal of Novel Carbon Resource Sciences & Green Asia Strategy, 11 (03) 1641–1654 (2024).
- D. Singh, and A. Singh, “Role of building automation technology in creating a smart and sustainable built environment,” Evergreen Joint Journal of Novel Carbon Resource Sciences & Green Asia Strategy, 01 (10) 412–420 (2023).
- S. Hosny, A.H. Ibrahim, and Y. Nabil, “Reducing reinforced concrete materials waste in construction projects using building information modeling in Egypt,” Journal of Information Technology in Construction, 28 332–345 (2023). doi:10.36680/j.itcon.2023.017.
- R.F. Prasetyo, R.A. Darmawan, and D.T. Setiamanah, “Evaluation of rebar waste rate calculation model utilizing building information modelling function: high rise building case study,” APTISI Transactions on Technopreneurship, 5 (2) 128–135 (2023). doi:10.34306/att.v5i2.298.