
Abstract
This study demonstrates the novel application of mixture design in the optimization of biocomposites using mixtures of cocoa pod husk powders (CPHP), tamarind shell powders (TSP), and polylactic acid (PLA). From the experimental results, the hardness value varied between 72.15 ± 3.24 and 79.96 ± 2.52 HRL. Regression and ANOVA analysis indicated significant nonlinear and interaction effects among the components. PLA had the most dominant positive effect, while excessive filler content reduced the biocomposite properties, owing to aggregation and weak interfacial bonding. The optimal formulation of the biocomposite is 5.35 wt% CPHP, 14.65 wt% TSP, and 80.0 wt% PLA with a predicted hardness value of 80.06 HRL. This study offers new perspectives in the optimization of multiple fillers in biocomposite materials, and the effective utilization of waste materials in the development of sustainable materials.
Keywords: agricultural waste reinforcement, mixture design, PLA biocomposites, surface hardness, sustainable materials
Outline
1. Introduction
The rising concern about the environmental impacts of petroleum-based plastics has created a much greater interest in the development of sustainable and biodegradable polymer materials. Biocomposite materials reinforced with agricultural residues have been identified as new alternative materials. The utilization of agricultural waste as reinforcing materials not only supports the development of sustainable materials, but also contributes to the effective management of biomass residues generated from agro-industrial activities. Consequently, polymer biocomposites reinforced with agricultural waste have become an important research focus for the development of environmentally friendly materials and the advancement of circular economy strategies. Natural materials have been widely incorporated into polymer composites to improve various properties such as biodegradability, availability, low density, environmental compatibility, durability and mechanical performance, including strength, toughness and stiffness1,2). Natural fibers from agricultural waste can be extracted from fruits, leaf and plants such as jute, flax, sisal, coconuts, oil palm, durian skin, bananas and many from waste to produce reinforcement3,4). Due to these advantages, natural fiber-reinforced composites have found increasing applications in several industrial sectors, including furniture, packaging, construction, automotive components, electrical products, textiles, and energy-related applications5,6). The shells of fruits can be utilized as potential reinforcing materials in polymer biocomposites, providing a sustainable resource while also contributing to waste reduction7).
Polylactic acid (PLA) is one of the most widely used biodegradable thermoplastic polymers due to its excellent biocompatibility, renewability, transparency and relatively good mechanical properties8). PLA is derived from renewable resources such as corn starch, sugarcane, beet and potato9). PLA has already found wide use in applications such as biomedicine, food packaging, electronics, tissue scaffolds and other consumer products10,11). However, despite these advantages, pure PLA has some limitations, such as low tensile and low impact strength, brittleness and limited thermal ductility, which restrict its application as an engineering material. To improve these limitations, PLA-based composites reinforced with natural fibers or fillers can enhance mechanical and physical properties10,11). Nikhil et al.12) studied that the development of novel PLA/henna natural fillers using the fused deposition modelling (FDM) technique can enhance mechanical performance. The report shows that adding henna powder to PLA biocomposites for manufacturing improved the tensile, compressive and flexural properties, when the filler content was optimized. Kaveh et al.13) developed PLA-based bio-composites reinforced with bamboo charcoal and continuous silk fibres for pellet-fed 3D/4D printing. The composites exhibited significantly improved mechanical strength and thermo-mechanical stability compared with pure PLA. Ahmad et al.14) developed PLA biocomposites reinforced with banana peel powder (BPP) and evaluated their mechanical, thermal and viscoelastic properties. They reported that optimal filler loading significantly improved composite performance.
Agricultural residues such as cocoa pod husks (CPH) and tamarind shells (TS) are abundant sources of biomass waste in many tropical countries. These materials are primarily composed of lignocellulosic components. CPH consists of cellulose (26%), hemicellulose (13%) and lignin (28%)15), while TS consists of cellulose (19.22%), hemicellulose (47.5%) and lignin (18.8%)16). These components provide relatively high stiffness and rigidity. Due to these characteristics, powders derived from CPH and TS have the potential to act as reinforcing fillers in polymer matrices. In addition to providing mechanical reinforcement, the use of such biomass residues also adds value to agricultural waste, while reducing environmental disposal problems. Therefore, the incorporation of these waste-derived fillers into biodegradable polymers such as PLA presents a promising approach for developing sustainable composite materials.
Among the various mechanical properties of polymer composites, surface hardness is an important parameter reflecting a material's resistance to indentation, abrasion and surface deformation. Hardness is crucial in determining the durability and wear resistance of polymer-based products, especially for packaging materials, consumer products and biodegradable household items. While several studies have examined the impact of natural fillers on the tensile and flexural properties of PLA composites10,12,13), little research has addressed the optimization of surface hardness using statistical formulation approaches. In particular, the combined impact of various agricultural waste fillers on the hardness of PLA biocomposites remains largely unexplored.
Statistical experimental design techniques, such as mixture design, offer an effective way of evaluating how component proportions influence material properties, and of identifying optimal formulations5,8,16). Unlike conventional experimental methods, mixture design enables the systematic investigation of interactions between mixture components, while reducing the number of experimental runs required. Among the available mixture design methods, the extreme vertices design is particularly well-suited to systems with constrained component ranges16).
The aim of this study is to investigate the surface hardness of PLA biocomposites reinforced with CPHP and TSP using this approach. The effects of filler composition on hardness performance were analyzed, and the optimal formulation for maximizing hardness was determined. The findings of this study will contribute to the development of sustainable, environmentally friendly PLA-based biocomposites, reinforced with agricultural waste powders.
2. Materials and Methods
2.1. Materials
Polylactic acid (PLA) pellets (grade 3052D, supplied by NatureWorks LLC, USA) were used as the polymer matrix in this study, due to their biodegradability and favourable processing characteristics. According to the supplier, the PLA had a density of approximately 1.24 g/cm³, a melt flow index of 35 g/10 min (190 °C, 2.16 kg), a glass transition temperature of 55–60 °C, and a melting temperature of approximately 200 °C17). Cocoa pod husks (CPH) and tamarind shells (TS) were collected from agricultural waste sources in Phetchabun Province, Thailand, and used as fillers. The raw materials were thoroughly washed with distilled water to remove impurities and contaminants, followed by oven drying at 60 °C for 24 hours to reduce moisture content. The dried materials were then ground into powders using a grinder machine operating at 500 rpm (Charatchai Machinery, Thailand) and subsequently sieved to obtain particle sizes ranging from 106–500 µm. Selection of the particle size range was done to ensure even distribution of fillers during melt blending and biocomposite formation. The powders were stored in sealed containers after preparation to prevent moisture absorption prior to processing.
2.2. Experimental method
A mixture design approach was employed to determine the optimal formulation of the biocomposites. An extreme vertices design was selected because the mixture components were subjected to constrained composition ranges. The design was used to investigate the effects of component proportions on the surface hardness of the biocomposites. The three independent variables consisted of cocoa pod husk powder (CPHP; X₁), tamarind shell powder (TSP; X₂), and polylactic acid (PLA; X₃). The range for each component was defined as follows: X1: 5–30 wt%, X2: 10–30 wt%, X3: 70–80 wt%. The total composition of the mixture is constrained to 100% or 1.0018). These constraints were selected based on preliminary experiments, in order to ensure proper melt blending and specimen fabrication. Table 1 summarizes the experimental formulations and their corresponding hardness values based on the mixture design generated using Minitab statistical software version 19 (Minitab Inc., USA). A quadratic regression equation was used to model the relationship between the independent and dependent variables. A regression analysis to estimate the coefficients was performed in accordance with Equation (1).
where Y represents the response (hardness), 1, 2, 3 represent the linear effects of each component, 12, 13, 23 are the interaction effects between the components, while X₁, X₂, and X₃ denote the proportions of CPHP, TSP and PLA, respectively. The regression coefficients were calculated based on the actual proportions of each component in the mixture design. Analysis of variance (ANOVA) was conducted to evaluate the adequacy and statistical significance of the regression model, as well as to determine the significance of individual and interaction effects of the mixture components on hardness19). The regression model was subsequently employed to predict the optimal formulation that maximizes hardness response.
2.3. Biocomposite fabrication
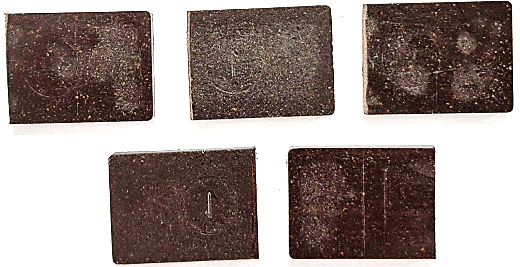
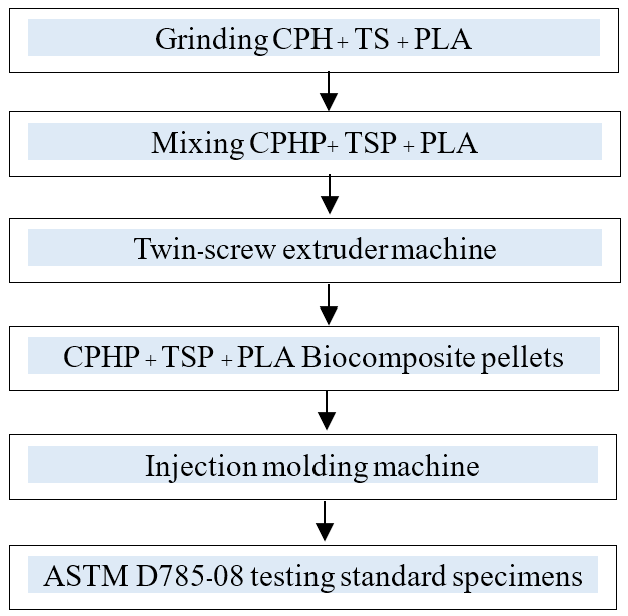
The biocomposite production is based on the mixture design method with nine formulations, consisting of CPHP, TSP and PLA, as presented in Table 1. Before processing, the PLA pellets and filler powder from each formulation were mixed and melted/blended together using a twin-screw extruder (Labtech Engineering, Thailand). This process melting temperature consists of ten zones, ranging from 100 to 180 °C, with a screw speed of 40 to 80 rpm, to create biocomposite pellets. The obtained pellets were then subjected to drying at 60 °C in an oven for 4 h, and the aim was to get rid of the moisture present before carrying out injection molding. This step reduced PLA hydrolysis degradation during processing to improve the quality of the biocomposites. The pellets were then transferred to a mold using an injection molding process. Injection molding was carried out on an Arburg Allrounder 470 E (Arburg GmbH, Germany). The barrel heating profile comprised four zones set at 180, 180, 190 and 200 °C from the rear zone to the nozzle, with a resulting melt temperature of approximately 200 °C. The mold temperature, injection pressure, and flow rate were maintained at 60 °C, 1,200 bar, and 12 cm³/s, respectively. They were then removed from the mold and cut into 25.4 x 25.4 x 6 mm specimens according to ASTM D785-0820), as shown in Figure 1. The biocomposite fabrication process is presented in Figure 2.
Table 1: Experimental compositions and hardness values
| Run no. | Component (wt%) | Hardness (HRL) | ||
|---|---|---|---|---|
| X1 | X2 | X3 | ||
| 1 | 10.00 | 15.00 | 75.00 | 76.52 ± 4.20 |
| 2 | 20.00 | 10.00 | 70.00 | 72.15 ± 3.24 |
| 3 | 7.50 | 15.00 | 77.50 | 77.89 ± 5.34 |
| 4 | 5.00 | 15.00 | 80.00 | 79.96 ± 2.52 |
| 5 | 10.00 | 12.50 | 77.50 | 77.25 ± 4.29 |
| 6 | 7.50 | 20.00 | 72.50 | 75.56 ± 3.31 |
| 7 | 10.00 | 10.00 | 80.00 | 79.17 ± 4.97 |
| 8 | 15.00 | 12.50 | 72.50 | 74.84 ± 4.04 |
| 9 | 5.00 | 25.00 | 70.00 | 73.51 ± 3.97 |
2.4. Mechanical test
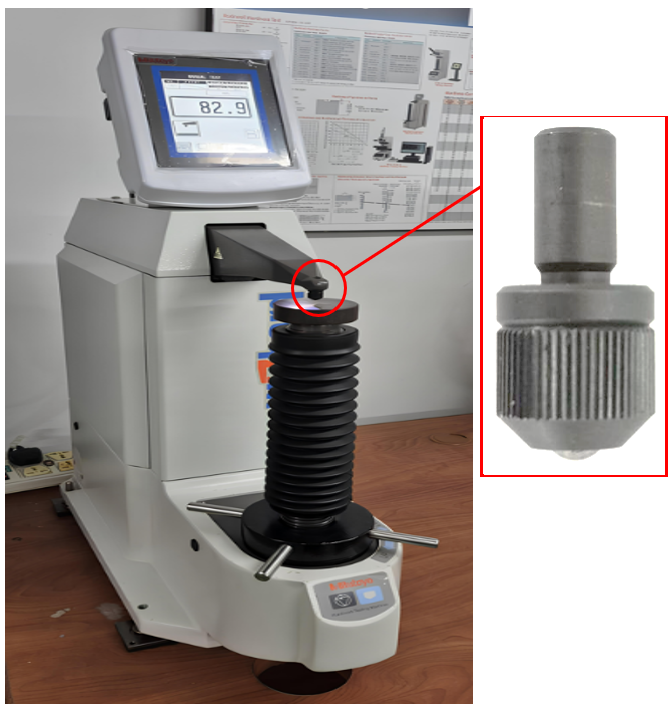
The hardness properties of the fabricated biocomposites were evaluated in accordance with ASTM D78521), using a Rockwell hardness tester (Mitutoyo, Japan) under the HRL scale. The tests were conducted using a 6.35 mm steel ball indenter with a 60 kgf major load and a dwell time of 10 s, as illustrated in Figure 3. Five specimens were tested for each formulation. To account for local variations, each specimen was measured at five different points, and the average hardness value was calculated. The reported hardness value is the mean and standard deviation (SD) of all the specimens tested in Table 1.
2.5. Morphological analysis
Scanning electron microscopy (SEM) was used to analyze the surface morphology, filler dispersion, and interfacial
characteristics of the fabricated biocomposites. Prior to SEM observation, the indentation surfaces obtained from Rockwell hardness tests were used as specimens. The specimens were sputter-coated using a 108auto sputter coater (Cressington Scientific Instruments, UK) at an accelerating current of 40 mA with a thin layer of gold to improve electrical conductivity and image quality. A Phenom XL g2 (Thermo Fisher Scientific, USA) was used to examine the SEM, and morphology was investigated using 10 kV accelerating voltage and 500× magnification.
3. Results and discussion
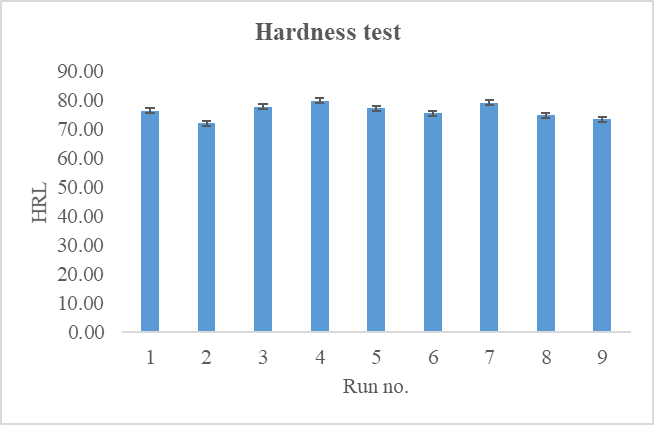
This section presents and discusses the results of the experimental design, focusing on the relationship between the mixture components and the hardness property of the biocomposite, as illustrated in Figure 4 and analyzed using the developed regression model. For baseline context, the Rockwell hardness of neat PLA grade 3052D (NatureWorks) has been reported in the range of 76.9–83 HR across various processing conditions22,23). This provides a benchmark against which the performance of the developed biocomposite formulations can be evaluated. The optimal formulation identified in this study, consisting of 5.00 wt% CPHP, 15.00 wt% TSP, and 80.00 wt% PLA, achieved a maximum measured hardness of 79.96 ± 2.52 HRL, comparable to neat PLA.
3.1. Analysis of variance (ANOVA)
The analysis was conducted at a 95% confidence level, with statistical significance defined at p < 0.0524,25). Table 1 presents the experimental design along with the corresponding hardness results of the biocomposites. The maximum hardness value was 79.96 ± 2.52 HRL (Run no. 4), while the minimum value was 72.15 ± 3.24 HRL (Run no. 2). The results of the ANOVA for hardness are summarized in Table 2. The regression model has a high significance level, with an F-value of 662.490 and a p-value of 0.000. This indicates that the model highlights the relationship between the mixture components CPHP (X1), TSP (X2) and PLA (X3) significant to improving the hardness. The linear terms have a highly statistically significant F-value of 9.560 and a p-value of 0.050. The quadratic terms have an F-value of 20.880 and a p-value of 0.016. However, the model's terms have an irrelevant effect on the surface hardness of biocomposites. The interaction terms between X1X2, X1X3 and X2X3 were also significant (p < 0.05), indicating the effect of the biocomposites’ resistance to surface hardness. The R² value of 99.91% model reflects a good fit. The R²(adj) value of 99.76% and the R²(pred) value of 99.14% are in close agreement, which demonstrates the model's high predictive capability and robustness9,16,26). Lack-of-fit analysis could not be performed because the experimental design did not include replicated runs, which are required for pure error estimation. The mathematical regression model is expressed in Equation (2).
A normal probability plot of the residuals was used to test the normality assumption of the hardness regression model. As can be seen in Figure 5, the residuals are roughly aligned with the reference line, indicating a normal distribution19).
Table 2: ANOVA for hardness
| Source | DF | Seq SS | Adj SS | Adj MS | F-Value | P-Value | |
|---|---|---|---|---|---|---|---|
| Regression | 5 | 52.789 | 52.789 | 10.558 | 662.490 | 0.000 | |
| Linear | 2 | 51.791 | 0.305 | 0.152 | 9.560 | 0.050 | |
| Quadratic | 3 | 0.998 | 0.998 | 0.333 | 20.880 | 0.016 | |
| X1*X2 | 1 | 0.390 | 0.799 | 0.799 | 50.120 | 0.006 | |
| X1*X3 | 1 | 0.156 | 0.573 | 0.573 | 35.950 | 0.009 | |
| X2*X3 | 1 | 0.452 | 0.452 | 0.452 | 28.360 | 0.013 | |
| Residual Error | 3 | 0.048 | 0.048 | 0.016 | |||
| Total | 8 | 52.837 | |||||
| R-sq = 99.91%, R-sq(adj) = 99.76%, R-sq(pred) = 99.14% | |||||||
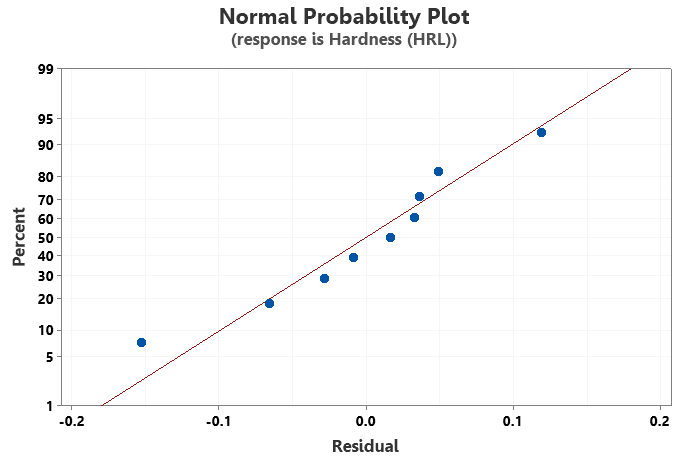
This confirms that the assumptions underlying ANOVA are satisfied and that the developed regression model is statistically valid for predicting hardness within the experimental domain27).
3.2. Main effect plot and interaction plot analysis
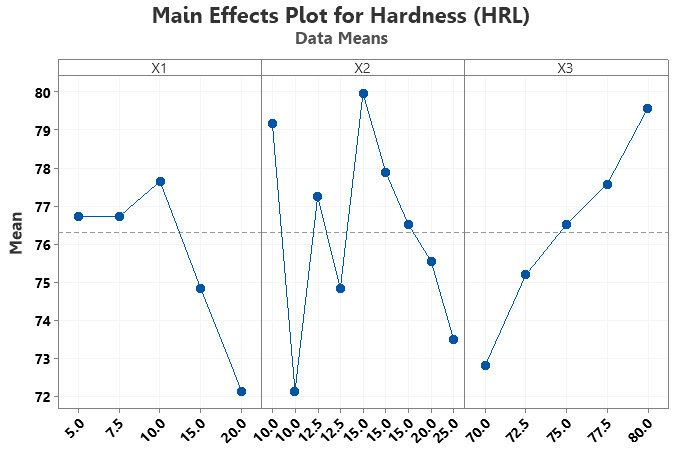
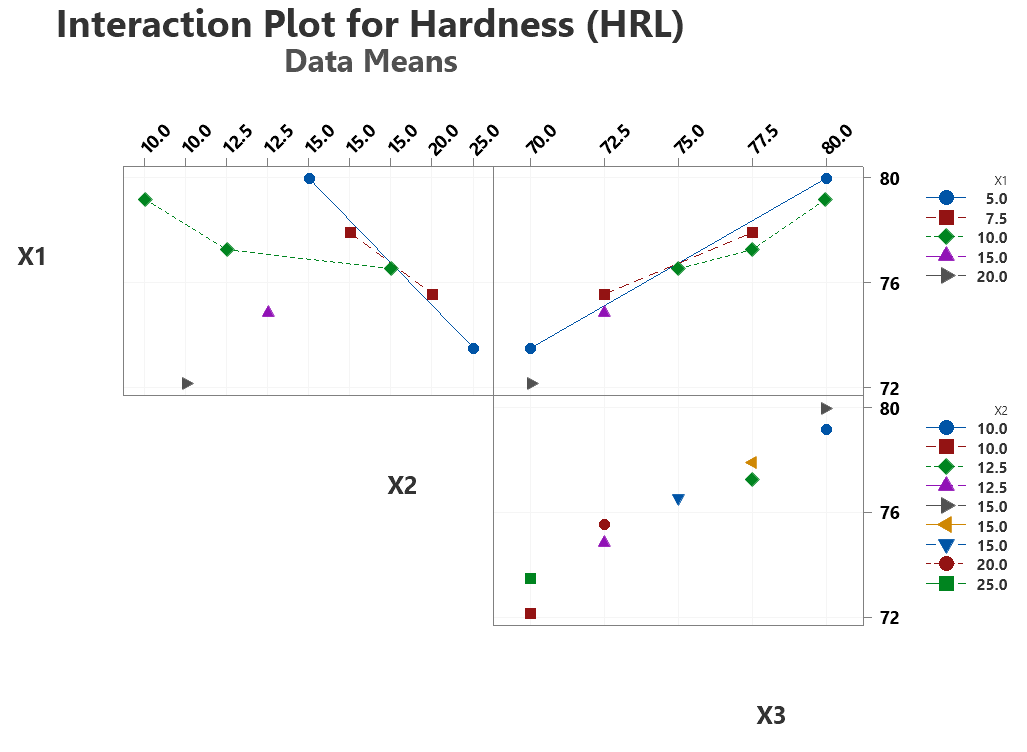
Figure 6(a) presents the main effect plot for the influence of each mixture component (X₁, X₂, and X₃) on the hardness. It can be observed that each component has a different trend indicating its influence on the response. In the case of CPHP (X₁), the hardness increases slightly at low concentrations, reaches a peak at about 10 wt%, and then decreases noticeably as the amount of the content increases28). This suggests that a moderate amount of CPHP contributes positively to a hardness of approximately 77.64 HRL. The greatest influence with regard to hardness was observed for TSP (X2), with mean values ranging from approximately 72.1 to 80.0 HRL. This indicates a non-monotonic response, with the maximum response obtained at approximately 15 wt%. Lower hardness was found at both higher and lower TSP levels. This indicates that there is an optimum level of TSP concentration beyond which its reinforcing efficiency begins to decrease. The trend for the PLA (X₃) showed that there was a consistent and monotonic trend in which the hardness increased progressively from 72.9 to 79.7 HRL. This means that the polymer matrix has a major effect on improving the hardness of the biocomposite. The results indicate that the content of X2 has an effect on the hardness, while the contents of X3 and X1 are not so dominant29). Figure 6(b) is the interaction plot matrix. It is a plot of the pairwise interaction effects between the mixture components X₁, X₂ and X₃ based on the mean values of the data. The non-parallel patterns of the lines in all the plots confirm the presence of statistically significant two-way interaction effects between the mixture components29,30). The interaction between X₁ and X₂ indicates that hardness reduces rapidly over the range of 80 to 73 HRL as the level of X₂ increases at low levels of X₁. However, it becomes less sensitive at high levels of X₁. This indicates that X₂ has a modulating effect. The interaction between X₁ and X₃ indicates that X₃ has a positive effect on hardness. However, it becomes less effective at high levels of X₁. This indicates a competitive interaction. The interaction between X₂ and X₃ indicates that a high level of X₂ reduces the effectiveness of X₃. This limits the maximum hardness.
3.3. Contour plot analysis for hardness
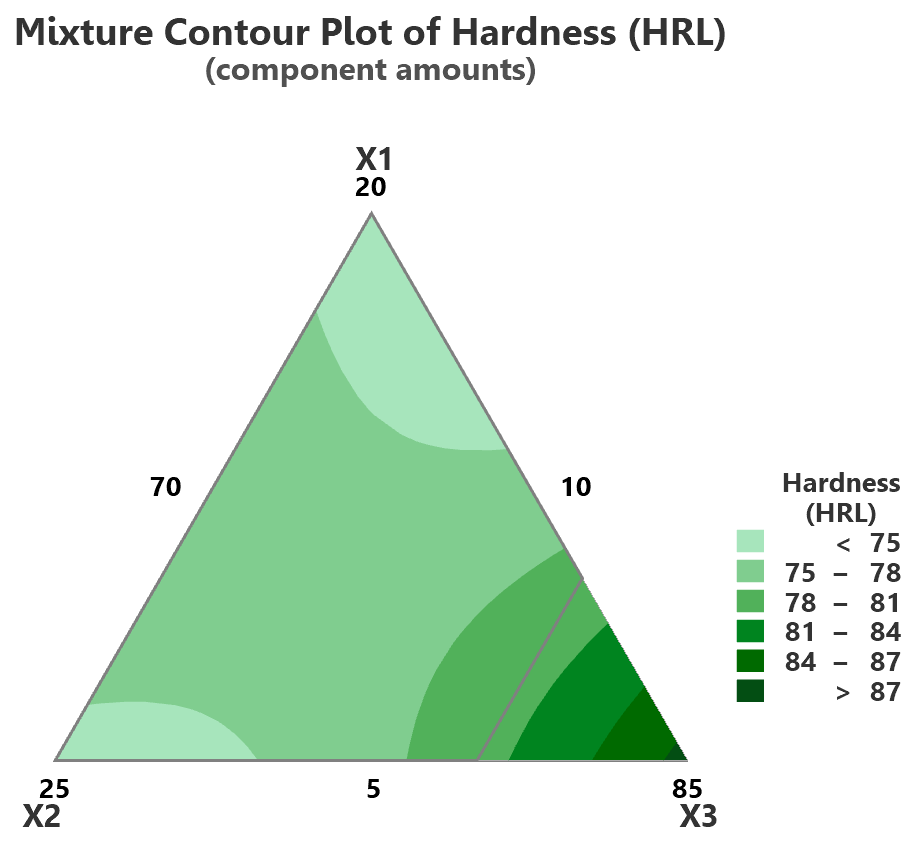
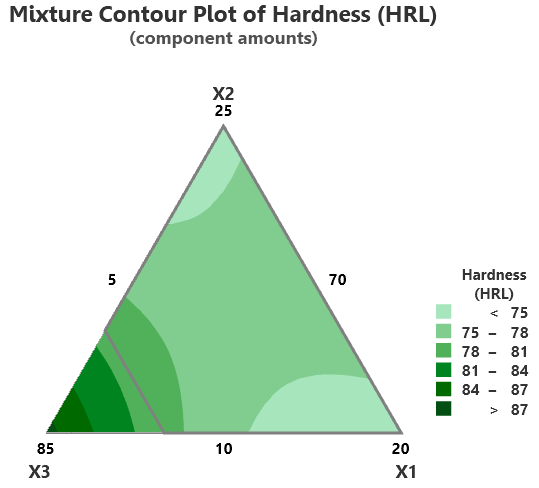
Figure 7 is a mixture contour plot that shows the combined effect of all three components, CPHP (X1), TSP (X2) and PLA (X3), on hardness across the experimental mixture design space. The ternary contour diagrams show that hardness is not evenly distributed throughout the mixture domain but varies significantly depending on the composition. Figure 7(a) shows a gradual increase in hardness from the X₁, X₂ dominant region (< 75 HRL) to the X₃ rich zone (> 84 HRL). This is consistent with the inhibitory role of X₂ at high concentrations. In Figure 7(b), the hardness distribution is bimodal, characterized by two spatially separated regions of high hardness located at the X₃ dominant vertex (> 84 HRL) and the X₁ dominant vertex (81–87 HRL), respectively. The maximum hardness (> 87 HRL) is localized around the apex of the structure, as can be seen in Figure 7(c) The near-horizontal bands of contours reinforce the sensitivity of hardness to the X₃ component. Here, reducing the ratio of X₃ from its maximum value results in a sharp decrease in hardness29,30).
3.4. Surface plot analysis for hardness
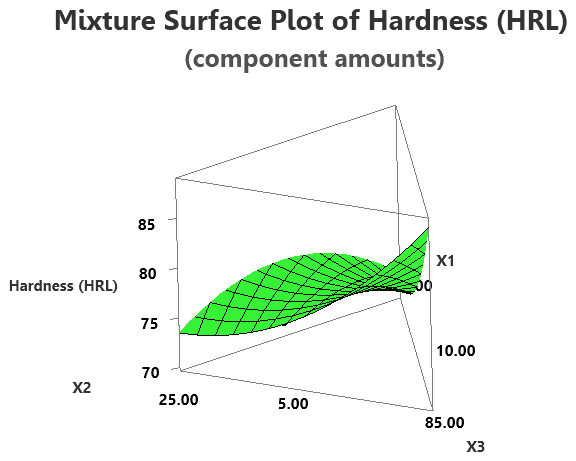
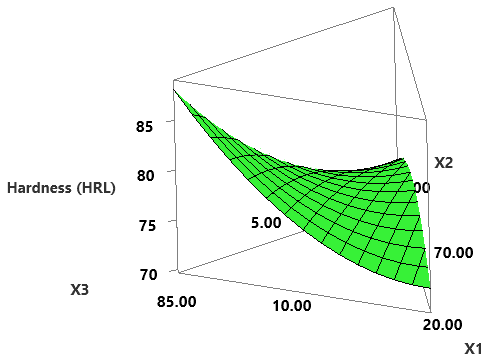
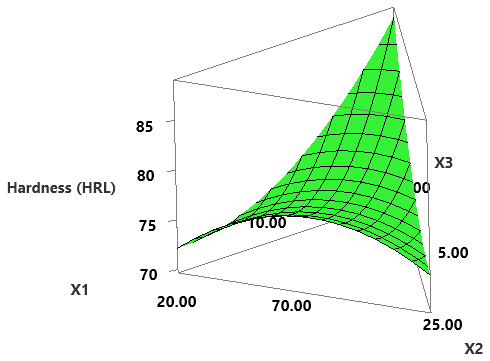
Figure 8 displays three-dimensional response surface plots of the mixture for hardness, showing how it varies as each of the three components is increased. This gives a spatial representation of the fitted mixture regression model over the experimental space. Figure 8(a) indicates that there is a smooth and monotonically increasing ascent along the X₃ axis on the response surface. The highest hardness values (~ 83-85 HRL) are found for high levels of X₃, and the lowest values (~ 70-73 HRL) are found for X₂ dominant compositions. This further supports that X₂ is effective and that X₃ enhances hardness in the X₂, X₃ binary mixture plane. Figure 8(b) shows the most complex response surface, which is characterized by a saddle-shaped geometry with two hardness peaks located at the X₃ and X₁ dominant vertices. These peaks are separated by a depression in the central surface at intermediate X, X₃ proportions. This non-monotonic saddle surface is the three-dimensional manifestation of an antagonistic binary interaction between X₁ and X₃, which corresponds to a negative cross-product coefficient in the fitted Scheffé mixture model31). The highest gradient of the surfaces is given in Figure 8(c). Hardness increases rapidly towards the apex of X₃ (> 85 HRL) from a relatively flat front plan with low hardness values in the X₁, X₂ region (~ 72–76 HRL). This near threshold response behaviour also lends
support to the view that X₃ is the main component of the mixture and that enrichment of this component is both necessary and sufficient30).

3.5. SEM Analysis
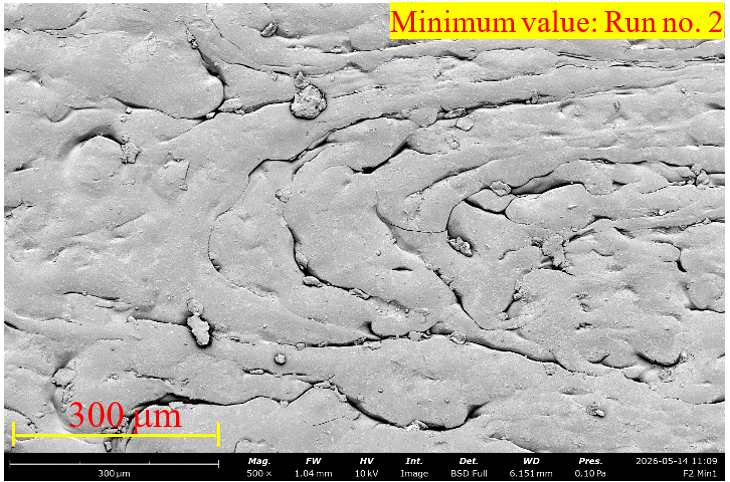
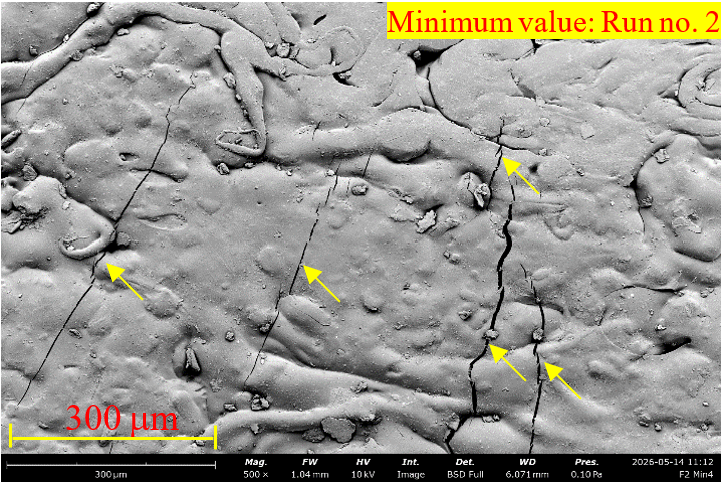
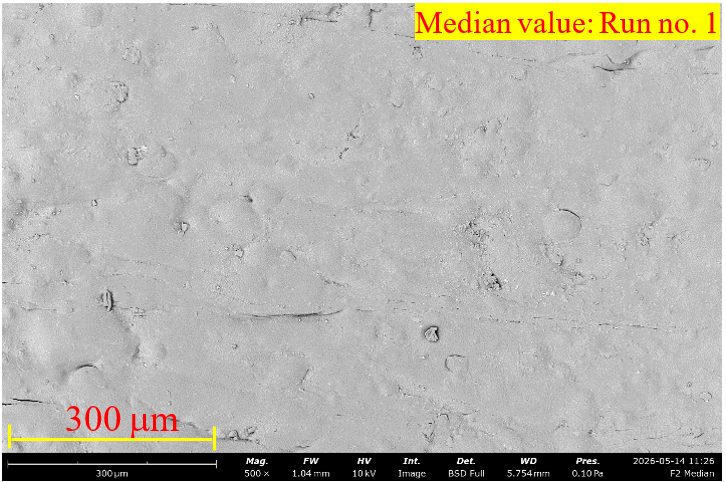
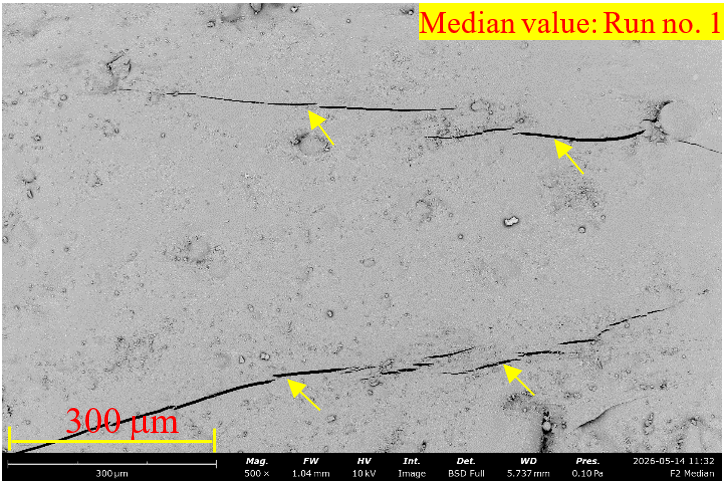
To elucidate the mechanistic basis of the observed hardness variation across the experimental formulations, SEM was conducted on the Rockwell indentation zones of three representative specimens selected to span the full range of hardness responses. These specimens corresponded to the minimum (Run no. 2), median (Run no. 1) and maximum (Run no. 4) measured hardness values. The goal of this comparative microstructural analysis is to establish a direct correlation between compositional variables, such as PLA matrix content and filler loading, and the surface deformation behaviour, crack propagation characteristics, and filler-matrix interfacial features observed at the indentation site.
Figure 9 presents SEM micrographs obtained from the Rockwell indentation zone of Run no. 2 (CPHP = 20 wt%, TSP = 10 wt%, PLA = 70 wt%), which exhibited the minimum measured hardness of 72.15 HRL in the experimental design. Figure 9(a) reveals a heavily deformed surface morphology characterized by plastic flow bands, interfacial voids and filler particle pullout, indicating that the PLA matrix at 70 wt% was insufficient to maintain structural continuity under the indenter load, resulting in poor stress transfer efficiency between the filler particles and the matrix. Figure 9(b) displays macro- crack formation, interfacial debonding and secondary crack branching propagating from the indentation zone (indicated by yellow arrows), confirming that crack propagation preferentially followed the weakened filler-matrix interfaces in a debonding-dominated failure mode32). The co-occurrence of plastic flow deformation and brittle crack propagation indicates a mixed-mode failure mechanism characteristic of PLA bio-composites with excessive filler loading. Collectively, these microstructural observations confirm that the hardness minimum at Run no. 2 is mechanistically attributed to CPHP agglomeration at supra-optimal loading, poor interfacial adhesion, and inadequate PLA matrix continuity. Figure 10 presents SEM micrographs from the Rockwell indentation zone of Run no. 1
(CPHP = 10 wt%, TSP = 15 wt%, PLA = 75 wt%), showing a median hardness response of 76.52 HRL. Figure 10(a) reveals a comparatively smoother and more homogeneous surface morphology than that observed at the lowest-hardness composition33), with reduced void density and the absence of extensive plastic flow bands, indicating that the increased PLA content (75 wt%) provided sufficient matrix continuity to partially resist indentation-induced deformation. Residual micro-voids and minor surface irregularities, however, suggest that interfacial adhesion between the fillers and the PLA matrix remained sub-optimal at this intermediate composition. Figure 10(b) displays semi-linear macro-cracks of reduced width propagating from the indentation zone (indicated by yellow arrows), with limited secondary crack branching, compared to Run no. 2, confirming greater fracture energy absorption by the higher PLA matrix content. Residual interfacial debonding observed along filler–matrix boundaries indicates that stress transfer efficiency, while improved, had not yet reached its maximum at this intermediate formulation. Collectively, the microstructural features of Run no. 1 are consistent with a transitional biocomposite behaviour.
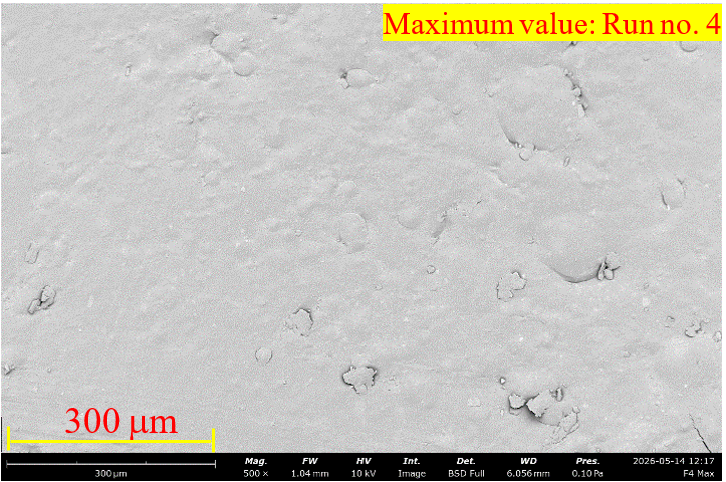
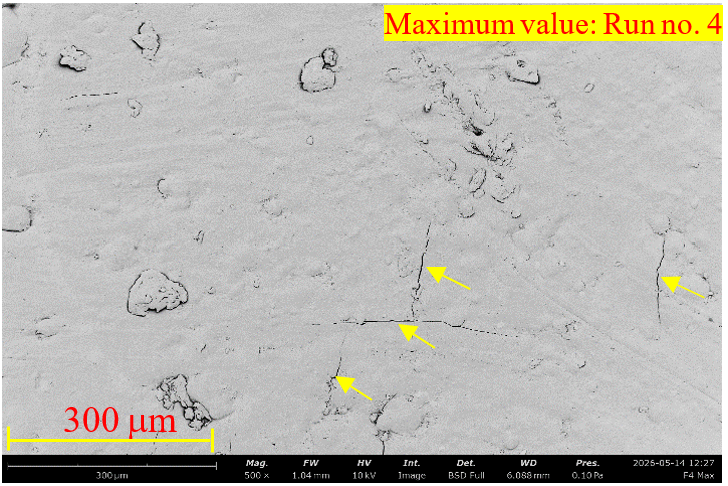
Figure 11 presents SEM micrographs from the Rockwell indentation zone of Run no. 4 (CPHP = 5 wt%, TSP = 15 wt%, PLA = 80 wt%), representing the maximum hardness response of 79.96 HRL in the experimental design. Figure 11(a) reveals the smoothest and most homogeneous
surface morphology among all examined specimens, with minimal void density, uniform filler particle distribution, and the complete absence of plastic flow bands or macro-scale surface deformation. These features collectively confirm that the elevated PLA content (80 wt%) established sufficient matrix continuity and rigidity to resist indentation-induced deformation effectively, while the reduced CPHP loading (5 wt%) minimized particle agglomeration and promoted uniform filler encapsulation within the matrix. Figure 11(b) displays only limited, short-range micro-cracks of narrow width propagating from the indentation zone (indicated by yellow arrows), with no significant secondary crack branching or interfacial debonding observed. The contained nature of crack propagation and the absence of filler pullout confirm strong filler-matrix interfacial adhesion and effective stress transfer efficiency at this optimal composition34). Collectively, the microstructural evidence from Run no. 4 demonstrates that maximum hardness is achieved through the synergistic combination of high PLA matrix continuity, uniform filler dispersion, and strong interfacial adhesion.
3.6. Response optimization
The response optimizer plot was used to find the optimum combination of the mixture components CPHP (X₁), TSP (X₂), and PLA (X₃) for maximizing the hardness of the biocomposite. The desirability function method was used,
where a desirability value, D, of 1.00035,36,37), indicating complete satisfaction of the optimization objective38,39). The optimum component settings identified by the optimizer were X₁ =5.350 (lower bound), X₂ = 14.650 (lower bound), and X₃ = 80.0 (upper bound) as shown in Figure 12. These optimum settings are in line with the directional trends of the main effects, contour, and surface response plots, thus collectively validating that optimization of hardness maximization is governed by X₃ enrichment and simultaneous X₁ and X₂ minimization. From the individual response curve plots, it is evident that X₁ has a monotonically decreasing effect on hardness, whereas X₂ has a non-monotonic concave curve, showing a minimum hardness at intermediate levels. On the other hand, X₃ has a consistently positive and accelerating effect on hardness, increasing monotonically towards its upper experimental limit. These response curve plots thus collectively validate that X₃ is the dominant hardness-controlling constituent. This confirms that the hardness of the biocomposite is primarily determined by the continuity of the matrix and the efficient transfer of stress within the material40).

4. Conclusions
The research study was able to successfully develop and optimize biocomposites incorporating CPHP (X1), TSP (X2) and PLA (X3) using the mixture design approach. The investigation of the effect of the proportions of the components on hardness was done using regression modelling, analysis of variance, and graphical analysis. Main effects, interaction plots, contour plots, and response
optimization were used. The key findings of this study can be summarized as follows:
The regression model exhibited a high level of accuracy, with a coefficient of determination (R²) of over 99%. This indicates an excellent agreement between the predicted and experimental results.
The main effects analysis indicated that addition of PLA (X₃) has the highest positive effect on hardness, while addition of excessive amounts of fillers (X₁ and X₂) has effects on mechanical properties.
The response optimizer determined the optimal formulation to be X₁ = 5.350 wt%, X₂ = 14.650 wt% and X₃ = 80.0 wt%. This yielded a predicted maximum hardness of 80.06 HRL and a desirability value of 1.000.
It should be noted that the contour and response surface plots presented herein were generated from the fitted quadratic regression model, and response values observed between experimental design points within the constrained mixture space.
The results indicate that the mechanical properties of biocomposites are dependent on the matrix continuity and the interaction of the interfaces. Too much filler in the composite may result in agglomeration and weaken the structure of the composite.
Although the optimized formulation was predicted statistically, future work is recommended to validate the predictive capability of the developed model experimentally.
In conclusion, the results of the present study reveal that waste materials such as cocoa pod husk and tamarind shell powder can be utilized in the development of polylactic acid (PLA) biocomposites through the optimization of the proportions of the materials. This is a reliable and efficient way of designing mixtures and can be applied in the development of sustainable and eco-friendly materials.
Acknowledgements
The authors would like to express their gratitude for the institutional support and technical resources provided for this research.
Conflict of interest
The authors declare that they have no conflicts of interest relating to the research, authorship, writing or publication of this manuscript.
References
- A. Saha, N.D. Kulkarni, M. Kumar, and P. Kumari, “The structural, dielectric, and dynamic properties of NaOH-treated Bambusa tulda reinforced biocomposites—an experimental investigation,” Biomass Convers. Biorefinery., 14 (20) 26247-26266 (2024). doi:10.1007/s13399-023-04709-5.
- S. Singh, L. Nagdeve, H. Kumar, and K. Dhakar, “Rice straw based natural fiber reinforced polymer for sustainable bio-composites: a systematic review.” Evergreen, 10 (2) 1041-1052 (2023). doi:10.5109/6793661.
- S. Kumar, and A. Saha, “Effects of stacking sequence of pineapple leaf-flax reinforced hybrid composite laminates on mechanical characterization and moisture resistant properties.” Proc. Inst. Mech. Eng. C J. Mech. Eng. Sci., 236 (3) 1733-1750 (2022). doi:10.1177/09544062211023105.
- P. Prabhu, G. Gokilakrishnan, S.H. Anand, and L. Priya, “Load bearing characterization of kenaf fiber/poly (vinyl ester) composites reinforced by silanized biomass waste tamarind shell and roasted chickpeas powder.” Fibers Polym., 26 (3) 1319-1331 (2025). doi:10.1007/s12221-024-00829-5.
- A. Kumar, B. Dahiya, and D. Grover, “Optimizing agricultural waste powder epoxy composite for enhanced strength using a hybrid Taguchi-GRA-PCA approach.” Evergreen, 11 (2) 713-721 (2024). doi:10.5109/7183347.
- S. Nayak, M.P. Kumar, and K.M. Vinay, “Wear behavior evaluation of natural fibre composite using taguchi technique.” Evergreen, 11 (2) 722-728 (2024). doi:10.5109/7183350.
- A. Kumar, S. Kumar, and S. Jindal, “Enhancing composite material fabrication through optimization: employing fruit peel or shell powder as reinforcements using Taguchi-GRA-PCA methodology.” Evergreen, 11 (2) 701-712 (2024). doi:10.5109/7183345.
- N.M. Mathur, Yashpal, and B. Pratap, “Ascertaining tribological properties of PLA matrix composites reinforced with SCB/CF fiber with ANOVA and regression analysis.” Evergreen, 11 (1) 234-241 (2024). doi:10.5109/7172260.
- N. Bharat, D. Veeman, and V. Kumar, “Predicting mechanical properties of biodegradable PLA/Wood composites fabricated by 3D printing: a supervised learning approach.” Cellulose, 33 1055–1083 (2026). doi:10.1007/s10570-025-06906-z.
- M.A. Tolcha, M.M. Derese, H. Altenbach, H.G. Lemu, and K. Naumenko, “Development and characterization of enset and sisal fiber-reinforced PLA composites for FDM 3D printing.” Mater. Today Adv., 29 100720 (2026). doi:10.1016/j.mtadv.2026.100720.
- D. Barrera-Juca, J. Gomez-Caturla, M.P. Vicente-Vinas, R. Balart, and X. Marset, “From agro-waste to functional biopolymers: High-lignin PLA composites plasticized with eugenyl acetate for circular economy-based materials.” Int. J. Biol. Macromol., 350 150993 (2026). doi:10.1016/j.ijbiomac.2026.150993.
- N. Bharat, V. Dhinakaran, V. Mishra, V. Kumar, “Development and characterization of novel PLA/Henna biocomposites for sustainable additive manufacturing.” J. Inorg. Organomet. Polym. Mater., 35 7250–7267 (2025). doi:10.1007/s10904-025-03733-4.
- K. Rahmani, S. Ravanbod, M.L. Dezaki, C. Branfoot, and M. Bodaghi, “Pellet-fed continuous-silk-fibre 3D/4D printing of PLA/bamboo-charcoal bio-composites with shape recovery and thermomechanical stability.” Mater. Des., 264 115704 (2026). doi:10.1016/j.matdes.2026.115704.
- A.I. Nazarudin, A.A. Basri, E.I. Basri, K.A. Ahmad, M.T.H.H. Sultan, M.N.F. Norrahim, and M.R. Zakaria, “Evaluation of mechanical, thermal, and viscoelastic properties of polylactic-acid (PLA)/ banana peel powder (BPP) composite.” J. Mater. Res. Technol., 40 3496–3508 (2026). doi:10.1016/j.jmrt.2026.01.027.
- G.C. Bevilaqua, I.S. Gonçalves, and M.B.S. Forte, “Comparison of pretreatment strategies for the integrated production of pectin and fermentable sugars from cocoa pod husk within a biorefinery approach.” Biomass and Bioenergy, 212 109245 (2026). doi:10.1016/j.biombioe.2026.109245.
- A. Chanpahol, B. Nadondu, P. Surin, and J. Deeying, “Multi-objective optimization on mechanical properties of cocoa pod husks and tamarind shell reinforced poly (lactic acid) biocomposites using extreme mixture design.” Results Eng., 29 109662 (2026). doi:10.1016/j.rineng.2026.109662.
- L.G. Moutinho, E. Soares, and M. Oliveira, “Thermoforming of bio-based polylactic acid (PLA) sheets reinforced with cork powder.” Mater. Today Commun., 46 112867 (2025). doi:10.1016/j.mtcomm.2025.112867.
- A. Baraich, A. Elbouzidi, N. El. Hachlafi, M. Taibi, M. Haddou, S. Baddaoui, R. Bellaouchi, M. Addi, R. Benabbes, A. Asehraou, B Jaouadi, A. AL-Farga, S.M. Al-Maaqar, and E. Saalaoui, “Optimization of antibacterial and antifungal activities in Moroccan saffron by-products using mixture design and simplex centroid methodology.” Sci. Rep., 15 28425 (2025). doi:10.1038/s41598-025-07424-5.
- M. Singh, and P. S. Bharti, “Development of models to predict flexural strength of 3d printed specimens in terms of input parameters.” Evergreen, 11 (2) 1292-1298 (2024). doi:10.5109/7183438.
- ASTM International, ASTM D785-08: Standard Test Methods for Rockwell Hardness of Plastics and Electrical Insulating Materials, West Conshohocken, PA, USA (2015). doi:10.1520/D0785-08R15
- H. Sosiati, A.A.N. Aziz, and R.N. Wicaksono, A. Pamasti, R.K. Adi, A.W. Nugroho, and D Gustiono, “Mechanical properties of carbon/epoxy-HA hybrid composites for potential external fixation bone plates.” Evergreen, 12 (3) 1564-1574 (2025). doi:10.5109/7388849.
- S.Z. Hervan, A. Altınkaynak, Z. Parlar, “Hardness, friction and wear characteristics of 3D-printed PLA polymer.” Proc. Inst. Mech. Eng. J: J. Eng. Tribol., 235(8) 1590-1598 (2020). doi:10.1177/1350650120966407.
- A.A Abir, B. Trindade, “A comparative study of different poly (Lactic Acid) bio-composites produced by mechanical alloying and casting for tribological applications.” Materials, 16 (4) 1608. (2023). doi:10.3390/ma16041608.
- N.K. Yadav, N.S. Rajput, and M.K. Gupta, “Investigation of the mechanical and wear properties of epoxy resin composite (ERCs) made with nano particle TiO2 and cotton fiber reinforcement.” Evergreen, 10 (1) 63-77 (2023). doi:10.5109/6781041.
- P. Surin, B. Nadondu, and J. Deeying, “Optimization of flexural properties of glass/carbon/durian skin fiber reinforced polymer composites using the mixture design approach.” J. Appl. Sci. Eng., 27 (2) 2127-2136 (2023). doi:10.6180/jase.202402_27(2).0014.
- H. Yin, S. Fan, K. Peng, X. Li, Z. Wang, Y. Chen, and M. Zhou, “Process optimization for improving anti-oxidation performance of silver-coated copper powders by response surface methodology and artificial neural network.” Mater. Des., 253 113855 (2025) doi:10.1016/j.matdes.2025.113855.
- M.G. Ganta, and M. Patel, “Evaluation of mechanical and thermal properties of alkali-treated sisal, bamboo, and hybrid fiber-reinforced polymer composites.” Evergreen, 11 (3) 1784-1797 (2024). doi:10.5109/7236831.
- S. Rajendran, G. Palani, A. Veerasimman, U. Marimuthu, K. Kannan, and V. Shanmugam, “Biochar from cashew nut shells: A sustainable reinforcement for enhanced mechanical performance in hemp fibre composites.” Clean. Eng. Technol., 20 100745 (2024). doi:10.1016/j.clet.2024.100745.
- D.C. Montgomery, “Design and Analysis of Experiments,” Wiley & Sons, (2013).
- R.H. Myers, D.C. Montgomery, and C.M. Anderson-Cook, “Response surface methodology: Process and product optimization using designed experiments.” Wiley & Sons, (2016).
- H. Scheffé, “Experiments with Mixtures.” J. R. Stat. Soc., Ser. B, Methodol., 20 344-360 (1958). doi:10.1111/j.2517-6161.1958.tb00299.x
- M. Kaur, N. Mittal, A. Charak, V. Singh, “Rice husk derived activated carbon for the adsorption of scarlet RR an anionic disperse dye.” Evergreen., 10 (1) 438-443 (2023). doi:10.5109/6782146.
- W. Choklob, R.K. Gupta, S. Kajorncheappunngam, “PLA blend/RHA permeable composite films for fruit packaging.” Eng. Appl. Sci. Res., 46 (3) 210-218. (2019). doi:10.14456/easr.2019.24.
- Z. Qi, B. Wang, Z. Fang, Y. Zhang, “Core-shell structure of crosslinking coated corn stalk fibers: Constructing compatible interface for polylactic acid composites.” J. Mater. Res. Technol., 37 2676-2683 (2025). doi:10.1016/j.jmrt.2025.06.087.
- A. Kumbhare, A. Bisen, P. Poddar, K.L. Sahoo, D. Mandal, and C. Choudhary, “Experimental design to optimize the input variables for modified strain-induced melt activation process to achieve high mechanical performance of hypoeutectic Al-Si alloy.” J. Mater. Eng. Perform., 1-11 (2026). doi:10.1007/s11665-026-13461-6.
- K. Chimklin, S. Phuangkaew, and J. Deeying, “Multi-objective optimization of laser spot welding
- parameters for enhancing mechanical properties of hard disk components using response surface methodology.” Results Eng., 25 104449 (2025). doi:10.1016/j.rineng.2025.104449.
- A.A. Ansari, and M. Kamil, “Izod impact and hardness properties of 3D printed lightweight CF reinforced PLA composites using design of experiment.” Int. J. Lightweight Mater. Manuf., 5 369e383 (2022). doi:10.1016/j.ijlmm.2022.04.006.
- B. Nadondu, P. Surin, J. Deeying, “Multi-objective optimization on mechanical properties of glass-carbon and durian skin fiber reinforced poly (lactic acid) hybrid composites using the extreme mixture design response surface methodology.” Case Stud. Constr. Mater., 17 e01675 (2022). doi:10.1016/j.cscm.2022.e01675.
- J. Deeying, K. Asawarungsaengkul, P. Chutima, “Multi-objective optimization on laser solder jet bonding process in head gimbal assembly using the response surface methodology.” Opt. Laser Technol., 98 158–168 (2018). doi:10.1016/j.optlastec.2017.07.045.
- S. Rajendran, G. Palani, K. Arunprasath, V. Shanmugam, U. Marimuthu, and A. Veerasimman, “Eco-friendly sugarcane biochar filler for enhanced mechanical properties in S-glass/polyester hybrid composites.” Clean. Eng. Technol., 20 100759 (2024). doi:10.1016/j.clet.2024.100759.