
Abstract
This study integrates route-choice behavior and financial feasibility analysis for the Malang-Kepanjen Toll Road. Stated Preference surveys of 100 respondents reveal a toll equilibrium tariff of IDR 9,800 and a time acceptance threshold of -25 minutes (R²=0.873). These parameters establish three traffic scenarios: pessimistic (236 veh/hr), moderate (351 veh/hr), and optimistic (456 veh/hr). Financial analysis over a 20-year concession shows only the optimistic scenario is viable (B/C Ratio=1.238). This integrated framework addresses a methodological gap in Indonesian infrastructure planning and improves investment reliability for secondary city corridors.
Keywords: feasibility study, Malang-Kepanjen toll road, stated preference, toll road development
Outline
1. Introduction
A region can develop rapidly if supported by robust infrastructure and road networks. Accessibility is a concept that combines a geographical land-use system with transportation network systems1). Regions with difficult accessibility tend to have low economic levels. One way to overcome this problem is to build roads. The infrastructure is expected to accelerate the area's development. The road could be a regular inter-regional road or a toll road.
The Malang Raya agglomeration comprises Malang City, Malang Regency, and Batu City. This area has the potential to become a new economic center in East Java Province because it has various good potentials, such as tourism and education2). Strategically located between Malang Regency and Batu City, Malang City serves as the main catalyst for economic growth in Malang Raya. Based on the previous study 3). The Malang Raya region exhibits disparities, or regional gaps, due to uneven development across its city regions. The basic problem in the Malang Raya region is that development has been centered in Malang City (monocentric). The results of this study indicate that there is no gap between Batu City and Malang City, as development and infrastructure are evenly distributed. However, Malang Regency still has insufficient facilities and infrastructure.
The proposed Malang-Kepanjen Toll Road, spanning 21.04 km, is a key project aimed at enhancing this synergy, with Kepanjen, the capital of Malang Regency, as its endpoint4). The construction of this toll road is expected to significantly improve the region's accessibility and connectivity, further solidifying the strategic importance of Malang City5). This toll road begins at the Sawojajar toll exit (Malang City) and ends at the Talangagung, Kepanjen (Malang Regency).
Previous toll road feasibility studies in Indonesia have typically adopted either a behavioral approach focusing on route choice preferences or a financial approach emphasizing investment viability. However, few studies have integrated these perspectives to demonstrate how user behavior directly determines traffic volume scenarios that underpin financial projections. This methodological gap limits the reliability of feasibility assessments, particularly for new toll road corridors where user adoption patterns are uncertain. Financial models based on assumptions disconnected from actual user preferences may overestimate or underestimate infrastructure viability.
Furthermore, most Indonesian toll road research concentrates on metropolitan corridors such as Jakarta-Bandung and Surabaya-Gempol, where traffic demand is well-established. Secondary city contexts, such as Malang Raya, in which toll roads serve as new infrastructure rather than as congestion relief for existing high-volume routes, remain understudied. The Malang-Kepanjen corridor presents a case where user adoption is uncertain and financial viability depends critically on behavioral factors that cannot be assumed from metropolitan precedents.
This study addresses these gaps by developing an integrated analytical framework that links stated preference analysis directly to financial feasibility scenarios. By deriving traffic volume projections from empirical route-choice probabilities rather than arbitrary assumptions, the study demonstrates a methodologically coherent approach to toll-road investment assessment applicable to emerging Indonesian urban corridors.
The existence of the Malang-Kepanjen toll road will change people’s preferences for the chosen route when traveling from Malang City to Kepanjen. In this case, individuals often have multiple reasons for choosing the best route. They will choose the best one with lower travel costs and shorter travel time6). This applies to people who choose between the Malang-Kepanjen toll road and the existing arterial road as a non-toll route. The problem is how the construction of the Malang-Kepanjen toll road is in line with a previous study, which shows a difference in average economic growth with the construction of toll roads7). In this case, the purpose of building toll roads as infrastructure to increase distribution efficiency to support economic growth can be achieved. On the other hand, society (as users) and businesses (as investors) face significant challenges in investing substantial funds. The long-term return on investment is affected by unpredictable macroeconomic factors like inflation and interest rates. Given these complexities and the various stakeholders in toll road investments, it is essential to explore the financial feasibility of the project8). Therefore, research on the feasibility of the Malang-Kepanjen toll road is relevant to obtain an overview of its potential in terms of technical, route choice, and financial aspects.
The study aims to obtain an overview of the Malang-Kepanjen toll road construction feasibility study. The aspects examined in this study are technical (construction cost) and financial cost. To achieve this aim, the following objectives are accomplished:
To determine the route choice between the Malang-Kepanjen toll road and the arterial road; and
To determine the financial feasibility of the Malang-Kepanjen toll road.
2. Literature Review
The toll road is a public road that is part of the road system and a national road whose users are required to pay a toll9). The purpose of managing toll roads is to enhance the efficiency of transportation and distribution services to support economic growth, especially in regions with significant development. Given the significant impact of toll road construction, this program is included in the government’s strategic projects and requires a comprehensive study, including a feasibility assessment.
A feasibility study, a crucial step in project selection, is a comprehensive evaluation that ensures the best possible outcomes for the organization. It assesses the potential success of a proposed project, taking into account factors such as technical feasibility, financial viability, and public preference. This comprehensive approach makes a feasibility study a reliable tool for decision-making10). Conducting this feasibility analysis will involve various aspects to decide a project's feasibility. Financial aspects, which compare costs and benefits to determine whether a business will be profitable over its lifetime, must be considered when implementing a feasibility analysis11).
The stated-preference method aims to determine how respondents evaluate different attributes. This method asks respondents to choose an alternative among service scenarios created based on several attributes compiled in12). The stated preference method provides a technique for eliciting information on demand and travel behavior for a particular expenditure and reason13). The stated preference survey was conducted to demonstrate the heterogeneity of user preferences and also related to the relative importance of factors that influence the user’s route selection decision-making procedure14)
Previous studies on the selection of ring road routes that employ stated-preference methods have used attributes such as travel time, road comfort, road crowding, perceived road edges, and the availability of travel time information. Meanwhile, another previous study on the selection of toll roads used the stated preference method using travel cost and travel time as attributes15).
The financial dimension is one of the factors used to assess the investment plan of a commercial project. The aspects influencing financial feasibility analysis are project costs16), toll rates, and operational-maintenance costs17). There are three common methods used to determine financial feasibility; these are Benefit Cost Ratio (BCR), Net Present Value (NPV), Internal Rate of Return (IRR), and Payback Period (PP), where NPV and IRR are the most popular financial evaluation tools for construction projects18).
The Benefit-Cost Ratio (BCR) method is used to compare the benefits of an investment with its costs. If the BCR> 1, the project is feasible; conversely, if the BCR < 1, the project is not feasible19). This method is often used in the initial evaluation stage or as an additional analysis to validate evaluation results obtained from other investment planning methods.
The Net Present Value (NPV) method is to move the cash flow spread throughout the investment period to the initial investment period or present condition20-22). If the NPV> 0, the project is feasible or profitable; if NPV < 0, the project is not feasible or profitable.
Internal Rate of Return (IRR) is determined by comparing the IRR value with MARR (Minimum Acceptable Rate of Return)23). A trial-and-error method is used to calculate the IRR value, which is between interest rates that produce positive and negative NPV24). It is defined as the discount rate that sets the NPV of a project's cash flows (inflows and outflows) to zero.
Payback Period (PP) analysis measures how quickly an investment can be returned. It measures how long it will take for an investor to recover the investment. A payback period is feasible if the required time is less than the concession period.
3. Methodology
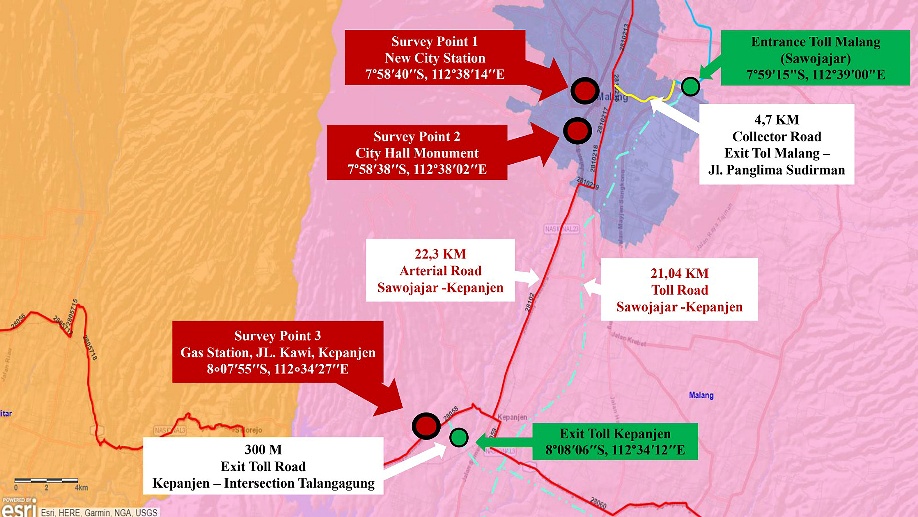
This research uses supporting data for mapping to determine the Malang - Kepanjen toll road route plan. This study's locations are toll and non-toll routes (existing arterial roads) in Malang-Kepanjen. The respondents were interviewed at New City Station, Malang City (7°58′40′′S, 112°38′14′′E), City Hall Monument, Malang City (7°58′38′′S, 112°38′02′′E), and Kepanjen, Malang Regency (8°07′55′′S, 112°34′27′′E). The study's locations and the locations of entrance (7°59′15′′S, 112°39′00′′E) and exit tolls (8°08′06′′S, 112°34′12′′E) are presented in Figures 1 and 2.
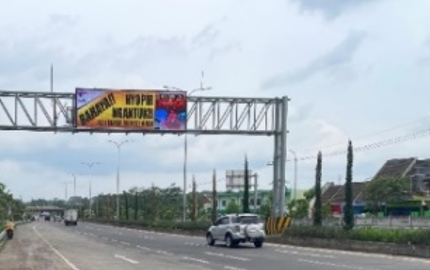
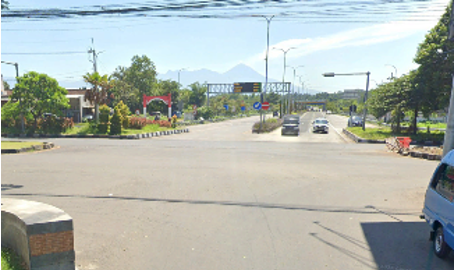
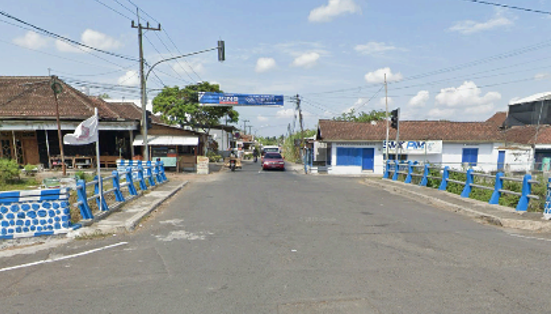
This study contained primary and secondary data. The primary data were collected from a preliminary survey, road network, and questionnaires to obtain the characteristics of four-wheel users and their preferences between the Malang-Kepanjen toll road and the existing arterial road regarding gender, age, education, occupation, average income/month, and stated preference attribute data (cost and travel time). The secondary data were obtained from external agencies about the administrative map of the study area, population data obtained from the BPS Statistics of East Java Province, arterial and toll road speed data, vehicle operating cost data, toll tariff data, toll road construction cost, and bank inflation data (2014-2024).
Direct observation was conducted to obtain the respondents' characteristics and route preferences. To determine the number of respondents using East Java Province population data25) and to assess the availability of respondents for choosing toll and arterial roads, we used the Slovin formula. Based on the population, the number of respondents to complete the questionnaire is 99.76 ≈ 100.
The stated preference approach was selected for three methodological reasons. First, as the Malang-Kepanjen toll road is not yet operational, revealed preference data from actual route choices are unavailable. Second, stated preference methods allow systematic variation of cost and time attributes across hypothetical scenarios, enabling estimation of user sensitivity to these factors14). Third, this approach is consistent with pre-construction feasibility practices recommended for toll road investment assessment in Indonesia22,26). While discrete choice models such as multinomial logit offer greater analytical sophistication, the binary-choice context and exploratory nature of this pre-construction feasibility assessment justify a simpler regression-based approach, which yields directly interpretable parameters for scenario development. The sample size of 100 respondents, while providing indicative results suitable for a preliminary feasibility assessment, is a limitation addressed in Section 4.5.
The main variables of route preferences are time and cost. The time difference is 15 and 30 minutes, while the cost difference is IDR 15,000 and IDR 30,000. Data validation was conducted using statistical tests and processing using the stated preference method. The symmetric scale or logit value will be the dependent variable, and the independent variable will be the difference between each attribute. The linear regression equation is as follows:
The values of b0 and bn are known by using SPSS software ver. 25. After obtaining these values for each model, the utility model could be expressed as follows:
Table 1: Cost Components of a Vehicle
| Components | Cost (IDR, vehicle/km) |
|---|---|
| Direct Costs | |
| Depreciation Cost | 757.5 |
| KIR Test Fee | 1.27 |
| Fuel Cost | 714.20 |
| Tire Cost | 62 |
| Minor Service | 26.01 |
| Large Service | 46.42 |
| Clutch Pads | 34.46 |
| Brake Pads | 23.23 |
| STNK and vehicle tax renewal fee | 48.08 |
| Insurance fee | 2.61 |
| Car wash | 43.71 |
| Driver income | 5,681.82 |
| AC service | 19.45 |
| Total Direct Costs | 7,460.84 |
| Indirect Costs | |
| Employee cost | 72.84 |
| Management cost | 90.45 |
| Total Indirect Costs | 163.29 |
The arterial road speed data was determined based on a direct survey using a private car with a speedometer speed between 30-40 km/hour and a real field speed of 30.566 km/hour. Vehicle Operating Costs are calculated based on the car type of the 2019 Toyota Innova 2.0 G MT, an operational vehicle for a travel company27). When it was first released, the unit price of the car, which seats 7 passengers, was IDR 268,000,000. Table 1 presents the cost components related to operating this vehicle.
Based on the Table above, the total direct costs are IDR 7,460.84 per vehicle/km, and the total indirect costs are IDR 163.29 per vehicle/km. Vehicle operating costs are calculated by summing the two components, yielding a total of IDR 7,624.13 per vehicle/km.
The toll tariff data in this study uses an approach from the toll tariff found on the government's official website by using the Gempol-Pandaan toll road; this toll section is used as a benchmark because the section is close to the location of the study, so it can be used to determine the toll tariff28). In the calculation and distance of 11.4 km, it can be generated that the toll rate per km is IDR 1,140.35, which is used as a reference in planning the toll tariff value of Malang-Kepanjen. Bank Indonesia's inflation data is used to conduct the financial analysis, namely the benefits and costs of constructing and operating the Sawojajar- Kepanjen Toll Road. Inflation data from 2017 to 2024 is 3.078%29). The cost of constructing the Sawojajar-Kepanjen Toll Road includes toll road maintenance, which accounts for 2% of total construction costs.
Financial analysis for the Sawojajar-Kepanjen Toll Road project involves evaluating the NPV, B/C Ratio, and IRR methods26). The goal is to assess a project's financial viability by comparing revenues and expenditures, including construction, operational, and maintenance costs.

The decision to continue the project will depend on whether the current revenue exceeds the required expenditure, with the B/C Ratio, which must be greater than 1. In addition, social factors must be considered when assessing the project's feasibility.
Based on the preceding literature review, a methodological gap exists in Indonesian toll road feasibility studies, in which route choice behavior analysis and financial feasibility evaluation are typically treated as separate analytical domains. Traffic volume assumptions in financial models are often decoupled from empirical data on user preferences, thereby limiting the reliability of investment assessments. To address this gap, the present study develops an integrated analytical framework that explicitly links stated preference analysis with financial feasibility evaluation, as illustrated in Figure 3.
The framework comprises three interconnected phases. Phase 1 (Data Collection) establishes the empirical foundation through primary data collection via stated-preference surveys. These surveys were administered through face-to-face interviews to potential toll road users during the survey period from March 26, 2024, to April 27, 2024. A purposive sampling technique was employed, targeting regular Malang-Kepanjen travelers as the primary inclusion criterion. The data collection was carried out at 3 distinct locations: New City Station, City Hall Monument, and Kepanjen. This primary dataset is complemented by secondary data, including construction costs, inflation rates from Bank Indonesia, and vehicle growth statistics from BPS.
This study was conducted in accordance with ethical guidelines for research involving human subjects. All participants provided informed consent prior to participation and were informed of their right to withdraw at any time without consequence. The survey was conducted anonymously, and no personally identifiable information was collected. The questionnaire contained only transportation-related questions regarding travel patterns and route preferences.
The stated preference instrument employs two key attributes—travel cost difference (ΔCost) and travel time difference (ΔTime)—consistent with route choice determinants identified in prior transportation studies12,14). Phase 2 (Route Choice Behavior Analysis) transforms ordinal preference responses into utility values using the Berkson-Theil transformation, a standard approach in stated preference studies that converts choice probabilities to a continuous utility scale. Linear regression analysis then models the utility difference between toll and arterial routes as a function of cost and time differentials. This phase yields three critical behavioral outputs: (1) a toll tariff threshold at which route choice probability equalizes between toll and arterial options; (2) a time acceptance level indicating users' willingness to accept additional travel time on toll roads; and (3) traffic volume estimates corresponding to different cost differential scenarios.
The integration link between Phase 2 and Phase 3 represents the study's methodological contribution. Rather than relying on arbitrary or externally sourced traffic projections, the financial feasibility scenarios are derived directly from the stated-preference analysis results. Route choice probabilities under different cost-differential conditions—high toll cost differential, equal cost, and low toll cost differential—generate corresponding traffic-volume scenarios categorized as pessimistic, moderate, and optimistic, respectively. This linkage ensures that financial projections are grounded in empirical data on user behavior rather than speculative assumptions.
Phase 3 (Financial Feasibility Analysis) evaluates investment viability across the three behaviorally-derived traffic scenarios using standard financial metrics: Net Present Value (NPV), Benefit-Cost Ratio (BCR), Internal Rate of Return (IRR), and Payback Period. By applying identical financial parameters across scenarios that differ only in traffic volume—themselves derived from behavioral analysis—the framework isolates the impact of user adoption patterns on investment feasibility. This integrated framework offers methodological coherence by ensuring that financial assumptions are traceable to empirical behavioral data and is transferable to other pre-construction toll road assessments in which uncertainty in user adoption poses investment risk.
4. Results and Discussion
4.1. Respondent Characteristics
This research survey was conducted through direct interviews with respondents in 2024. The characteristics of respondents are presented in Figure 4.
Based on the survey, the majority of respondents in this study were male (61%). The dominant age groups were 21-30 and 31-40 years old, each at around 28%. The dominant occupation was self-employment (28%), followed by students/college students (22%), the latter representing the productive age group. Based on the amount of income, it was dominated by the 2-4 million income group with a percentage of 39%. As for educational attainment, graduates accounted for 78%.
(a) | (b) |
|---|---|
(c) | (d) |
(e) | |
4.2. Route Selection Characteristics of the Study Area
In the context of urban transportation planning, studies in Surabaya show that areas with a high level of compaction tend to have more ideal and efficient population mobility, as well as lower energy consumption30).
Figure 1 illustrates the route between the existing arterial road and the planned toll road; the yellow dot indicates the survey location to be analyzed, located in Sawojajar, Malang (the location of the existing toll exit). The distances between the two roads are compared in Table 2.
The trajectory plan for the Malang (Sawojajar)-Kepanjen toll road has a total length of 26.04 km, including toll exits and collector roads (additional distance). People in Malang City who want to go to Kepanjen via the toll road must travel an additional 0.3 km to the Sawojajar toll gate.
The parameters used to calculate vehicle operating costs are the prices of each component across vehicle types and the speed of each type of vehicle31). A cost analysis using the vehicle operating cost approach and toll rates indicates an additional toll of IDR 1,140.35 per kilometer. Travel costs using the toll roads for the Malang-Kepanjen toll road route are higher than those on arterial roads, but do not include the value of travel time. Vehicle operating costs and toll rates can be analyzed for travel costs and time. Travel costs are calculated based on distance and vehicle operating costs. Calculation for existing arterial:
= distance x vehicle operating cost
= 22.3 km x IDR 7,624.13
= IDR 170,018.099 (time value not included)
Calculation for toll road
= (vehicle operating cost + toll rate per km) x toll distance + (additional distance x vehicle operating cost)
= (IDR 7,624.13 + IDR 1,140.35) x 21.04 km + (5 km x IDR 7,624.13)
= IDR 222,525.309 (time value not included)
| Road | Distance (km) | Information | |
|---|---|---|---|
| Existing Arterial Road | 22.3 | Artery | |
| Toll + Toll Exit + Collector | 21 | 26 | Toll + Toll Exit + Collector |
| 0.3 | |||
| 4.7 | |||
| Time Value | |
|---|---|
| Time value=(GDRP/Population)/Standard Working Hours | |
| GDRP | 1,669.12 trillion |
| East Java Population | 41.149 million |
| Standard Working Hours in a Year | 2,080 Hours/Year |
| Time Value | IDR 325.015 per minute per person |
| Existing Arterial Road | ||
|---|---|---|
| Speed (km/hour) | Cost (IDR) | Time (minutes) |
| 20 | - | - |
| 30.566 | 212,673.7 | 53.00 |
| 40 | - | - |
| 50 | - | - |
| 60 | - | - |
| Toll Road | ||
|---|---|---|
| Speed (km/hour) | Cost (IDR) | Time (minutes) |
| 60 | 232,459.72 | 30.57 |
| 70 | 231,468.89 | 27.52 |
| 80 | 230,721.76 | 25.23 |
| 90 | 230,147.78 | 23.45 |
| 100 | 229,685.39 | 22.03 |
Travel time is calculated using vehicle speed and distance. Based on direct observation, the travel time on the existing arterial road is 53 minutes at 30.57 km/hour. Based on the data from the East Java Province GDRP 2024, about IDR 1,669.12 trillion/month corresponds to IDR 325.015 times the value per minute. The calculations are shown in Tables 3–5.
In urban transportation, travel time is important for user’s optimal route selection preferences32) Ordinal scale data is converted to a ratio scale. In this study, respondents will be asked to indicate their preference between the toll road route and the existing arterial road. A respondent is given a condition with variations in cost and time. The respondent selects option 1 on the ordinal scale (using the Berkson–Theil transformation). The choice scale 1 has a value of 0.9 on the ratio scale, expressed as a probability. This probability is entered into the utility formula, yielding the utility value Ln(0.91 − 0.9) = 2.1972, which corresponds to the probability shown in Table 6.
A summary of the regression results of route selection on the travel cost between toll roads and existing arterial roads is presented in Table 7, and the route selection probability is presented in Figure 5. The travel cost utility equation will be obtained from the regression coefficients: (UTOLL—UARTERY) = b0+b1(ΔX1).
The graph in Figure 5 shows that the equilibrium point is at IDR 9,800, where the probability of choosing between the existing arterial road and the toll road is equal. Based on this analysis, IDR 9,800 represents the indicative equilibrium threshold—the equal-choice point at which route selection probabilities between the toll road and arterial road are balanced.
| No | Response | Probability Scale (P) | Utilities ( |
|---|---|---|---|
| 1 | Use Toll | 0.9 | 2.1972 |
| 2 | Maybe use Toll | 0.7 | 0.8473 |
| 3 | Balanced choice | 0.5 | 0.0000 |
| 4 | Maybe use Artery | 0.3 | -0.8473 |
| 5 | Use Artery | 0.1 | -2.1972 |
Modified from Berkson – Theil transformation.
| Model | Constant (B0) | Cost (bn) | |
|---|---|---|---|
| Unstandardized Coefficients | B | 0.247 | -0.00006485 |
| Std. Error | 0.047 | 0.00 | |
| Standardized Coefficient | Beta | -0.935 | |
| t | 5.245 | -26.099 | |
| Sig. | < 0.001 | < 0.001 | |
| 95,0% Confidence Interval for B | Lower Bound | 0.154 | 0.000 |
| Upper Bound | 0.341 | 0.000 | |
| R | 0.935 | ||
| R Square | 0.874 | ||
| Adjusted R-Square | 0.873 | ||
| F | 681.141 | ||
| N | 100 | ||
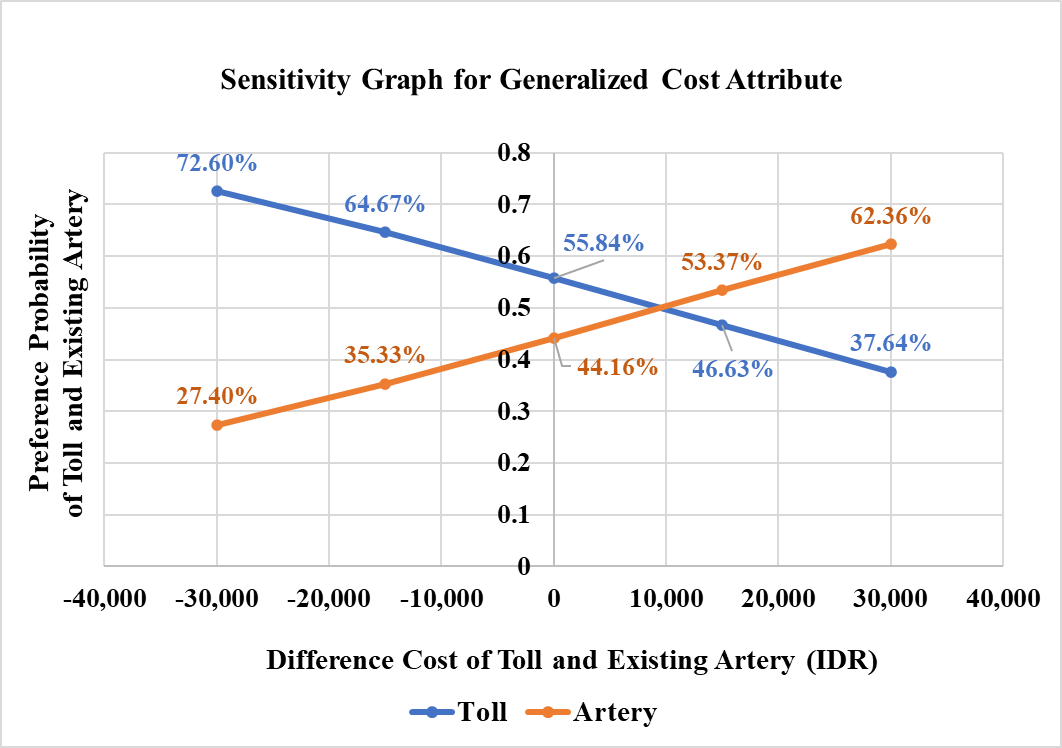
This SP-derived threshold should be interpreted as an indicative value rather than a guaranteed adoption cutoff, as actual behavior may differ from stated preferences. This is in line with the results of previous research. It was found that the probability of choosing a toll road varied as the attribute values were gradually varied. The result is that the larger the increase in toll rates, the lower the probability that users choose toll roads.
| Model | Constant (b0) | Cost (bn) | |
|---|---|---|---|
| Unstandardized Coefficients | B | -0.660 | -0.062 |
| Std. Error | 0.047 | 0.002 | |
| Standardized Coefficient | Beta | -0.935 | |
| t | -14.016 | -26.161 | |
| Sig. | < 0.001 | < 0.001 | |
| 95,0% Confidence Interval for B | Lower Bound | -0.754 | -0.066 |
| Upper Bound | -0.567 | -0.057 | |
| R | 0.935 | ||
| R Square | 0.875 | ||
| Adjusted R-Square | 0.873 | ||
| F | 684.378 | ||
| N | 100 | ||
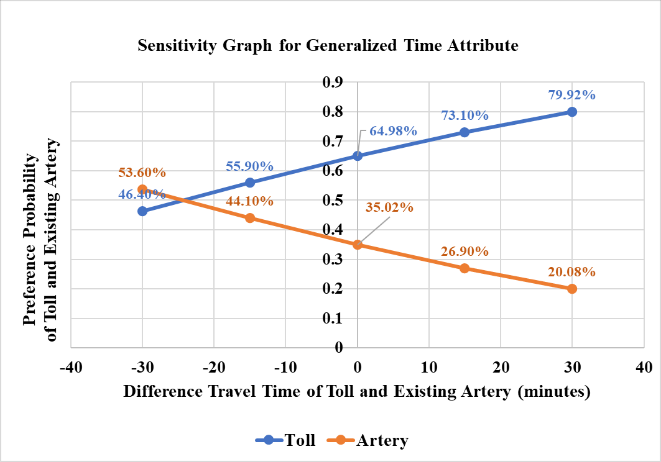
A summary of the regression results of route selection on travel time between toll roads and existing arterial roads is presented in Table 8, and the route selection probability is presented in Figure 6. The travel cost utility equation will be obtained from the regression coefficients: (UTOLL—UARTERY) = b0 + b1 (ΔX2).
The time difference variable is defined as
ΔTime = Time (Toll Road) – Time (Arterial Road).
A negative ΔTime indicates that the toll road is faster than the arterial road; a positive ΔTime indicates that the toll road is slower.
The equilibrium point occurs at ΔTime = –25 minutes. Following the sign convention (ΔTime = Toll – Arterial), this negative value indicates that when the toll road travel time is 25 minutes shorter than the arterial road, route choice probabilities are equal (P = 0.5). As ΔTime becomes more positive (i.e., the toll road becomes relatively slower), the probability of choosing the toll road decreases. This aligns with a study conducted in Vietnam, which states that car drivers prefer toll roads due to reduce travel times and driving stress compared to mixed-traffic non-toll roads dominated by motorcycles33). The SP-based results suggest that some respondents may accept a toll road that is slower than the arterial road, potentially reflecting perceived benefits in comfort and reliability. However, this 'comfort premium' inference should be interpreted cautiously as it is derived from hypothetical choices rather than observed behavior34).
4.3. Technical Analysis of the Malang-Kepanjen Toll Road
In determining the construction and maintenance costs for the Malang-Kepanjen toll road, data were used to support the 2020 toll road construction costs through a development budget forecasting approach using an inflation value of 3.078%. The costs of toll road construction are presented in Table 9.
Material sustainability and environmental impact should also be considered in subsequent stages of development. One notable opportunity is the use of high early-strength concrete (HESC) incorporating hydraulic cement with lower clinker content, such as HCN or HCT, which has been shown to reduce CO2 emissions by up to 13.64% compared to Ordinary Portland Cement (OPC) without sacrificing performance35).
Based on Table 9, the Malang-Kepanjen toll road is planned with a construction budget of about IDR 952,053,675,000 in 2020. Construction is planned to begin in 2025, and the construction budget is forecast at IDR 1,074,802,637,757.90 using an inflation rate of 3.08%. The maintenance cost is 2% of the operational cost. The benefit-cost analysis indicates that, 20 years from 2025 (the project's concession period), the cost will be IDR 1,693,421,980,722.00. The calculation is shown in Table 10 and 11.
| Material | Volume | Unit | Cost (IDR) |
|---|---|---|---|
| Sirtu backfill | 3,352,995.1 | m³ | 595,745,913,808.55 |
| Excavation | 435,846.88 | m³ | 103,368,492,630.49 |
| Asphalt Pavement | 26,215.91 | m³ | 301,784,556.00 |
| Mixed Concrete | 166,164.48 | m³ | 152,374,577,871.97 |
| Skinny Concrete | 89,553.71 | m³ | 66,612,154,905.72 |
| Reinforcement | 1,513,062.1 | m³ | 19,568,054,442.82 |
| Channel | 6,018.52 | kg | 3,726,544,594.45 |
| Traffic signs | 151 | Pcs | 87,580,000.00 |
| Guard Rail | 42,080 | m³ | 10,268,572,000.00 |
| Total Cost | 952,053,674,810.00 | ||
| Rounding Cost (2020) | 952,053,675,000.00 | ||
| Toll Road Construction Costs (2025) | 1,074,802,673,757.90 | ||
| Time | Group 1 | PCU/Hour |
|---|---|---|
| 06.00-07.00 | 578 | 578 |
| 06.15-07.15 | 608 | 608 |
| 06.30-07.30 | 628 | 628 |
| 06.45-07.45 | 592 | 592 |
| 07.00-08.00 | 486 | 486 |
| Total | 2,892 | 2,892 |
| Route 1 (Existing Arterial Road, IDR) | Route 2 (Toll Road, IDR) | Cost Difference (IDR) | Utol - Uarteri (Utility) | Toll (Vehicle/ Hour) | Artery (Vehicle/ Hour) |
|---|---|---|---|---|---|
| 200,000 | 230,000 | 30,000 | -0.5050 | 236 | 392 |
| 200,000 | 215,000 | 15,000 | -0.1352 | 293 | 335 |
| 200,000 | 200,000 | 0 | 0.2347 | 351 | 277 |
| 215,000 | 200,000 | -15,000 | 0.6046 | 406 | 222 |
| 230,000 | 200,000 | -30,000 | 0.9745 | 456 | 172 |
| Financial Parameter | Pessimistic Scenario | Moderate Scenario | Optimistic Scenario |
|---|---|---|---|
| Benefit (IDR) | 789,242,532,718.00 | 1,470,240,170,722.00 | 2,097,166,604,121.00 |
| Cost (IDR) | 1,693,421,980,722.00 | 1,693,421,980,722.00 | 1,693,421,980,722.00 |
| B/C Ratio | 0.467 | 0.868 | 1.238 |
| Net Present Value (NPV, IDR) | - 511,344,241,537.00 | - 24,474,042,503.00 | 432,738,668,342 |
| Internal Rate of Return (IRR) | - 2.54% | 2.86% | 6.55% |
| Payback period | 73 years | 24 years | 16 years |
In the analysis, results are presented for the smallest (pessimistic), medium, and largest (optimistic) toll road selection volumes (236, 351, and 456 vehicles/hour, respectively). Vehicle growth is about 0.14%36), and the inflation rate is about 3.08%. The next stage of financial analysis is toll tariff analysis (benefit) with a 20-year concession. As presented in Table 12, the analysis is divided into Pessimistic, Moderate, and Optimistic Financial Analysis.
Beyond financial considerations, the Malang-Kepanjen toll road offers opportunities for sustainable infrastructure development that align with Indonesia's climate commitments. From a materials perspective, adoption of high early-strength concrete (HESC) incorporating hydraulic cement with lower clinker content offers potential CO₂ emission reductions of up to 13.64% compared to Ordinary Portland Cement without sacrificing structural performance35). Given the substantial concrete requirements evident in Table 9 (166,164 m³ of mixed concrete and 89,553 m³ of lean concrete), material selection represents a significant lever for sustainability in this project. From an operational perspective, toll roads can reduce vehicle emissions by reducing idling time and achieving more consistent travel speeds than congested arterial roads. Previous research has demonstrated that urban areas with improved mobility infrastructure exhibit more efficient population movement patterns and lower energy consumption30). The Malang-Kepanjen toll road, by providing an alternative to the congested 22.3-km arterial route, may contribute to regional emission-reduction objectives. However, a comprehensive environmental impact assessment should quantify these potential benefits against construction-phase emissions.
4.4. Financial Feasibility of Malang-Kepanjen Toll Road
The feasibility analysis for the Malang-Kepanjen toll road construction is based on vehicle traffic volume. The feasibility analysis of the Malang-Kepanjen toll road is based on the volume of vehicles passing through the toll road. This report presents pessimistic, moderate, and optimistic scenarios for vehicle volume analysis.
The pessimistic scenario is carried out using the smallest vehicle volume. This scenario must still be factored in and its results analysed, as this condition was also observed in research on the Trans-Sumatra Roll Road, where the actual average daily traffic volume on the toll road showed a downward trend, which could affect future toll road revenue37). The benefit of the toll rate is smaller than its cost, with a B/C ratio of 0.467. This value is less than 1, so the result is infeasible. The resulting NPV is negative, indicating infeasibility, and the resulting IRR is also negative and below the inflation rate of 3.08%, further indicating infeasibility. The investment payback period is 73 years, which exceeds the 20-year concession period; therefore, it is not feasible.
A moderate scenario uses vehicle volume at the middle/normal value. The benefit of the toll rate is smaller than its cost, with a B/C ratio of 0.868. This value is less than 1, so the result is infeasible. The resulting NPV is negative, indicating infeasibility, and the IRR is 2.86%, which is still below the inflation rate of 3.08%, further indicating infeasibility. The investment payback period is 24 years, which exceeds the 20-year concession period; therefore, it is not feasible.
The optimistic scenario is implemented using the maximum vehicle volume. The benefits of the toll tariff exceed its costs, with a B/C ratio of 1.238. This value exceeds 1, so the result is feasible. The resulting NPV is IDR 432,738,668,342, indicating feasibility. The resulting IRR is 6.55%, which is above the inflation rate of 3.08%, further supporting feasibility. The investment payback period is 16 years, which is shorter than the 20-year concession period, indicating feasibility.
Pessimistic and Moderate Scenarios are consistent with prior research. The planned toll road is not financially feasible and cannot be made feasible without additional operational funds. However, the Malang-Kepanjen toll road could be feasible if there is substantial income from vehicles passing through it (Optimistic Scenario). This aligns with a previous study indicating that investors and stakeholders rely on route choice behaviour when evaluating infrastructure investments, as route choice directly impacts the demand and revenue of infrastructure projects38).
The route choice analysis reveals important behavioral insights for toll road planning in secondary city contexts. The indicative equilibrium toll tariff suggests relatively high price sensitivity among potential users, consistent with the predominantly middle-income respondent profile (39% earning IDR 2-4 million monthly). This finding aligns with previous Indonesian toll road studies15) but differs from metropolitan corridors, where time savings often dominate cost considerations in route choice decisions.
The finding that users accept additional toll-road travel time is interpretable within behavioral theory. Users appear to derive utility from toll road attributes beyond pure time savings—specifically, perceived safety, comfort, journey reliability, and reduced stress from avoiding congested arterial conditions. This 'comfort premium' has been documented in Asian transport contexts14) and suggests that toll road marketing should emphasize qualitative journey benefits alongside quantitative time savings. This aligns with the findings in Haifa, which indicate that drivers exaggerate the benefits of the toll road to differentiate it from the non-toll alternative, thereby justifying their choice to take the toll route39). For the Malang-Kepanjen corridor, where actual time savings may be modest given the relatively short distance (21.04 km), this comfort premium may be critical for user adoption.
The financial feasibility results highlight the challenging economics of secondary-city toll roads in Indonesia. Only the optimistic scenario achieves standalone viability (BCR=1.238), which requires sustained high traffic volumes and favorable toll-arterial cost differentials. The moderate scenario (BCR=0.868) falls short despite reasonable traffic assumptions, suggesting that toll revenue alone may be insufficient to recover investment without complementary funding mechanisms.
These findings have implications for Indonesian toll road policy. For secondary-city corridors like Malang-Kepanjen, public-private partnership models may require availability payment structures or minimum revenue guarantees rather than the pure demand-risk concessions typical of metropolitan toll roads. The government's strategic interest in regional connectivity and economic development in Malang Raya may justify viability gap funding, particularly given broader economic multiplier effects not captured in the direct financial analysis.
4.5. Study Limitations
Several limitations should be considered when interpreting these findings. First, the sample size of 100 respondents, while adequate for exploratory feasibility assessment, limits statistical power and generalizability. The Slovin formula for sample determination is a heuristic that does not account for heterogeneity in route-choice behavior across user segments. Future studies should employ larger probability samples, stratified by key demographic and trip characteristics, to enhance representativeness.
Second, stated-preference methods capture hypothetical choices that may diverge from actual behavior once the toll road is operational. The intention-behavior gap is well documented in transportation research, and post-construction validation using revealed-preference data would strengthen confidence in the behavioral parameters estimated here. The equilibrium toll tariff and time acceptance values should therefore be treated as indicative thresholds rather than precise predictions.
Third, the financial analysis employs deterministic assumptions (a single inflation rate and constant vehicle growth) that do not fully capture macroeconomic uncertainty. Monte Carlo simulation or real options analysis would provide more robust investment guidance under uncertainty. Additionally, the analysis excludes external risk factors such as competing route development, regional land-use changes, or shifts in economic conditions that could affect traffic demand.
Fourth, environmental and social impacts are discussed qualitatively rather than quantified through comprehensive life-cycle assessment or social cost-benefit analysis. Future comprehensive feasibility studies should integrate environmental sustainability metrics with financial analysis to provide a complete assessment of project viability.
5. Conclusions
This study developed an integrated analytical framework that links route choice behavior analysis to financial feasibility assessment for the proposed Malang-Kepanjen Toll Road. The framework addresses a methodological gap in toll road feasibility studies, where behavioral and financial analyses are typically conducted separately, with disconnected assumptions.
The stated-preference analysis indicates a toll tariff threshold at which users are equally likely to choose toll or arterial routes, reflecting the price sensitivity of potential users in this secondary city context. Users are willing to accept longer toll-road travel times due to perceived comfort and reliability benefits—a finding with implications for toll-road service quality and marketing strategies.
Financial feasibility varies substantially across traffic scenarios derived from behavioral analysis. The optimistic scenario achieves standalone financial viability within the 20-year concession period, whereas the moderate and pessimistic scenarios indicate the need for complementary funding mechanisms, such as viability gap funding or availability payment structures. These findings suggest that secondary-city toll roads in Indonesia may require different public-private partnership structures than those for metropolitan corridors, where traffic demand is more assured.
The study contributes to the infrastructure planning methodology by demonstrating how behavioral parameters can directly inform financial scenarios, offering a more coherent approach than analyses that treat user behavior and investment viability as separate concerns. The integrated framework is transferable to other pre-construction toll road assessments in Indonesia and to similar contexts in other developing countries.
Future research should employ larger probability samples and discrete choice modeling to improve the precision of behavioral parameters, validate stated preferences against post-construction revealed behavior, and incorporate uncertainty analysis through Monte Carlo simulation. An environmental sustainability assessment using life-cycle analysis would also strengthen the comprehensive evaluation of similar infrastructure projects.
Acknowledgements
The authors would like to thank the Department of Civil Engineering, Faculty of Engineering, Universitas Brawijaya for supporting the administrative letter for this research. The authors also acknowledge the cooperation of the driver and passenger who participated in the survey.
Nomenclature
| Symbol | Description (Unit) |
|---|---|
| b0 | Constant (-) |
| bn | Model parameter coefficient (-) |
| PARTERI | Probability of arterial road (-) |
| PTOLL | Probability of toll road (-) |
| Xn | Difference in toll and arterial attributes (IDR or minutes) |
Appendix A
ROUTE CHOICE SURVEY QUESTIONNAIRE
TOLL ROAD AND NON-TOLL ROAD (ARTERIAL) SAWOJAJAR - KEPANJEN
Note: Please mark (✓) on the selected answer
| Gender | 1. Male |
|---|---|
| 2. Female | |
| Age | 1. 17-20 Years Old |
| 2. 21-30 Years Old | |
| 3. 31-40 Years Old | |
| 4. 41-50 Years Old | |
| 5. > 50 Years Old | |
| Education | 1. Elementary School |
| 2. Junior High School | |
| 3. Senior High School | |
| 4. Bachelor's Degree | |
| 5. Master's/Doctor Degree | |
| Occupation | 1. Student |
| 2. Government Employees | |
| 3. Soldiers/Police | |
| 4. Private | |
| 5. Self-Employed | |
| 6. Others | |
| Monthly Income | 1. ≤ Rp. 2.000.000 |
| 2. ≥ Rp. 2.000.000 - Rp. 5.000.000 | |
| 3. ≥ Rp. 5.000.000 - Rp. 7.000.000 | |
| 4. ≥ Rp. 7.000.000 - Rp. 10.000.000 | |
| 5. ≥ Rp. 10.000.000 - Rp. 15.000.000 | |
| 6. > Rp. 15.000.000 |
| Respondents | Choice/Option | ||||
|---|---|---|---|---|---|
| Gender | Age | Education | Occupation | Monthly Income | |
| 1 | 2 | 2 | 4 | 5 | 1 |
| 2 | 1 | 5 | 4 | 1 | 2 |
| 3 | 1 | 3 | 4 | 6 | 2 |
| 4 | 2 | 5 | 5 | 5 | 1 |
| 5 | 1 | 3 | 4 | 1 | 3 |
| 6 | 1 | 2 | 4 | 2 | 2 |
| 7 | 2 | 5 | 4 | 6 | 4 |
| 8 | 2 | 3 | 3 | 5 | 2 |
| 9 | 1 | 2 | 4 | 4 | 2 |
| 10 | 1 | 5 | 4 | 4 | 1 |
| 11 | 1 | 3 | 4 | 1 | 2 |
| 12 | 2 | 1 | 4 | 5 | 1 |
| 13 | 1 | 2 | 4 | 2 | 2 |
| 14 | 2 | 3 | 4 | 1 | 4 |
| 15 | 1 | 5 | 5 | 6 | 6 |
| 16 | 1 | 2 | 4 | 5 | 1 |
| 17 | 1 | 4 | 4 | 6 | 2 |
| 18 | 2 | 3 | 4 | 4 | 2 |
| 19 | 1 | 2 | 4 | 2 | 2 |
| 20 | 2 | 2 | 4 | 5 | 1 |
| 21 | 1 | 5 | 3 | 1 | 2 |
| 22 | 2 | 3 | 4 | 5 | 2 |
| 23 | 1 | 1 | 4 | 1 | 1 |
| 24 | 1 | 2 | 3 | 2 | 2 |
| 25 | 2 | 3 | 4 | 6 | 2 |
| 26 | 1 | 4 | 4 | 5 | 3 |
| 27 | 1 | 3 | 4 | 5 | 2 |
| 28 | 2 | 5 | 4 | 1 | 1 |
| 29 | 1 | 2 | 4 | 4 | 2 |
| 30 | 1 | 3 | 5 | 6 | 4 |
| 31 | 2 | 3 | 4 | 5 | 1 |
| 32 | 1 | 5 | 4 | 2 | 2 |
| 33 | 1 | 2 | 4 | 1 | 2 |
| 34 | 2 | 4 | 4 | 5 | 3 |
| 35 | 1 | 3 | 4 | 4 | 2 |
| 36 | 1 | 5 | 4 | 6 | 6 |
| 37 | 2 | 2 | 4 | 5 | 1 |
| 38 | 1 | 2 | 4 | 1 | 2 |
| 39 | 2 | 3 | 4 | 2 | 2 |
| 40 | 1 | 4 | 4 | 5 | 3 |
| 41 | 1 | 1 | 3 | 1 | 1 |
| 42 | 2 | 2 | 4 | 4 | 2 |
| 43 | 1 | 5 | 5 | 6 | 5 |
| 44 | 1 | 3 | 4 | 1 | 2 |
| 45 | 2 | 2 | 4 | 5 | 1 |
| 46 | 1 | 4 | 3 | 2 | 3 |
| 47 | 1 | 3 | 4 | 6 | 2 |
| 48 | 2 | 5 | 4 | 5 | 1 |
| 49 | 1 | 2 | 4 | 1 | 2 |
| 50 | 2 | 3 | 4 | 4 | 2 |
| 51 | 1 | 5 | 4 | 6 | 4 |
| 52 | 1 | 2 | 4 | 2 | 2 |
| 53 | 2 | 1 | 3 | 1 | 1 |
| 54 | 1 | 3 | 4 | 5 | 2 |
| 55 | 1 | 2 | 4 | 4 | 2 |
| 56 | 2 | 4 | 4 | 2 | 3 |
| 57 | 1 | 5 | 5 | 6 | 6 |
| 58 | 1 | 3 | 4 | 1 | 2 |
| 59 | 2 | 2 | 4 | 5 | 1 |
| 60 | 1 | 1 | 3 | 1 | 1 |
| 61 | 1 | 3 | 4 | 4 | 2 |
| 62 | 2 | 5 | 4 | 6 | 4 |
| 63 | 1 | 2 | 4 | 2 | 2 |
| 64 | 1 | 3 | 4 | 5 | 2 |
| 65 | 2 | 1 | 3 | 1 | 1 |
| 66 | 1 | 4 | 4 | 5 | 3 |
| 67 | 1 | 2 | 4 | 4 | 2 |
| 68 | 2 | 5 | 4 | 5 | 1 |
| 69 | 1 | 3 | 4 | 1 | 3 |
| 70 | 2 | 2 | 4 | 2 | 2 |
| 71 | 1 | 3 | 4 | 6 | 2 |
| 72 | 1 | 5 | 5 | 6 | 5 |
| 73 | 2 | 1 | 4 | 1 | 1 |
| 74 | 1 | 2 | 4 | 4 | 2 |
| 75 | 1 | 3 | 4 | 5 | 2 |
| 76 | 2 | 4 | 4 | 2 | 3 |
| 77 | 1 | 5 | 4 | 5 | 1 |
| 78 | 2 | 2 | 3 | 1 | 1 |
| 79 | 1 | 3 | 4 | 4 | 2 |
| 80 | 1 | 2 | 4 | 2 | 2 |
| 81 | 2 | 5 | 5 | 6 | 6 |
| 82 | 1 | 1 | 4 | 1 | 1 |
| 83 | 2 | 3 | 4 | 5 | 2 |
| 84 | 1 | 2 | 4 | 4 | 2 |
| 85 | 1 | 4 | 4 | 5 | 3 |
| 86 | 2 | 5 | 4 | 6 | 4 |
| 87 | 1 | 3 | 4 | 1 | 2 |
| 88 | 1 | 2 | 4 | 5 | 1 |
| 89 | 2 | 1 | 3 | 1 | 1 |
| 90 | 1 | 3 | 4 | 4 | 2 |
| 91 | 2 | 5 | 5 | 6 | 5 |
| 92 | 1 | 2 | 4 | 2 | 2 |
| 93 | 1 | 4 | 4 | 5 | 3 |
| 94 | 2 | 3 | 4 | 5 | 2 |
| 95 | 1 | 5 | 4 | 6 | 4 |
| 96 | 1 | 2 | 4 | 4 | 2 |
| 97 | 2 | 1 | 4 | 1 | 1 |
| 98 | 1 | 3 | 4 | 5 | 2 |
| 99 | 2 | 5 | 5 | 6 | 6 |
| 100 | 1 | 4 | 4 | 2 | 3 |
STATED PREFERENCE
Sir/Madam/Respondent are requested to choose one of the numbers from 1-5 by marking a cross (x) in several attribute change situations below, with the following notes:
Option 1: You will definitely choose Toll
Option 2: You might choose Toll
Option 3: Balanced choice (Undecided / Neutral)
Option 4: You might choose Non-Toll (Arterial)
Option 5: You will definitely choose Non-Toll (Arterial)
| Travel Time Scenario (minutes) | Route Choice Options | |||||
|---|---|---|---|---|---|---|
| Route 1 (Existing/ Arterial) | Route 2 (Planned Toll Road) | 1 | 2 | 3 | 4 | 5 |
| Definitely choose toll road | Probably choose toll road | Balanced choice / Neutral | Probably choose arterial road | Definitely choose arterial road | ||
| 50 | 20 | |||||
| 35 | 20 | |||||
| 20 | 20 | |||||
| 20 | 35 | |||||
| 20 | 50 | |||||
| Travel Cost Scenario (Rupiah) | Route Choice Options | |||||
|---|---|---|---|---|---|---|
| Route 1 (Existing/ Arterial) | Route 2 (Planned Toll Road) | 1 | 2 | 3 | 4 | 5 |
| Definitely choose toll road | Probably choose toll road | Balanced choice / Neutral | Probably choose arterial road | Definitely choose arterial road | ||
| 200.000 | 230.000 | |||||
| 200.000 | 215.000 | |||||
| 200.000 | 200.000 | |||||
| 215.000 | 200.000 | |||||
| 230.000 | 200.000 | |||||
TRANSFORMATION OF ORDINAL DATA
| Scale | Response | Probability Scale (P) | Utility |
|---|---|---|---|
| 1 | Definitely Choose Toll Road / Route | 0.9 | 2.1972 |
| 2 | Probably Choose Toll Road / Route | 0.7 | 0.8473 |
| 3 | Indifferent / Neutral Choice | 0.5 | 0.0000 |
| 4 | Probably Choose Arterial Road / Route | 0.3 | -0.8473 |
| 5 | Definitely Choose Arterial Road / Route | 0.1 | -2.1972 |
| Respondents | Cost Differential (Rupiah) | Choice/Scale | Utility / Numeric Scale (Berkson-Theil) |
|---|---|---|---|
| (ΔX) | (Y) | ||
| 1 | 30000 | 5 | -2.1972 |
| 2 | 15000 | 4 | -0.8473 |
| 3 | -30000 | 1 | 2.1972 |
| 4 | -15000 | 2 | 0.8473 |
| 5 | -15000 | 2 | 0.8473 |
| 6 | 0 | 3 | 0.0000 |
| 7 | -15000 | 2 | 0.8473 |
| 8 | 30000 | 5 | -2.1972 |
| 9 | 30000 | 5 | -2.1972 |
| 10 | 0 | 3 | 0.0000 |
| 11 | -15000 | 1 | 2.1972 |
| 12 | -30000 | 1 | 2.1972 |
| 13 | 15000 | 4 | -0.8473 |
| 14 | 15000 | 4 | -0.8473 |
| 15 | 30000 | 5 | -2.1972 |
| 16 | 0 | 3 | 0.0000 |
| 17 | 30000 | 4 | -0.8473 |
| 18 | 0 | 2 | 0.8473 |
| 19 | 30000 | 4 | -0.8473 |
| 20 | 0 | 2 | 0.8473 |
| 21 | 15000 | 4 | -0.8473 |
| 22 | 0 | 2 | 0.8473 |
| 23 | 0 | 3 | 0.0000 |
| 24 | 30000 | 5 | -2.1972 |
| 25 | -15000 | 2 | 0.8473 |
| 26 | -15000 | 2 | 0.8473 |
| 27 | -15000 | 2 | 0.8473 |
| 28 | -15000 | 2 | 0.8473 |
| 29 | 30000 | 4 | -0.8473 |
| 30 | 15000 | 4 | -0.8473 |
| 31 | 0 | 3 | 0.0000 |
| 32 | 0 | 3 | 0.0000 |
| 33 | 15000 | 4 | -0.8473 |
| 34 | 15000 | 4 | -0.8473 |
| 35 | -30000 | 1 | 2.1972 |
| 36 | -15000 | 2 | 0.8473 |
| 37 | 0 | 2 | 0.8473 |
| 38 | 0 | 3 | 0.0000 |
| 39 | 0 | 2 | 0.8473 |
| 40 | 0 | 2 | 0.8473 |
| 41 | -30000 | 1 | 2.1972 |
| 42 | 0 | 2 | 0.8473 |
| 43 | 15000 | 4 | -0.8473 |
| 44 | 30000 | 5 | -2.1972 |
| 45 | 30000 | 5 | -2.1972 |
| 46 | 0 | 3 | 0.0000 |
| 47 | 15000 | 3 | 0.0000 |
| 48 | 0 | 2 | 0.8473 |
| 49 | -30000 | 1 | 2.1972 |
| 50 | -30000 | 1 | 2.1972 |
| 51 | 0 | 3 | 0.0000 |
| 52 | 15000 | 4 | -0.8473 |
| 53 | 15000 | 4 | -0.8473 |
| 54 | 0 | 2 | 0.8473 |
| 55 | -15000 | 2 | 0.8473 |
| 56 | 15000 | 3 | 0.0000 |
| 57 | 0 | 3 | 0.0000 |
| 58 | 30000 | 5 | -2.1972 |
| 59 | -30000 | 1 | 2.1972 |
| 60 | -30000 | 1 | 2.1972 |
| 61 | 30000 | 5 | -2.1972 |
| 62 | 0 | 2 | 0.8473 |
| 63 | 30000 | 5 | -2.1972 |
| 64 | 0 | 2 | 0.8473 |
| 65 | 30000 | 4 | -0.8473 |
| 66 | 15000 | 4 | -0.8473 |
| 67 | 30000 | 5 | -2.1972 |
| 68 | 15000 | 4 | -0.8473 |
| 69 | 15000 | 4 | -0.8473 |
| 70 | -15000 | 2 | 0.8473 |
| 71 | -15000 | 2 | 0.8473 |
| 72 | 0 | 2 | 0.8473 |
| 73 | 30000 | 5 | -2.1972 |
| 74 | -15000 | 2 | 0.8473 |
| 75 | 0 | 2 | 0.8473 |
| 76 | 0 | 2 | 0.8473 |
| 77 | -15000 | 2 | 0.8473 |
| 78 | -15000 | 2 | 0.8473 |
| 79 | 0 | 2 | 0.8473 |
| 80 | -30000 | 1 | 2.1972 |
| 81 | 30000 | 5 | -2.1972 |
| 82 | 15000 | 4 | -0.8473 |
| 83 | -15000 | 4 | 0.8473 |
| 84 | -15000 | 2 | 0.8473 |
| 85 | 30000 | 4 | -0.8473 |
| 86 | 0 | 2 | 0.8473 |
| 87 | -15000 | 1 | 2.1972 |
| 88 | -30000 | 1 | 2.1972 |
| 89 | 30000 | 5 | -2.1972 |
| 90 | 15000 | 3 | 0.0000 |
| 91 | -15000 | 2 | 0.8473 |
| 92 | 15000 | 3 | 0.0000 |
| 93 | 0 | 3 | 0.0000 |
| 94 | 15000 | 3 | 0.0000 |
| 95 | 0 | 3 | 0.0000 |
| 96 | -15000 | 2 | 0.8473 |
| 97 | 30000 | 5 | -2.1972 |
| 98 | 0 | 3 | 0.0000 |
| 99 | 15000 | 4 | -0.8473 |
| 100 | 0 | 3 | 0.0000 |
| Respondents | Time Differential (Rupiah) | Choice/Scale | Utility / Numeric Scale (Berkson-Theil) |
|---|---|---|---|
| (ΔX) | (Y) | ||
| 1 | 15 | 4 | -0.8473 |
| 2 | -30 | 2 | 0.8473 |
| 3 | 30 | 5 | -2.1972 |
| 4 | 0 | 4 | -0.8473 |
| 5 | 15 | 4 | -2.1972 |
| 6 | -15 | 2 | 0.8473 |
| 7 | 30 | 5 | -2.1972 |
| 8 | 0 | 4 | -0.8473 |
| 9 | -30 | 2 | 0.8473 |
| 10 | 15 | 5 | -2.1972 |
| 11 | 0 | 4 | -0.8473 |
| 12 | -15 | 2 | 0.8473 |
| 13 | 30 | 5 | -2.1972 |
| 14 | 15 | 5 | -2.1972 |
| 15 | -30 | 2 | 0.8473 |
| 16 | 0 | 4 | -0.8473 |
| 17 | 15 | 5 | -2.1972 |
| 18 | -15 | 2 | 0.8473 |
| 19 | 30 | 5 | -2.1972 |
| 20 | 0 | 4 | -0.8473 |
| 21 | -15 | 2 | 0.8473 |
| 22 | 30 | 5 | -2.1972 |
| 23 | 15 | 5 | -2.1972 |
| 24 | 0 | 4 | -0.8473 |
| 25 | -30 | 2 | 0.8473 |
| 26 | -15 | 2 | 0.8473 |
| 27 | 30 | 5 | -2.1972 |
| 28 | 0 | 4 | -0.8473 |
| 29 | 15 | 5 | -2.1972 |
| 30 | -15 | 2 | 0.8473 |
| 31 | 30 | 5 | -2.1972 |
| 32 | 0 | 4 | -0.8473 |
| 33 | 15 | 5 | -2.1972 |
| 34 | -30 | 2 | 0.8473 |
| 35 | -15 | 2 | 0.8473 |
| 36 | 30 | 5 | -2.1972 |
| 37 | 0 | 4 | -0.8473 |
| 38 | 15 | 5 | -2.1972 |
| 39 | -15 | 2 | 0.8473 |
| 40 | 30 | 5 | -2.1972 |
| 41 | 0 | 4 | -0.8473 |
| 42 | 15 | 5 | -2.1972 |
| 43 | -30 | 2 | 0.8473 |
| 44 | -15 | 2 | 0.8473 |
| 45 | 30 | 5 | -2.1972 |
| 46 | 0 | 4 | -0.8473 |
| 47 | 15 | 5 | -2.1972 |
| 48 | -15 | 2 | 0.8473 |
| 49 | 30 | 5 | -2.1972 |
| 50 | 0 | 4 | -0.8473 |
| 51 | -15 | 2 | 0.8473 |
| 52 | 15 | 5 | -2.1972 |
| 53 | -30 | 2 | 0.8473 |
| 54 | 0 | 3 | 0.000 |
| 55 | 15 | 5 | -2.1972 |
| 56 | -15 | 3 | 0.000 |
| 57 | 30 | 5 | -2.1972 |
| 58 | 0 | 4 | -0.8473 |
| 59 | -30 | 2 | 0.8473 |
| 60 | 15 | 5 | -2.1972 |
| 61 | 0 | 3 | 0.000 |
| 62 | -15 | 2 | 0.8473 |
| 63 | 30 | 5 | -2.1972 |
| 64 | 15 | 5 | -2.1972 |
| 65 | -30 | 2 | 0.8473 |
| 66 | 0 | 4 | -0.8473 |
| 67 | 15 | 5 | -2.1972 |
| 68 | -15 | 2 | 0.8473 |
| 69 | 30 | 5 | -2.1972 |
| 70 | 0 | 3 | 0.000 |
| 71 | -15 | 2 | 0.8473 |
| 72 | 30 | 5 | -2.1972 |
| 73 | 15 | 5 | -2.1972 |
| 74 | 0 | 4 | -0.8473 |
| 75 | -30 | 2 | 0.8473 |
| 76 | 15 | 5 | -2.1972 |
| 77 | 30 | 5 | -2.1972 |
| 78 | 0 | 3 | 0.000 |
| 79 | -15 | 2 | 0.8473 |
| 80 | -30 | 2 | 0.8473 |
| 81 | 30 | 5 | -2.1972 |
| 82 | 15 | 5 | -2.1972 |
| 83 | 0 | 4 | -0.8473 |
| 84 | -15 | 2 | 0.8473 |
| 85 | 30 | 5 | -2.1972 |
| 86 | 0 | 3 | 0.000 |
| 87 | 15 | 5 | -2.1972 |
| 88 | -30 | 2 | 0.8473 |
| 89 | -15 | 2 | 0.8473 |
| 90 | 0 | 4 | -0.8473 |
| 91 | 30 | 5 | -2.1972 |
| 92 | 15 | 5 | -2.1972 |
| 93 | -30 | 2 | 0.8473 |
| 94 | -15 | 2 | 0.8473 |
| 95 | 0 | 3 | 0.000 |
| 96 | 30 | 5 | -2.1972 |
| 97 | -30 | 2 | 0.8473 |
| 98 | 15 | 5 | -2.1972 |
| 99 | 0 | 4 | -0.8473 |
| 100 | 0 | 4 | -0.8473 |
Appendix B
COST MODEL
Regression
| Descriptive Statistics | |||
|---|---|---|---|
| Mean | Std. Deviation | N | |
| Y | .052706 | 1.3059201 | 100 |
| X | 3000.0000 | 18829.37743 | 100 |
| Correlations | |||
|---|---|---|---|
| Y | X | ||
| Pearson Correlation | Y | 1.000 | -.935 |
| X | -.935 | 1.000 | |
| Sig. (1-tailed) | Y | . | <.001 |
| X | .000 | . | |
| N | Y | 100 | 100 |
| X | 100 | 100 | |
Pearson Correlation
██ Highly Positive: (None)
██ Positive: (None)
██ No Linear Correlation: (None)
██ Negative: (None)
██ Highly Negative: (Y <---> X)
Note: Curated Help is calculated based on actual cell values, not the formatted values.
| Variables Entered/Removeda | |||
|---|---|---|---|
| Model | Variables Entered | Variables Removed | Method |
| 1 | Xb | . | Enter |
| a. Dependent Variable: Y | |||
| b. All requested variables entered. | |||
| Model Summary | |||||||||
|---|---|---|---|---|---|---|---|---|---|
| Model | R | R Square | Adjusted R Square | Std. Error of the Estimate | Change Statistics | ||||
| R Square Change | F Change | df1 | df2 | Sig. F Change | |||||
| 1 | .935a | .874 | .873 | .4655069 | .874 | 681.141 | 1 | 98 | <.001 |
| a. Predictors: (Constant), X | |||||||||
| ANOVAa | ||||||
|---|---|---|---|---|---|---|
| Model | Sum of Squares | df | Mean Square | F | Sig. | |
| 1 | Regression | 147.601 | 1 | 147.601 | 681.141 | <.001b |
| Residual | 21.236 | 98 | .217 | |||
| Total | 168.837 | 99 | ||||
| a. Dependent Variable: Y | ||||||
| b. Predictors: (Constant), X | ||||||
| Coefficientsa | ||||||||
|---|---|---|---|---|---|---|---|---|
| Model | Unstandardized Coefficients | Standardized Coefficients | t | Sig. | 95.0% Confidence Interval for B | |||
| B | Std. Error | Beta | Lower Bound | Upper Bound | ||||
| 1 | (Constant) | .247 | .047 | 5.245 | <.001 | .154 | .341 | |
| X | -0.00006485 | .000 | -.935 | -26.099 | <.001 | .000 | .000 | |
| a. Dependent Variable: Y | ||||||||
TIME MODEL
Regression
| Descriptive Statistics | |||
|---|---|---|---|
| Mean | Std. Deviation | N | |
| Y | -.799176 | 1.3157886 | 100 |
| X | 2.2500 | 19.92885 | 100 |
| Correlations | |||
|---|---|---|---|
| Y | X | ||
| Pearson Correlation | Y | 1.000 | -.935 |
| X | -.935 | 1.000 | |
| Sig. (1-tailed) | Y | . | <.001 |
| X | .000 | . | |
| N | Y | 100 | 100 |
| X | 100 | 100 | |
Pearson Correlation
██ Highly Positive: (None)
██ Positive: (None)
██ No Linear Correlation: (None)
██ Negative: (None)
██ Highly Negative: (Y <---> X)
Note: Curated Help is calculated based on actual cell values, not the formatted values.
| Variables Entered/Removeda | |||
|---|---|---|---|
| Model | Variables Entered | Variables Removed | Method |
| 1 | Xb | . | Enter |
| a. Dependent Variable: Y | |||
| b. All requested variables entered. | |||
| Model Summary | |||||||||
|---|---|---|---|---|---|---|---|---|---|
| Model | R | R Square | Adjusted R Square | Std. Error of the Estimate | Change Statistics | ||||
| R Square Change | F Change | df1 | df2 | Sig. F Change | |||||
| 1 | .935a | .875 | .873 | .4680533 | .875 | 684.378 | 1 | 98 | <.001 |
| a. Predictors: (Constant), X | |||||||||
| ANOVAa | ||||||
|---|---|---|---|---|---|---|
| Model | Sum of Squares | df | Mean Square | F | Sig. | |
| 1 | Regression | 149.929 | 1 | 149.929 | 684.378 | <.001b |
| Residual | 21.469 | 98 | .219 | |||
| Total | 171.399 | 99 | ||||
| a. Dependent Variable: Y | ||||||
| b. Predictors: (Constant), X | ||||||
| Coefficientsa | ||||||||
|---|---|---|---|---|---|---|---|---|
| Model | Unstandardized Coefficients | Standardized Coefficients | t | Sig. | 95.0% Confidence Interval for B | |||
| B | Std. Error | Beta | Lower Bound | Upper Bound | ||||
| 1 | (Constant) | -.660 | .047 | -14.016 | <.001 | -.754 | -.567 | |
| X | -.062 | .002 | -.935 | -26.161 | <.001 | -.066 | -.057 | |
| a. Dependent Variable: Y | ||||||||
References
- R. Ramadhani, A. Yudono, and A. Akil, “The Influence of Accessibility on the Road Connecting the City Center of Karebosi with the Suburban Area of Tanjung Bunga, Makassar City,” Jurnal Wilayah Dan Kota Maritim, 7 16–26 (2019). doi: https://doi.org/10.20956/jwkm.v7i0.1336 (In Bahasa) [DOI]
- H.Z. Pragmadeanti and F. Rahmawati, “Analysis of Leading Sectors and Potential for Developing Economic Growth Centers in the Strategic Area of Malang Raya,” Jurnal Pendidikan Ekonomi (JURKAMI), 7 (1) 46–61 (2022). doi:10.31932/jpe.v7i1.1512. (In Bahasa)
- W. Hari, S. Widodo, A. Hammidah Imadudinna, and A.N. Hidayati, “Study of Regional Economic Disparity Patterns in the Malang Raya Agglomeration Area,” Jurnal Plano Buana, 3 (2) (2023). doi: https://doi.org/10.36456/jpb.v3i2.6801 (In Bahasa) [DOI]
- B. S. Waloejo, I. W. Agustin, S. Hariyani, D. F. Al Himah, and D. F. Al Khariri, “The effect of land use on the road’s level of service at Sultan Agung Road, Malang Regency,” Evergreen 11 (2) 1136–1147 (2024). doi:10.5109/7183416
- W.H. Pradito, and W. Herijanto, “Geometric Design and Pavement of the Malang-Kepanjen Toll Road,” Jurnal Sains Dan Seni ITS, 9 (2) 139–145 (2020). doi:10.12962/j23373539.v9i2.52924 (In Bahasa)
- J.T. Haryamurti, A. Mhm, and D. Handayani, “Study of Route Selection Variables Based on Road Users Using Stated Preference Techniques (Case Study of the Northern Ring Road Section of Surakarta City),” Matriks Teknik Sipil, 5 (4) 1473 (2017). https://jurnal.uns.ac.id/matriks/article/view/36927 (In Bahasa)
- F. Salam Ahmad, “The Impact of the Construction of the Trans Java Toll Road on Economic Growth in Central Java,” Jurnal Ekonomi Dan Kebijakan Pembangunan, 11 (1) 1–18 (2022). doi:10.29244/jekp.11.1.2022.1-18. (In Bahasa)
- B. Yafril, and M. Priyambodho, “Feasibility of north Tangerang toll road construction,” Syntax Admiration, 4 (4) (2023). doi:10.46799/jsa.v4i4.574
- J. Krisnananda and A.A.G. Kartika, “Economic and Financial Feasibility Analysis of the Construction of the Mengwi-Gilimanuk Toll Road,” Jurnal Teknik ITS, 10 (2) (2021). doi:10.12962/j23373539.v10i2.69868 (In Bahasa)
- S. McLeod, “Feasibility studies for novel and complex projects: principles synthesized through an integrative review,” Project Leadership and Society, 2 100022 (2021). doi:10.1016/j.plas.2021.100022.
- A. Y. Nurhidayat, A. Roschyntawati, S. P. Primadiyanti, D. P. Upahita, and T. Fiantika, "Impact of Traffic Volume on Vehicle Operation Cost after Covid-19 Pandemic in DKI Jakarta," Evergreen 11(3) 2458-2467 (2024). doi:10.5109/7236888
- M. A. Berawi, T. Y. Zagloel, P. Miraj, A. R. B. Berawi, W. Titaheluw, and S. B. B. A. Karim, “Developing Road Infrastructure Route Planning: Increasing Feasibility of Toll Road Project,” Makara Journal of Technology, 20 (3) 147-152 (2016). doi:10.7454/mst.v20i3.3070.
- A. Amrizal, “Analysis of Medan-Tebing Tinggi Travel Route Selection Using the Stated Preference Method,” Proceeding Seminar Nasional Ketekniksipilan Bidang Vokasional, Bali. 121-127 (2018). https://www.researchgate.net/publication/331891813. (In Bahasa)
- M. Amirgholy, N. Golshani, C. Schneider, E.J. Gonzales, and H.O. Gao, “An advanced traveler navigation system adapted to route choice preferences of the individual users,” International Journal of Transportation Science and Technology, 6 (4) 240–254 (2017). doi:10.1016/j.ijtst.2017.10.001.
- D.A. Susanto, A. Purba, and C. Niken, “Route Selection of Toll Roads Using Discrete Choice Models of Users,” Rekayasa: Jurnal Ilmiah Fakultas Teknik Universitas Lampung, 24 (2) 33–36 (2020). doi:10.23960/rekrjits.v24i2.13. (In Bahasa)
- S. Suwito, L. D. Nugroho, and H. Muhammadun, “Feasibility analysis of a batching plant investment for the Kediri-Tulungagung toll road project,” International Journal of Social Service and Research, 5 (1) 57–66 (2025). doi:10.46799/ijssr.v5i1.1183
- W. Aulia and C. Buana, “Feasibility Study of Serpong-Cinere Toll Road Reviewed from Economic and Financial Perspectives,” Jurnal Teknik ITS, 8 (2) E154–E159 (2019). doi:10.12962/j23373539.v8i2.48066 (In Bahasa)
- M. Park, Y. Chu, H.-S. Lee, and W. Kim, “Evaluation methods for construction projects,” Journal of Civil Engineering and Management, 15 (4) 349–359 (2009). doi:10.3846/1392-3730.2009.15.349-359.
- Firdasari, M. Purwandito, and Syahfitriani, “Feasibility Analysis of Subsidized Housing Development Investment in Aceh Tamiang District,” Serambi Engineering, 7 (2) (2022). doi:10.32672/jse.v7i2.4094 (In Bahasa)
- S. Suandi and N. Chayati, “Financial Feasibility Study on the Pongkor Mini Hydro Power Plant (PLYM) Development Project,” in: Proceeding Seminar Nasional Sains dan Teknologi 2018, (2018). jurnal.umj.ac.id/index.php/semnastek. (In Bahasa)
- E. S. de Amorim, G. M. Sampaio, A. A. Vieira, and A. C. Lordsleem Júnior, “Economic-financial feasibility analysis of projects in historic sites: Case of Engenho Monjope,” MIX Sustentável, 10 (3) 213–230 (2024) doi:10.29183/2447-3073.MIX2024.v10.n3.213-230.
- M. A. Berawi, T. Y. M. Zagloel, A. R. B. Berawi, and Y. Abdurachman, "Feasibility analysis of Trans-Sumatera Toll Road using value engineering method," International Journal of Technology, 6 (3) 388–399 (2015). doi:10.14716/ijtech.v6i3.1475.
- J. Holguín-Veras, D. Sackey, S. Hussain, and V. Ochieng, “Economic and financial feasibility of truck toll lanes,” Transportation Research Record: Journal of the Transportation Research Board 1833 66-73 (2003). doi: https://doi.org/10.3141/1833-09 [DOI]
- E. Febrianne Mahayu Fitri Ramadhani, “Feasibility Study of the Graha Natura Housing Development Project in Surabaya,” Jurnal Rekayasa dan Manajemen Konstruksi, 7 (1) 53–66 (2019). doi:10.30742/axial.v7i1.708 (In Bahasa)
- BPS-Statistics of Jawa Timur Province, “Jawa Timur Province in Figures,” 2023. https://jatim.bps.go.id/id/publication/2023/02/28/446036fbb58d36b009212dbc/provinsi-jawa-timur-dalam-angka-2023.html (accessed in May, 24, 2024). (In Bahasa)
- W. Kriswardhana, N. N. Hayati, and I. T. Kuncahyo, “The Feasibility Study of Pasuruan – Probolinggo Tollroad,” Jurnal Rekayasa Sipil dan Lingkungan, 1 (2) 131–137 (2017). doi:10.19184/jrsl.v1i02.5907. (In Bahasa)
- B.P. Perdana, I. Elvina, and Devia, “Analysis of Public Transport Travel Fares Based on Vehicle Operational Costs (BOK) for the Palangka Raya-Kasongan City Route,” Jurnal Basement, 1 (2) 123–133 (2023). doi:10.36873/basement.v1i2.9881 (In Bahasa)
- Ministry of Public Works and Public Housing, “Tariff check” (n.d.). https://bpjt.pu.go.id/cek-tarif-tol (accessed September 9, 2024). (In Bahasa)
- Bank Indonesia, “Inflation data,” (2024). https://www.bi.go.id/id/statistik/indikator/data-inflasi.aspx (accessed September 9, 2024). (In Bahasa)
- Wicaksono, A.D., Agustina, D., & Ningtyas, V.Y.R. “Sustainable Urban Mobility: Level of People Mobilization in Surabaya”. Evergreen, 11 (02) 1116–1124 (2024). doi:10.5109/7183413
- N. F. A. Sari and H. Widyastuti, “Economic and Financial Feasibility Analysis of the Development of the Pandaan – Malang Toll Road,” Jurnal Teknik ITS, 8 (1) E13–E19 (2019). doi:10.12962/j23373539.v8i1.41495 (In Bahasa)
- L. Zheng, H. Ma, and Z. Wang, “Travel time estimation for urban arterials based on the multi-source data,” Sustainability, 16 (17) 7845 (2024). doi:10.3390/su16177845.
- H.T. Nguyen, M.M. Me Ko, B. Van Tuan, S. Takeda, and H. Kato, “Is service quality sufficient to attract users to toll roads in Hanoi, Vietnam?,” International Journal of Intelligent Transportation Systems Research, 23 (3) 1509–1523 (2025). doi:10.1007/s13177-025-00526-4.
- H. K. Chaudhary, K. Saraswat, H. Yadav, H. Puri, A. R. Mishra, and S. S. Chauhan, “A Real Time Dynamic Approach for Management of Vehicle Generated Traffic,” Evergreen 10 (1) 289–299 (2023). doi:10.5109/6781078
- Santosa, A. H. S., Masniari, O., Dewi, E. C., Darmawan, C. R., Rahayu, S., & Asriana, N. “Sustainable High-performance Concrete for Transportation Infrastructure Developments”. Evergreen, 11(04) 3653–3672 (2024) doi:10.5109/7326997
- BPS-Statistic of Malang Municipality, “Malang Municipality in Figures 2023,” Malang, 2023. https://malangkota.bps.go.id/id/publication/2023/02/28/b600ebe2a1d407de59d12a90/kota-malang-dalam-angka-2023.html (accessed in May, 24, 2024). (In Bahasa)
- M. Wiraharjo, B. Susanti, and E. Kadarsa, “Financial feasibility analysis of cost and traffic volume: case study on toll road investment project,” Engineering and Applied Science Research, 49 (3) 308–315 (2022). doi:10.14456/easr.2022.32.
- Ö. Inal, M.A. Silgu, and A.H. Lav, “State of the art: route choice decisions in transportation systems,” Arab. J. Sci. Eng., (2026). doi:10.1007/s13369-026-11336-5.
- E. Tenenboim, N. Munichor, and Y. Shiftan, “Justifying toll payment with biased travel time estimates: behavioral findings and route choice modeling,” Transportation (Amst)., 50 (2) 477–511 (2023). doi:10.1007/s11116-021-10251-y.