
Abstract
It is difficult for regular greenhouses to maintain stable temperature, humidity, and airflow, which affects the growth of plants inside them and increases energy consumption. The purpose of this study was to evaluate three different configurations of ventilation in the greenhouse system by simulating and testing them using CFD under the climate conditions of Baghdad. The temperature, humidity, and airflow velocity data were analyzed using ANSYS Fluent. An automated greenhouse control powered with solar cells was built for real-world evaluation to compare these configurations. The best performance (temperature 26.07-27.19°C, relative humidity 60.85-81.25%, and airflow velocity 0.396m/s) was exhibited by the configuration with an upper fan and upper ventilation openings. Due to reduced temperature variation from ±4.5 to ±0.6°C, the climate stabilization improved by approximately 15–20%. In addition, the optimized greenhouse system produced 27.1% less energy consumption; therefore, it could serve as an environmentally and energy-efficient growing facility.
Keywords: Airflow velocity, automated greenhouse, climate stability, humidity, temperature
Outline
1. Introduction
A greenhouse is an enclosed area constructed using transparent materials and equipped with a partial or comprehensive management system to optimize crop production conditions. The greenhouse effect entails the retention of heat by a light-permeable barrier, which elevates the internal temperature by allowing sunlight to enter while simultaneously increasing the humidity.
Agricultural and crop development technologies have progressed markedly over the past few decades. Consequently, owing to the irregular natural distribution of rainfall, farmers must oversee the fair allocation of water to all crops based on their specific needs. No optimal irrigation technique is universally applicable to all climatic conditions and soil compositions. Greenhouse technology may be the optimal solution. Farmers in many countries use outdoor greenhouses to increase their crop yields.
Nonetheless, greenhouse agriculture is an energy-intensive and fossil fuel-dependent method that substantially contributes to greenhouse gas emissions.
Implementing energy conservation methods offers a pragmatic approach to address this issue and substitute conventional energy sources with renewable alternatives. In recent years, researchers have developed methods for integrating solar energy with greenhouses. This study analyzed the evolution of photovoltaic (PV) agriculture. Previous studies have shown that growing plants in a greenhouse is one of the most effective options, provided that certain conditions are met. An effective and prosperous greenhouse seeks to provide plants with optimal climatic conditions 1).
As sustainability has been invested in many contemporary applications, its importance has increased. Users are starting to favor renewable energy sources2,3), such as wind, solar, etc. Solar energy can be utilized for many applications, including irrigation4-6), air heating7-9), agricultural drying10,11), water heating12-14), power production15,16), and greenhouses17-19). Solar energy is becoming more attractive practically all over the world.
Greenhouses are garden structures made from either glass or plastic (or a mixture of both) designed for the purpose of allowing plants to grow at optimally cool or warm temperatures, depending upon seasonal weather changes. A greenhouse provides many advantages, such as increased yield due to the creation of a controlled environment, protection from wind, rain, and extreme temperatures, and the ability to increase the length of time a crop can be grown; however, there are also significant drawbacks associated with this method of gardening, including high construction costs, high operating costs, and a higher incidence of disease and insect infestations caused by the presence of living organisms within the confines of an enclosed space. The function of these structures is affected by multiple factors, including performance of heating and air conditioning systems; temperatures, airflow, and humidity levels determined by building design; and renewable energy sources (i.e., solar panels) that provide additional cost savings to the structure through operation.
Addressing these issues and maximizing the influencing factors is critical for creating a highly efficient and productive greenhouse system capable of meeting modern agricultural demands20). The changing climate has a direct effect on future food consumption, raising concerns about consumer food insecurity. The importance of successful agricultural systems can be stressed by recognizing the importance of identifying both agricultural yields and quality21,22).
The popularity of protected agriculture, such as greenhouse farming, has increased owing to its regulated environment and high output. According to statistical data, greenhouse farming accounts for approximately 3.64 million hectares worldwide, with food production in these buildings experiencing a significant increase in recent years23,24). Greenhouse-based food production25) is a promising approach to ensure sustainability in the future, as evidenced by this trend18).
Many studies have addressed greenhouse issues. In an advanced greenhouse, continuous monitoring of both internal and external contextual information guarantees that the interior atmosphere is conducive to crop cultivation. Several factors, such as soil moisture, climatic temperature, humidity, and airflow, influence plants cultivated in a greenhouse. Consequently, researchers have focused on designing and implementing systems for monitoring climatic conditions and managing the diverse equipment associated with outputs, such as water pump and fan. These studies can be organized into thematic groups before going into detail.
First, many studies have focused on ventilation and airflow improvement. Researchers such as Villagran et al.26), Lyu et al.27), Wangkahart et al.28), and Ghibeche et al.29) have used computational fluid dynamics (CFD) simulations and performed Fluency-based ANSYS investigations by examining the effect of vents, roof geometry, airflow circulation, and greenhouse structure on temperature and humidity distribution. The findings confirmed that greenhouse geometry and ventilation mode strongly influence the thermal homogeneity and stability of the indoor environment.
Villagran et al.26) employed transient CFD with two-dimensional (2D) simulation to investigate inherent ventilation in all three styles of greenhouses (the conventional Colombian wood, curved multi-span greenhouse (DMG), and gothic multi-span greenhouse (GMG) in a tropical mountainous environment. The DMG and GMG greenhouses had ventilation rates 3.4 times higher than the traditional model, leading to more homogeneous thermal distributions and a temperature reduction of 2.8°C compared to the traditional greenhouse.
Lyu et al.27) studied the effects of side ventilation openings, wind speed, and crop height using Fluent software. The results showed that ventilation openings significantly improved ventilation and cooling inside the greenhouse. The temperatures were 3, 1.49, and 0.51 °C for a crop height of 1 m, and 3.50, 0.97, and 2.15 °C for a crop height of 1.8 m.
Wangkahart et al.28) used Fluent software to simulate the values of temperature distribution and airflow across four different types of roof designs, namely gable roof, curved roof, sawtooth roof, and a double roof. The results showed that the first design was the best as it provided continuous airflow and temperatures ranging from 30.4 to 34.1 °C. This confirms the importance of design in improving the agricultural conditions inside a greenhouse.
Ghibeche et al.29) used CFD simulation to simulate the temperature distribution and airflow patterns within a new closed greenhouse design. Mass and heat transfer were investigated using the k-ε turbulence model generated using ANSYS Fluent. Compared with traditional designs, the temperature distribution showed notable improvements in thermal uniformity, ranging from 16.5 to 23°C. The new design increased the overall energy efficiency while significantly lowering heat loss during the winter months. Although air velocities were lower indoors (approximately 0.1 m/s), they were much higher near glass surfaces (up to 0.5 m/s in some locations).
CFD greenhouse studies26-29) have previously indicated the need to validate experimental data to ensure the accuracy of numerical predictions. Numerical validation is usually conducted by comparing the results from the CFD models' simulated temperature, humidity, and airflow velocity with data obtained from sensor measurements and anemometers placed in various locations within the greenhouse. The reliability of CFD-designed greenhouse analyses has been enhanced using statistical indicators such as mean absolute error (MAE) and root mean square error (RMSE), and relative error (RD). This improvement aimed to evaluate the overall correlation between the simulation and experimental data obtained from separate sources within the greenhouse.
Another group of studies investigated solar-powered, renewable energy-integrated greenhouse systems. Researchers such as Salman et al.30), Maraveas et al.31), and Duong et al.19) have focused on integrating PV systems, solar covers, and solar-assisted drying technologies. This type of technology has been used to increase energy efficiency and decrease operating costs, indicating the potential of utilizing renewable energy technologies for more sustainable greenhouse operations.
Salman et al.30) investigated the possibility of installing PV panels on greenhouse roofs to boost food yields while also providing electrical energy. They studied the effect of different panel layouts on humidity and temperature inside the greenhouse, along with the effect of helping eggplant productivity during winter. The results showed that the solar panels reduced sunlight by 35-45% and lowered the temperature inside the greenhouse by 5-15°C. The zone with 12 solar panels produced the most electricity (6567 kWh/year) without significantly reducing the crop yield. Solar panels can save 50% of greenhouse gas emissions while reducing CO2 emissions.
Maraveas et al.31) investigated modern developments in intelligent and renewable greenhouse covers, concentrating on the application of partially transparent solar energy cells with a power conversion efficiency of 17% and Pb-halide perovskites with Internet of Things (IoT) technologies for greenhouse management. The study found that transparent overhead solar arrays might produce between 40-60% energy fund and increase crop production.
Duong et al.19) designed a mathematical model of a dryer-based sunlight glasshouse with ANSYS Fluent software to investigate the temperature and moisture distribution. As a result, it was proposed to continue the flow of air and quick drying in various types of environmental atmospheric factors that resulted in an average ambient temperature of 66.1°C, indicating that it is acceptable for cultivation.
Several researchers, including Asibeluo and Ekuyota 32), Zhu et al.33), Riahi et al.34), Huang et al.35), Thomopoulos et al.36), and Jawad et al.37) have researched automatic control and intelligent monitoring in greenhouses using IoT platforms, sensors, microcontrollers, intelligent control algorithms to regulate greenhouse temperature and humidity, and greenhouse systems powered by renewable energy. These researchers reported improved accuracy of environmental monitoring with less manual assistance than previously achieved.
Asibeluo and Ekuyota32) devised and implemented a smart greenhouse system. Air temperature, soil moisture content, and soil nutrient levels were continuously tracked using sensors and the Internet. The system achieved 87.5% efficiency for agricultural greenhouses using an ESP8266 microcontroller with Arduino to control the intelligent greenhouse system, and achieved 90% accuracy for the heating and cooling system and 85% accuracy for the irrigation system.
Zhu et al.33) investigated the thermal equilibrium in glass greenhouses using ANSYS Fluent. The average temperature near the moist drapes was 26.14°C, whereas the ambient temperature close to the fan exhaust was 28.28°C. Therefore, the new ventilation system provided a more constant temperature of 27.21°C with humidity percentages ranging from 57 to 86%. This improvement enhances the cooling performance and conserves energy.
Riahi et al.34) researched the application of a fuzzy logic control (FLC) system for managing the greenhouse microclimate. They concluded that there was an improvement in temperature and humidity control, as well as reduced energy consumption compared to traditional on/off-type controllers. This study contributes to the implementation of more sustainable greenhouse operations.
An intelligent control system was implemented and developed using an intelligent control system based on a single neuro-fuzzy PID control algorithm by Huang et al.35), who improved stability and control in greenhouse environments by maintaining lower temperature and humidity variations than those experienced with conventional systems. It provided an improved control accuracy of 50.2% and achieved energy savings of approximately 18%, thereby enhancing the energy efficiency and sustainable management of the greenhouse.
Thomopoulos et al.36) developed an autonomous FLC-based small-scale smart greenhouse using IoT sensor technology. This system has been employed for environmental management and precision agriculture. They demonstrated environmentally insensitive conditions within greenhouses and an increase in operational efficiency. Finally, Jawad et al.37) utilized the Artificial Bee Colony (ABC) optimization algorithm to control the energy consumption of a smart greenhouse and enhance plant comfort. They showed that AI-based optimization techniques will continue to be vital for sustainable greenhouse management. Finally, some studies have focused on greenhouse microclimate analysis and ventilation optimization using CFD simulation techniques, such as those by Lei et al.38) and Mao and Li39).
Lei et al.38) stressed that to grow production as efficiently as possible, environmental fluctuations in greenhouse variables driven by sunlight must be monitored. After conducting local investigations, we discovered that climate change was linked to changes in solar radiation. The coldest temperature in tall-plant greenhouses was twice that in short-plant greenhouses. When the topmost vent was opened, the variation in the surrounding temperature was twice as great. The relative humidity around the bottom of the tall-plant greenhouses was maintained at above 65%.
Solar chimneys and an earth-air heat exchange system were constructed in an experimental solar greenhouse to provide natural ventilation. The results illustrated that during the passive ventilation system, the indoor air temperature in the horizontal and vertical directions was maintained between 25-28°C and 25-30°C, respectively, with the vertical temperatures decreasing by 3.5-6.5°C. This method effectively prevented a continuous increase in temperature, increased air transport, and promoted healthy crop development.
Mao and Li39) tested and simulated eight-span plastic greenhouses using maize. They employed a numerical model that included insect screening resistance, plant resistance, and transpiration. According to their results, the distribution of both humidity and temperature was affected by outdoor wind speed, wind direction, and the height of the plants. Increasing external wind speed from 0.5 to 2.5 m/s decreased temperatures by 2.2 and 0.9 °C for a 1 m/s increment, improved vertical temperature and humidity uniformity, but deteriorated east-west dispersion. The moisture and temperature variances between the north and south were significantly affected by wind direction, with a northeast breeze resulting in a 0.6°C temperature difference and a 1.5% humidity difference. The height of the crop affected the homogeneity of temperature and humidity in the east and west.
The main differences between the design proposed in the present study and those of previous works in terms of structure, size, boundary conditions, and crop simplification methods are summarized in Table 1.
This work differs from many other CFD studies on greenhouses that that have examined insulated ventilation characteristics, large commercial greenhouse buildings, or varied roof geometries. Three ventilation/fan design variants were methodically examined in this study. The greenhouse size, operational conditions, and parametric parameters of these designs were identical. Additionally, to minimize the computing complexity while preserving a reasonable level of prediction accuracy for the airflow velocity and thermal behavior, the crop area was simplified using hard thermal objects. The primary innovation of this study is the combination of experimental verification and CFD analysis under Iraqi climate conditions. To increase temperature stability and lower energy usage in a combined automated greenhouse system, the best overhead fan/top vent layout must be established.
The general context for this research is the increasing demand for sustainable food production with energy-efficient methods employed in greenhouse agriculture, focusing on hot climates such as Iraq. In addition, this study discusses the global trend of interest in Protected Agriculture, the possibility of using renewable energy in this sector, an overview of CFD used for vent analysis, and smart control system development techniques that may be applied in greenhouse operations to help strengthen Food Security and mitigate the effects of climate change.
Prior research has led to substantial improvements and advancements in the design of greenhouse ventilation systems, incorporation of renewable energy, and development of automated control systems for environmental conditions. Nevertheless, conventional greenhouses continue to have difficulties in providing an appropriate environment (temperature, humidity, and airflow) that is conducive to plant development and tend to result in unstable microclimatic conditions for plants, as well as excessive energy consumption. Despite the abundance of research on ventilation systems, renewable energy, and automated environmental control systems, these components have generally been studied as separate entities. There has been limited research on the integration of CFD-based optimization and experimental validation of greenhouse environmental control systems, automated climate control systems, or systematic comparisons (under the same environmental conditions) of multiple fan/vent configurations in hot climates and countries (i.e., Iraq). Therefore, a clear research gap currently exists regarding the development and validation of an integrated
Table 1: A summary of the main differences between the proposed design and previous works
| Present study | Previous studies | |
|---|---|---|
| Structure | uses a compact greenhouse with an upper-fan/upper-vent arrangement | Mainly focused on large-span or different roof-type greenhouses |
| Volume | - small-scale greenhouse, has a size of (80 × 80 × 120 cm) - experimentally controlled | Larger commercial greenhouse models |
| Boundary conditions | All 3 configurations were evaluated under identical temperature, humidity, airflow velocity, & wall conditions to ensure fair comparison | Often, multiple parameters vary at once |
| Crop simplification | Plants were modeled as simplified solid wood-based bodies to reduce computational complexity | Many advanced studies used porous-media crop models with transpiration effects |
| Validation | Combines CFD simulation with experimental validation under Iraqi climatic conditions | - Relied mainly on simulations - Still limited |
| Innovation | - Integrated CFD-experimental comparison of three fan/vent configurations under identical conditions. - Finding the best design for climate stability & possible energy savings. | Control techniques, ventilation, and renewable energy have been independently researched. |
greenhouse environmental control system capable of providing climate stability, ventilation performance, and maximum energy efficiency through simultaneous optimization of fan/vent configurations.
The novelty/contribution of this study differs from previous studies in that it adopts a systematic comparison of three greenhouse ventilation/fan designs of equal size and identical operating conditions through both CFD modeling and experimental testing. The novelty of this study is that it combines ANSYS FLUENT analysis with actual in-field measurements under typical climate conditions in Baghdad to determine the most effective top-fan/vent arrangement for maximizing energy efficiency and improving the stability of the indoor climate.
The working hypotheses are as follows: 1) the placement of fans and vents greatly influences the stability of the temperature, humidity, and airflow velocity inside the greenhouse; 2) a top-fan/top-vent configuration provides the best stability of the indoor climate and potential energy savings; and 3) experimentally verified CFD simulations can accurately predict greenhouse performance.
This study aims to design and construct a prototype of an automatic greenhouse that can help enhance the stability of the indoor climate, decrease the amount of energy used, and allow for more sustainable farming practices. Different configurations for ventilation/fans were explored through CFD simulation in ANSYS Fluent, and all tests were performed with the same boundary conditions. Experimental validation was completed to confirm/validate the numerical performance results from the Baghdad weather data and to determine which method (configuration) of ventilating the greenhouse would provide the best control over the temperature, humidity, and airflow velocity. The automated greenhouse was also compared to a traditional method of control of the same environmental conditions for the purpose of evaluating its environmental and energy performance in general.
The greenhouse with conventional control was simulated using MATLAB, and the simulation results were compared.
To ensure a fair comparison, all greenhouses were built with the same dimensions (80 cm length, 80 cm width, and 120 cm height). The study identifies the design that provides optimal values of airflow distribution, temperature, and humidity management. This will increase energy efficiency and create ideal conditions for plant growth.
2. Methodology
2.1. Simulation implementation
2.1.1. Materials and methods
The CFD-based Ansys Fluent model of the greenhouse uses soil, glass, air, and wood as summarized in Table 2. Where plants are represented by a group of branches (wood) and leaves. Density, thermal conductivity, and specific heat capacity of wood are similar to those reported for plant stems and vegetative biomass 40,41) as shown in Table 3. Thus, wood can be used as a simplified surrogate material in greenhouse CFD simulations to evaluate airflow and heat transfer behavior. But such simplification does not take into account the transpiration, moisture exchange and other physiological processes of living plants.
Previous CFD studies using greenhouses have simplified crop canopies using porous-media39) or equivalent canopy representations27,38) to reduce the computational cost while preserving the dominant airflow and thermal behavior of the vegetation. While most advanced greenhouse CFD models represented crops using the porous-media approach due to its increased accuracy of representing transpiration and canopy-scale momentum transfer, it requires additional inputs of parameters such as leaf area density, drag coefficients, transpiration source terms, and additional user-defined functions.
As this study's main purpose was to evaluate different fan and ventilation configurations for stability and overall potential to create an acceptable indoor climate, the use of a more complex crop model was avoided; rather, the goal here was to minimize computational time and numerical complexities while maintaining an acceptable level of model prediction accuracy.
When using this crop simplification methodology, it is suitable to conduct investigations designed to compare general airflow distribution, performance of ventilation systems, and overall thermal performance of greenhouse
Table 2: Specifications of soil, glass, air, and wood in CFD
| Property | Glass | Air | Wood (plants) | Soil |
|---|---|---|---|---|
| Density (kg.m-3) | 2300 | 1.225 | 700 | 2719 |
| Specific heat capacity (Jkg-1K-1) | 840 | 1006.43 | 2310 | 871 |
| Thermal conductivity (Wm-1.K-1) | 0.8 | 0.0242 | 0.173 | 202.4 |
Table 3: Comparison of properties between wood & plant tissues
| Property | Plant tissue (stems/vegetative biomass) | Wood | Comparison |
|---|---|---|---|
| Density (kg/m³) | 400–1200 | 350–900 | Range overlap |
| Specific heat capacity (J/kg.K) | 1800–4200 | 1800–2400 | Partial overlap |
| Thermal conductivity (W/m.K) | 0.10–0.60 | 0.12–0.20 | Wood is within the range of plant tissue. |
configurations as opposed to investigating the various detailed physiological processes that plants utilize. While the complexities of transpiration, stomatal resistance, canopy resistance, and latent heat exchange were neglected in our study, many studies previously conducted using CFD modeling of greenhouses have indicated that simplified solid-body crop models can generally yield acceptable predictions for ventilation-related research. Despite this simplification, some deviations in the predictions of local temperature and humidity values may exist. For temperature, these deviations may be on the order of 1-3°C; for relative humidity, they may be on the order of 5-10% relative to advanced porous-media models including transpiration. The experimental validation errors from our study (2.60°C; 5.89%RH) continue to fall within the expected and acceptable error limits, as will be proven later.
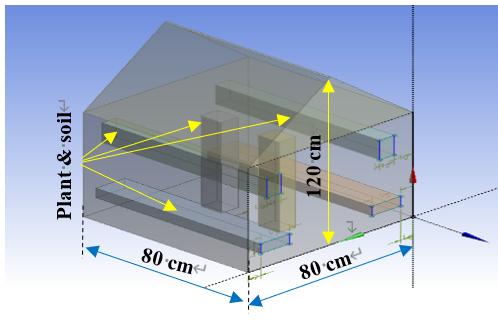
The three greenhouse model is designed with three different configurations. One is without vents and a fan, the other two have a fan and vents, each with a different location for the fan. The greenhouse dimensions were 80 cm long, 80 cm wide, and 120 cm high. It contains a fan measuring 25 cm × 25 cm.
2.1.2. Greenhouse model
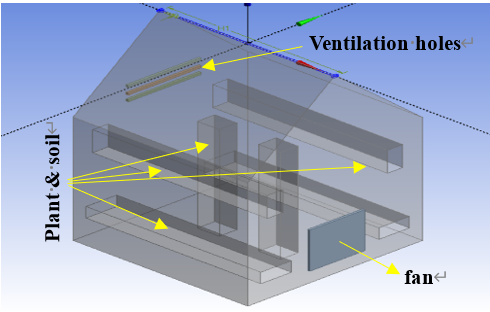
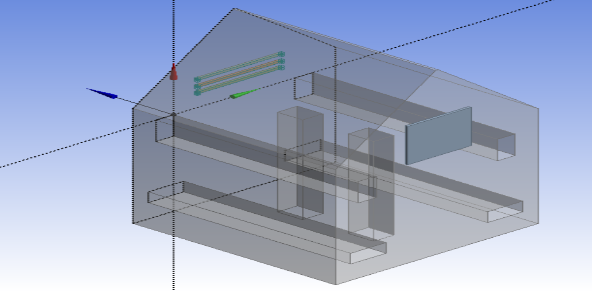
A greenhouse with the above dimensions was used to simulate a suitable environment for plant growth. The model utilizes a fan-driven ventilation system to push air in various ventilation setups. The greenhouse model shown in Figure 1 has a group of shapes: horizontal rectangles symbolize hanging plants, while vertical rectangles represent climbing plants. These rectangles (virtual objects) feature layers of soil and plants, which are intended to represent the impacts of natural vegetation on airflow dynamics, humidity, and temperature. In this paper, three designs for agricultural greenhouses were investigated:
1. First design: A greenhouse designed to passively raise its temperature without the use of a fan or ventilation vents, as shown in Figure 1. These virtual things are represented by rectangles made up of layers of dirt and plants. They are intended to capture how natural vegetation affects airflow velocity, humidity, and temperature dynamics.
2. Second design: This arrangement, as shown in Figure 2, has vents at the top (act as an air outlet) and a fan at the bottom (acts as an air inlet). Since warmer air tends to pool at higher altitudes, the overhead holes were placed for a specific purpose. Internal temperatures are lowered by turning on the fan, which opens the air vents to allow cool air to flow.
3. Third design: This configuration represents a greenhouse with a fan placed at the top, as shown in Figure 3.
Each of the three designs seeks to provide insight into how patterns of temperature, humidity, and airflow velocity can
best be regulated for effective climate control. Each design was evaluated based on its impact on indoor climate stability, which includes humidity, temperature, and ventilation.
2.1.3. Governing equations
The general form of governing equation for CFDs may be expressed as 39):
Where ρ is the density (kg.m−3), φ is the universal transmission quantity, Sφ is the source term, Γφ is the effective exchange coefficient (m2.s-1), and υ represents the fluid velocity (m.s-1).
2.1.4. Turbulent modeling
The standard k-ε turbulent equation effectively addresses the greenhouse effect33). Its equations are given as follows:
Where k is the turbulence kinetic energy, μt is the viscosity value of k, Gk is the product of the k term, C1ε and C2ε are constants with values of 1.44 and 1.92, respectively, ui is the velocity factor, and ε is the turbulent energy dissipation rate33).
2.1.5. Modeling variables within the ANSYS Fluent program
Due to the development of the laws of thermodynamics and fluid dynamics, the simulation of the greenhouse structure was replicated in this study using ANSYS Fluent software. The computer program provides numerous options for simulating the spatial distribution of moisture, temperature, and ventilation within the greenhouse. Fluent additionally takes into consideration boundary parameters such as the position of ventilation holes and fans, allowing for an evaluation of their effect on temperatures inside greenhouses. In addition, the application allows the development of 3D models using a Hex-dominant mesh layout to record tiny airflow properties. This method allows the tracking of modifications to temperatures and moisture distributions as time passes, making it essential to evaluate the stability of the inside climate across various layouts.
The k-epsilon approach33) was selected for airflow simulation due to its higher accuracy in simulating airflow in enclosed environments.
2.1.5.1. Advanced techniques for numerical modeling
It is possible to increase the level of accuracy for numerical computations by an integration of transient CFD simulations with more advanced turbulence models, for example, RNG k - ε and SST k - ω along with more sophisticated solar radiation and crop transpiration models.
Plants can, likewise, be modeled as porous media instead of simplified solid bodies, resulting in a more realistic distribution of airflow velocity and humidity throughout the greenhouse. The advanced numerical methods proposed for enhancing the accuracy of greenhouse CFD prediction are physically governed primarily by the equations representing continuity, momentum, energy, turbulence, radiation, and species transport processes.
1. Continuity equation: mass conservation is applied in CFD simulations to keep mass conserved through the equations below: where ρ = air density measured and V = velocity vector of moving air.
2. Navier-Stokes equations of momentum: describe how airflow and ventilation occur according to the equations below. The variables in this case are p = pressure, µ = dynamic viscosity, and g = gravitational acceleration.
3. The energy equation (heat transfer): to assess thermal transients and the impacts of solar energy by using the following equation, where T = temperature, cp = specific heat, k = thermal conductivity, and ST = heat source term.
4. RNG k–ε turbulence model: improves prediction of turbulent air, modeled based on the above equations. The equations of transport for turbulent kinetic energy and turbulent dissipation rate, respectively, are:
5. SST k–ω turbulence model: This equation provides the accuracy of airflow near the wall. The specific dissipation equation is:
6. Solar radiation model: An equation determining dynamic solar boundary conditions (or in the above category) is:
7. Porous media crops model: An equation assessing the moisture and transpiration resistance for crops in the above category can be illustrated as follows:
8. Water vapor/humidity transport equation: This is the equation for predicting the amount of water vapor that transpires and the amount of humidity from plants.
2.1.5.2. The meshing process
A Hex-dominant mesh's technological advances has been implemented with a great level of precision regarding airflow, humidity, and temperatures within the greenhouse. This approach produces an ordered mesh of hexagon elements in regions where ventilation and distribution of temperature characteristics must be precisely controlled, such as around ventilation and fan openings, as seen in Figure 4. Table 4 shows how the structure was built for each of the 3D designs, each with a unique set of nodes and elements.
The number of nodes and elements for each of the three designs enables direct comparison of simulations under identical numerical conditions while maintaining mesh accuracy in crucial regions where significant changes in airflow and temperature occur. This arrangement meets the requirements for 3D computing within the greenhouse,
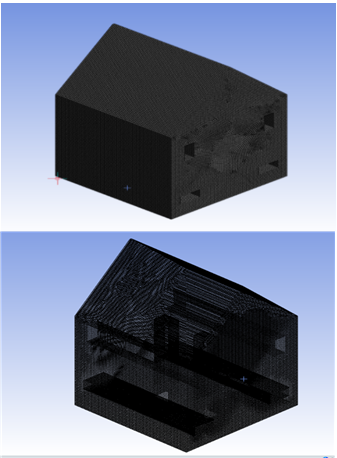
Table 4: Nodes and elements are distributed and partitioned using the mesh tool
| Model design | Elements | Nodes |
|---|---|---|
| 1st | 634741 | 608294 |
| 2nd | 636183 | 610423 |
| 3rd | 629494 | 612709 |
Table 5: Analysis of mesh independence for the CFD greenhouse model
| Mesh type | Coarse | Medium | Fine |
|---|---|---|---|
| No. of nodes | 145,320 | 412,780 | 612,709 |
| No. of elements | 128,540 | 389,520 | 629,494 |
| Average temp (°C) | 27.84 | 27.31 | 27.19 |
| Average humidity (%) | 73.62 | 71.44 | 70.95 |
| Average airflow velocity (m/s) | 0.381 | 0.392 | 0.396 |
| Deviation from fine mesh (%) | 6.8 | 2.1 | 0.0 |
capturing changes in the basic climate conditions and comparing the performance of the three designs.
Mesh-independence analysis was carried out for the third greenhouse design using three different mesh densities, i.e., coarse, medium, and fine, in order to assess the numerical reliability of the CFD model (Table 5).
Results showed that predicted temperature, humidity and airflow velocity between the three different mesh densities were within 5% of each other. Coarse mesh had the largest deviation, and the difference between medium and fine was only 2.1%, which suggests that further refinements of the mesh had little effect on the predicted values for the greenhouse parameters. For all subsequent simulations, a fine mesh (629494 elements and 612709 nodes) was chosen because it provided mesh-independent results and produced high numerical accuracy at both fan and ventilation openings.
2.1.5.3. Boundary conditions
Table 6 summarizes the boundary conditions for the three greenhouse designs. The CFD simulation was performed using the steady-state method, where the number of iteration steps reached 500 iterations, as shown in Figure 5. It is observed from this Figure that the curves are stable, and this indicates the validity of the solution. These conditions were studied to see how ventilation apertures and fans affected airflow velocity, heat distribution, and humidity levels.
The boundary conditions for the fan (as an air intake), the walls, and the ventilation apertures (as an air exit) were set for each design as follows:
1. Fan: The second and third designs use a fan as an air intake, pushing air through the greenhouse to distribute heat and moisture.
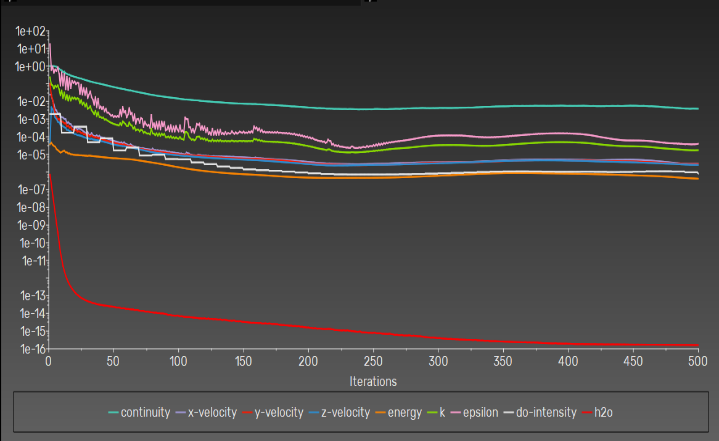
Table 6: Boundary conditions of CFD simulation
| Boundary condition | Design 1 | Design 2 | Design 3 |
|---|---|---|---|
| Temp. of the walls | 31°C | 31°C | 31°C |
| Wall boundary type | Constant temp wall | Constant temp wall | Constant temp wall |
| Inlet air velocity | 0 m/s | 0.55m/s | 0.55m/s |
| Inlet air temp | 25.85°C | 24.85oC | 25.85°C |
| Relative humidity of entering air | 70% | 70% | 70% |
| Air pressure at ventilation holes | 0 Pa (no vent openings) | 0 Pa | 0 Pa |
| Turbulent kinetic energy | 0 m²/s² | 0.85 m²/s² | 0.85 m²/s² |
| Solar radiation treatment | External convection by wall temp | External convection by wall temp | External convection by wall temp |
| Initial air temp inside greenhouse | 25.85°C | 25.85°C | 25.85°C |
| Initial relative humidity inside greenhouse | 70% | 70% | 70% |
2. Turbulent dispersion rate: The external walls of the greenhouse were used as a fixed boundary condition for temperature in the three designs because they represent a surface reflecting external heat and the effect of thermal insulation in the greenhouse.
3. Ventilation openings: In the second and third designs, ventilation apertures serve as air outlets, extracting hot and humid air from the greenhouse to achieve thermal equilibrium.
2.2. Hardware implementation
2.2.1. System components
Creating a greenhouse experimental setup requires some basic components, such as a humidity-generating device, sensors (temperature, humidity, and airflow velocity), actuators (fan, heater, and automatic vents), a relay system to control the actuators, a microcontroller (Arduino), and a power supply. The controller is set at a specific point to manage the environment inside the greenhouse. Sensors and actuators are integrated with the Arduino for data acquisition.
a. Humidity maker device
The device generates humidity in the greenhouse air by directly spraying water in a very fine mist. The device operates based on an indicator from air humidity sensors. If the relative humidity drops below 50%, the device raises the humidity level until it reaches 50%, at which point, it shuts down. This device provides an ideal environment for
plants.
b. Arduino Mega
To operate a variety of devices, the Arduino Mega 2560 was used. It features digital input/output pins, analog input pins for converting signals from analog to digital, and PWM on a few digital pins. It has 256 kilobytes of flash drive space for program preservation, with 8 kilobytes needed by the loader and 8 kilobytes available through the flash memory's EEPROM library.
c. SD card module
The Micro SD Card, Adapter module's capability to access and write data to Mini SD, memory cards through the file system, in addition to a driver for the SPI interface, enables an SD card management system.
d. Soil moisture sensor
This device is capable of measuring the soil's water level. The amount of water in the soil can be measured by measuring the area of the soil. The module features both analog and digital results, along with a slider for changing the threshold level.
f. DHT22 digital humidity and temperature sensor
In greenhouses, this sensor can promote uniformity of the basic water content and automate irrigation according to plant water consumption. They can also refine irrigation system design by quantifying spatial variability. By irrigating based on the actual use of crop water, soil moisture sensors can significantly reduce time variation in the moisture content of the substrate.
The DHT22 sensor, also known as the digital humidity and temperature sensor module AM2302, is used. It is an inexpensive sensor that measures both temperature and relative moisture. The data pin transforms temperature and moisture data from capacitance and thermostatic sensing into a digital signal that can be transmitted, eliminating the need for analog input connections.
g. Relay 4 channel
4 Channel 5V Relay Shield Module 250VAC, 30VDC, 10A was utilized to regulate high voltages and high current loads. It consists of four channels, each containing a relay SRD-05VDC-SL-C. It can turn on and off electrical devices such as fans, water pumps, heating lamps, and other devices.
h. Water level sensor and water pump
A sensor for measuring the level of water may be put in a tank as a component of the irrigation system. It operates through a pump that waters the plants’ soil according to a signal from a sensor that monitors moisture in the soil. If the moisture level in the soil falls under 50%, the irrigation system begins to water the soil, and it stops when the amount of moisture reaches 50%. This approach prevents manual intervention, improves water consumption efficiency, and improves crop production by providing precise and appropriate watering.
i. ESP32-Wroom module
The ESP32-Wroom module is one of the most popular communication and microcontroller modules. This unit features the latest computing and wireless connectivity technologies, combining Wi-Fi and Bluetooth.
2.2.2. The system management method
The selection of the control thresholds was based on the results of the optimization of the CFD, which showed that design 3 had the most stable greenhouse environment (temperature: 26.07 to 27.19° C, RH: 60.85 to 81.25%, and airflow velocity: 0.396 m.s-1). The selected thresholds for temperature and humidity will act as the setpoints for the proposed on-off control strategy. Using the setpoints will reduce energy consumption compared to traditional greenhouse systems.
The controller, through the use of sensor inputs from the heaters, fans, humidifiers, and irrigation pumps, will automatically adjust to ensure that the greenhouse environment stays within the target parameters (Figure 6).
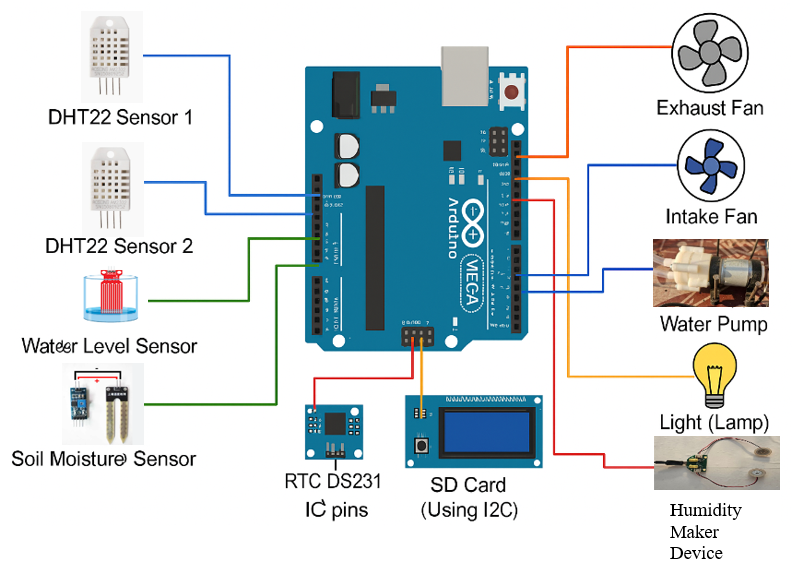
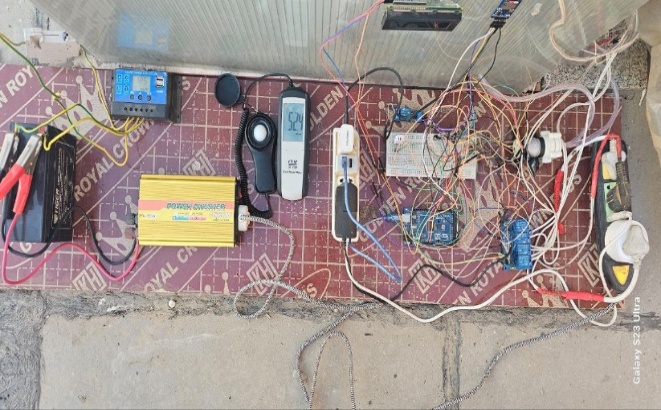
The following steps illustrate the connection of the integrated control system with the greenhouse, as shown in the schematic of Figure 7. Figure 8 shows the complete experimental control system.
1.DHT22 sensor 1: Attach its data pin to the pin on the Arduino board.
2.DHT22 sensor 2: Connect its data pin to the pin on the Arduino board.
3.Water level sensor: Attach its output to the analog input pin on the Arduino board.
4.Soil moisture sensor: Attach its output to the analog input pin on the Arduino board.
5.Intake fan: Connect this fan to the pin on the Arduino board.
6.Water pump: Connect it to the pin on the Arduino.
7.Humidifier: Connect the humidifier to the pin on the Arduino board.
8.Light (lamp): Connect it to the pin on the Arduino.
9.SD card module: Connect the pin on the Arduino to the Chip Select (CS) pin of the SD card module.
10.RTC DS3231: Connect the I2C pins for the RTC DS3231 real-time clock module to the Arduino.
11.LCD screen (using I2C): The I2C pins for LCD screen
12.Connect loads to the Arduino board via relays.
13.Write and then upload the Arduino code.
2.2.3. Procedure of implementing experimental tests
The greenhouse shown in Figure 9 has dimensions of 80 cm in length, 80 cm in width, and 120 cm in height. In winter, a 100 W heat lamp was used to raise the temperature inside the greenhouse.
Below is a detailed description of the experimental setup:
a. Electrical energy measurement:
DDS238-1 1-phase digital energy meter (220–240 VAC, ±1% accuracy) was installed between the mains power supply and the greenhouse electrical loads (fan, heat lamp, humidifier, and water pump). The meter continuously logged, current, power, and cumulative energy consumption (in kWh) as shown in Table 7. For each greenhouse design, energy readings (initial and final) were taken during a 24 h test period, and the daily energy consumption was calculated as the difference between the two readings.
b. Sensor locations:
To validate the CFD models in 3D, the sensors were placed at different heights and in different locations within the prototype greenhouse frame to successfully measure internal microclimate inputs and outputs.
• Air temperature and humidity sensors DHT22: For monitoring the spatial distributions of air temperature and relative humidity, two AM2302 DHT22 sensors were deployed. One sensor was located in the lower region, ~20
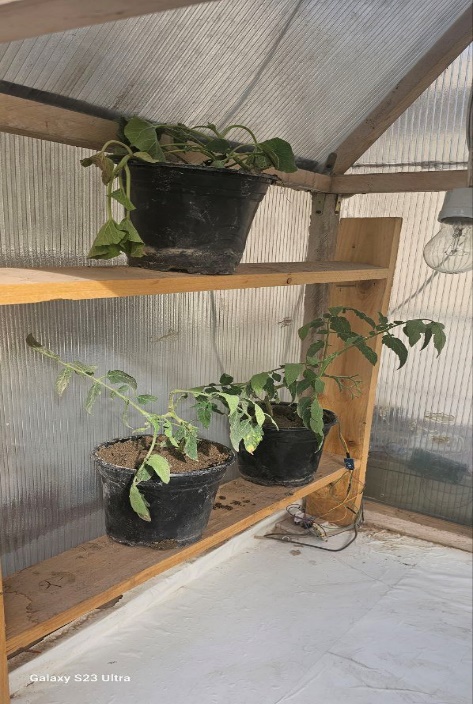
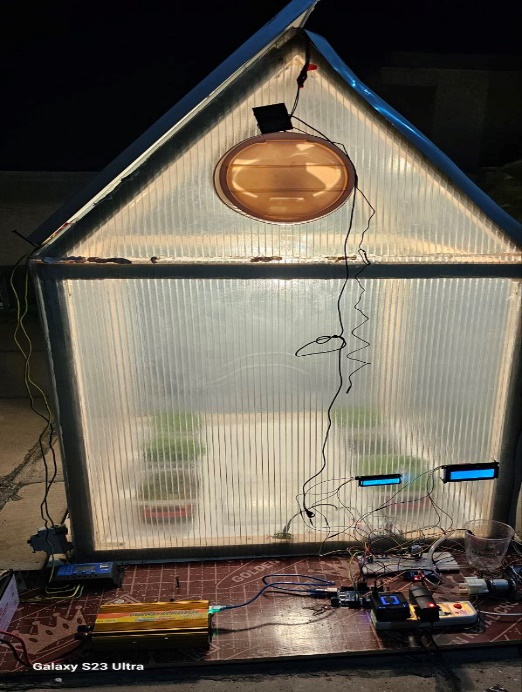
Table 7: Power & cumulative energy of greenhouse loads
| Time | Current (A) | Power (W) | Cumulative energy (kWh) |
|---|---|---|---|
| 08:00 | 0.92 | 202.4 | 0.00 |
| 10:00 | 0.88 | 193.6 | 0.40 |
| 12:00 | 0.95 | 209.0 | 0.81 |
| 14:00 | 0.90 | 198.0 | 1.21 |
| 16:00 | 0.85 | 187.0 | 1.59 |
| 18:00 | 0.80 | 176.0 | 1.94 |
| 20:00 | 0.72 | 158.4 | 2.26 |
| 24:00 | 0.65 | 143.0 | 2.55 |
cm above the floor bed in the center of the structure, to measure conditions that directly affect the root and lower canopy zones within the greenhouse floor. Other sensor was suspended within the upper canopy at ~ 75 cm above the floor bed, close to one of the ventilation openings, to measure the accumulating volume of hot, humid air stored within the boundaries of warm humid air before it is exhausted.
• Soil moisture sensors LM393: A soil moisture sensor (probe) was placed at the rooting depth of 8 cm within the middle vegetation material layer to trigger the irrigation system to automatically operate based on direct substrate water loss.
• Airflow velocity sensor CDF-15A digital anemometer: The anemometer (probe) was placed at the central area of the workspace in the greenhouse (50 cm high), directly in the path of airflow generated from the inlet and exit vents, to prove true cross-ventilating patterns versus simulations.
c. Species of plants used:
The physical model has been created using Solanum melongena (eggplant) plants throughout their growing season; eggplants were a good selection to demonstrate winter greenhouse growing principles regionally. The two designated areas for plant propagation are:
• Climbing/Vertical: With vertical support struts arranged in the center of the greenhouse design to simulate real-world vertical climbing/vertical growing by providing adequate height (~45cm) for realistic benchmarks of climber resistance to wind.
• Hanging/Horizontal: These plants were located on the outermost layer of the supporting structures. The soil for each of the growing media was composed of an upper layer of clay soil (~10cm) to resemble the true characteristics of natural water and thermal insulation for the boundary configuration described in the building envelope layouts.
d. Atmospheric conditions of December 1, 2025:
Weather conditions during the testing period were typical of wintertime weather in Iraq (i.e., cool and clear) and served as the baseline boundary profiles for both configuration types being tested as follows for the testing period from 7 a.m. to 5 p.m., December 1, 2025:
• The air temperature (Tout) ranged from a minimum of 15°C in the early morning to a maximum of 22.5°C at the maximum sun hours of the afternoon.
• The relative humidity (Hout) was inversely proportional to air temperature, with maximum relative humidity occurring at night and early morning at ~ 80% and a minimum daytime relative humidity occurring in the afternoon at ~ 40% during maximum sun hour periods.
• The solar radiation followed a sinusoidal pattern throughout the clear day, with clear sky conditions for the extensive measurements performed, and has recorded a maximum outdoor heat flux reflection corresponding to a wall boundary temperature of ~ 31ºC during the time of solar noon for each of the exposed wall surfaces.
e. Sampling parameters (frequency and duration):
The Arduino Mega 2560 data-acquisition system was configured with an RTC DS3231 real-time clock module to ensure high data fidelity for experimental validation. The system had the following sampling parameters:
• Sampling frequency: The microcontroller core polled the environmental sensors (DHT22, LM393, and anemometer) continuously once every 2s (0.5Hz) to measure rapid changes in microclimate due to actuator adjustments.
• Logging/Storage interval: The microcontroller averaged the polled data points locally and permanently stored them in the micro SD card module at a fixed 5 m logging interval to conserve data and allow for the retention of transient trends in microclimate.
• Duration of testing: The test was performed as a continuous, uninterrupted flow of 24 h beginning at 00:00 on December, 1st 2025, through to 00:00 on December 2nd, 2025, and therefore provides an assessment of how the automated system performs during daylight hours (solar gains) and again during nighttime (cooling).
A typical air-cooling system was used in the greenhouse system. A fan was placed at the top of the greenhouse to introduce cold air. On the opposite side, vent openings were placed near the roof to discharge hot air, thus lowering the temperatures to be suitable for plant growth inside the greenhouse. The 200 W, 24V solar PV panel is used to generate electrical energy by converting sunlight into electricity. The PV panel is positioned at an angle of 35 o, ideal for the latitudes of Baghdad in the summer.
PV panels generate direct current and unstable voltage, so a 24V inverter is used. The AC output of the inverter is converted to DC since all the greenhouse appliances are running on 220V AC. Table 8 reviews the accuracy and resolution of instruments used in the greenhouse system setup.
Table 8: The accuracy and resolution of system instruments
| Instrument | Range | Accuracy | Resolution |
|---|---|---|---|
| DHT22 digital temp & humidity sensor | 3.3-6 VDC -40 to 80 °C 0-100% RH | ±0.5°C ±2%RH @ 25oC | Temp: 0.1oC Humidity: 0.1%RH |
| DGZZI water level sensor | DC 3-5V < 20 mA -10 to 30 oC 10-90 %RH | ~ ±5 % | based on ADC resolution |
| LM393 soil moisture sensor | 3.3V-5V | ±10 % | based on ADC resolution |
| CDF-15A digital anemometer | 0-45 m/s | ± 3% | 0.1m/s |
| DDS238-1, 1-phase digital energy meter | 220–240 VAC, 50 Hz 5–80 A 0–99999 kWh | Class 1 (±1%) | 0.1 kWh |
2.2.3.1. Measuring electrical energy consumption and determining the of energy savings
The electrical energy consumption can be experimentally found by the following procedure:
1.Connect the digital energy meter between the mains supply and the greenhouse electrical appliances (fan, heater, humidifier and pump).
2.Write down the first energy meter reading (Eint).
3.Run each greenhouse design for 24 h under the same environmental conditions.
4.Record the final reading of the energy meter (Efin).
5.Calculate the daily energy consumption as Edaily = Efin - Eint.
6.Compare the daily consumptions of the three designs.
7.Compute the percent energy savings Esav compared to Design 1.
Where Eref is the energy consumption of the 1st design. Etest is the energy consumption of the enhanced design (2nd or 3rd).
2.3. Simulation of a greenhouse under conventional control
Firstly, the greenhouse system was simulated and controlled by Matlab under a conventional on–off control strategy to regulate both temperature and humidity, as shown in Figure 10. The actuation of actuators due to predetermined thresholds is the concept behind this type of control. Depending on the environmental conditions measured by actuators, actuators will be either fully on or fully off. The system was developed according to the specified mathematical model, and two self-tuning PID controllers were used to regulate temperature within 15 to 30°C and relative humidity with 40 to 50% accuracy.
The reference control model developed in MATLAB was a simple approximation of an actual control scenario, while the experimental greenhouse was used to determine optimum climatic boundaries using the results of the CFD analysis.
2.3.1. Mathematical model of a greenhouse system
The MATLAB greenhouse model is implemented to simulate its environment over time. The simulation includes internal and external temperature/humidity dynamics and humidifier and heater control when the internal humidity drops below 60%, and the temperature drops below 30°C. Here's the structured approach:
a. Outdoor temperature model
The desired setpoint for the internal air temperature was set at 30°C. When the measured temperature inside the greenhouse exceeded this threshold, the ventilation system
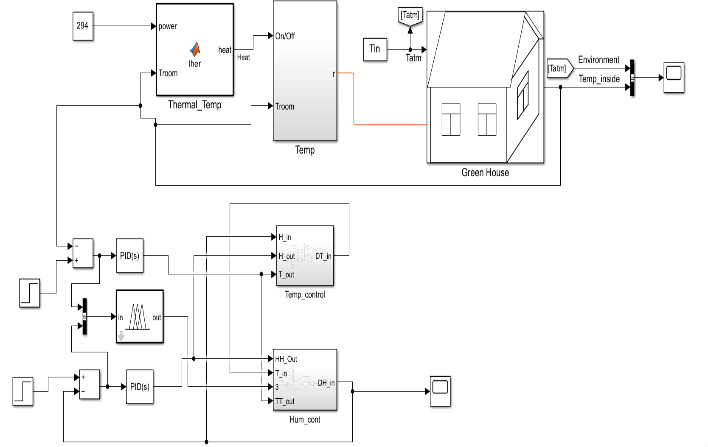
was switched on to reduce the temperature through air exchange. Once the temperature dropped below the lower limit (hysteresis value, e.g., 28 °C), the ventilation system was switched off. This simple on–off mechanism ensures that the temperature fluctuates around the setpoint, but may result in oscillations due to the absence of proportional or predictive control. Equation 14 describes the heat behavior outside the greenhouse, Tout42):
Where, . Peaks at noon (30°C), minimum at midnight (15 °C).
b. Outdoor humidity model
The relative humidity setpoint was maintained at 50%. When the humidity drops below this value, the humidification system (ultrasonic humidifier) is activated to increase moisture levels inside the greenhouse. Once the humidity reached or slightly exceeded the threshold (e.g., 52%), the system was switched off. Similar to temperature control, this strategy provides basic regulation but can cause overshoot and undershoot due to the binary nature of actuation. Equation 15 describes the humidity behavior outside the greenhouse, Hout40):
Where Havg = 60%, B = 20%. Peaks at midnight (80\%), minimum at noon (40\%).
c. Indoor temperature model
Equations 16 and 17 describe the heat behavior inside the greenhouse, Tin42,43)
Where the heat transfer coefficient, α = 0.1 hour -1.
The solar gain S is given as:
Table 9: Summary of parameters
| Parameter | Description | Value |
|---|---|---|
| Tavg | Avg outdoor temp | 22.5°C |
| A | Temp amplitude | 7.5°C |
| Havg | Avg outdoor humidity | 60% |
| B | Humidity amplitude | 20% |
| J | Solar gain coefficient | 2°C/hour |
| K | Humidification rate | 3%/hour |
Where J = 2 oC/hour. It is active between 6:00 and 18:00, peaking at noon.
d. Indoor humidity model
Equation 18 describes the humidity behavior inside the greenhouse, Hin44):
Where the humidity exchange coefficient, β = 0.05 h-1. K = 3% h-1 and,
All the parameters mentioned in Equations 14-18 are defined in Table 9:
3. Results and discussion
3.1. Ansys Fluent simulation results
Each of the three designs was assessed for its impact on the distribution of temperature, airflow velocity, and humidity inside the greenhouse, to enhance indoor climate stability for plants.
3.1.1. First design (without ventilation holes and fan)
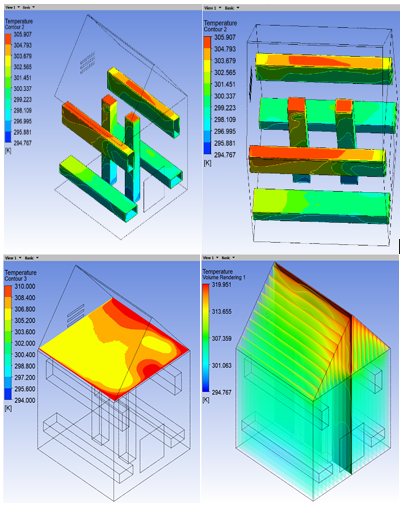
In the first design, the simulation showed an accumulation of temperatures in the upper part of the greenhouse with limited air distribution. The temperatures are in the range
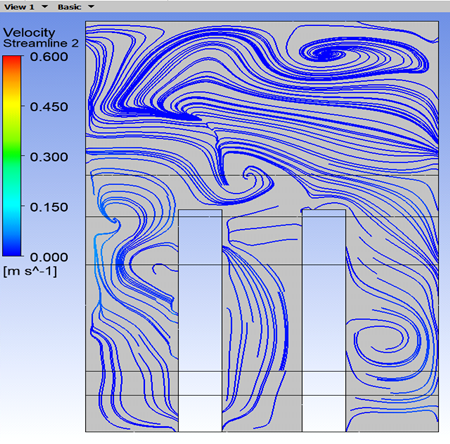
(27.19–32.76 oC), with relatively constant humidity levels. This design demonstrated a lack of effective airflow, which contributed to maintaining higher temperatures at the top and varying heat distribution throughout the greenhouse. Figure 11 shows the typical temperature distribution and flow distribution inside a greenhouse. Red represents the highest value, while dark blue represents the lowest. Green, yellow, and orange are in the middle, showing the range between the highest and the lowest values. The 1st design had inadequate airflow circulation and ventilation. This will lead to heat accumulation in the upper region of the greenhouse and wider temperature variations (27.19–32.76°C).
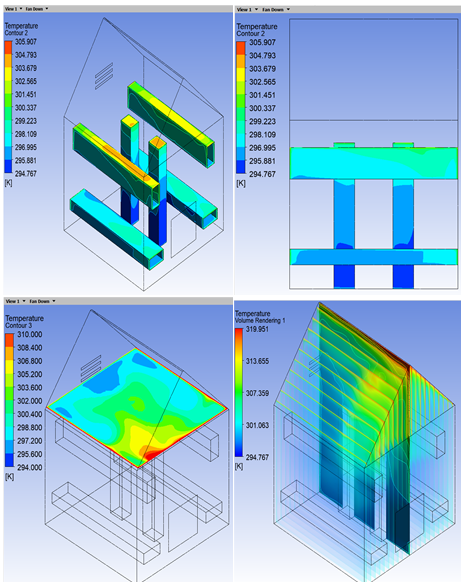
3.1.2. Second design (ventilation holes at the top and fan at the bottom)
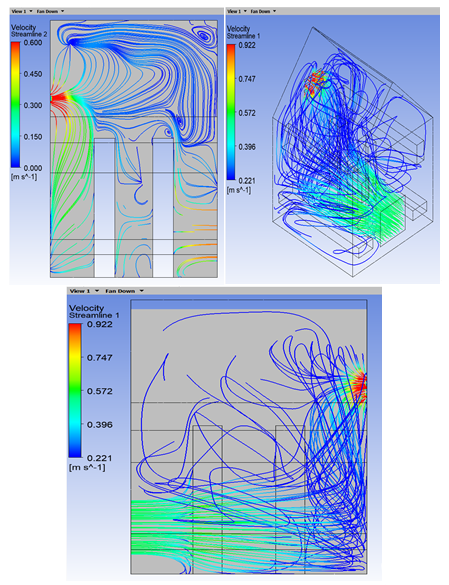
This design significantly improved the airflow. The temperatures dropped in the lower levels, where the hot air was discharged through the upper vents, and the temperatures ranged from 24.96 to 31.64°C. Figure 12 shows the typical temperature distribution, humidity, and flow distribution inside a greenhouse. Red represents the highest value, while dark blue represents the lowest. Green, yellow, and orange are in the middle, showing the range between the highest and the lowest values.
The 2nd design has superior ventilation performance than the 1st design due to the cool air provided by the bottom fan and the hot air being expelled by the top vents. Even so, the distribution of airflow is not as uniform as it was with the 3rd design.
3.1.3. Third design (ventilation holes and fan at the top)
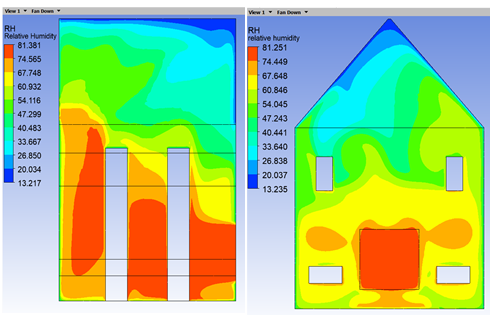
The results showed that this design improved the distribution of both temperature and humidity. The airflow is more efficient as the fan helps circulate the air completely inside the greenhouse. This in turn will contribute to the stability and homogeneity of the indoor climate. The fan enables more efficient evacuation of hot air. The upper sections are effective in creating a homogeneous indoor climate and a steady thermal environment. Figure 13 shows the typical distribution of temperature, humidity, and flow distribution inside the greenhouse. Red represents the highest value, while dark blue is the lowest value, while the green, yellow and orange colors in the middle show the range between the highest value and the lowest value.
The third design (top fan and top ventilation openings) was the most stable indoor climate, as it improved heat removal and reduced temperature stratification.
The least daily energy consumption (3.50 kWh/day) and the highest energy savings (27.1%) were obtained while the temperature was maintained at 26.07–27.19 °C, the relative humidity at 60.9–81.3% and the highest airflow velocity (0.396 m/s) as shown in Table 10. The first design, in contrast, showed the highest variation in temperature and energy consumption, and the second design showed medium improvements. These results confirm the research hypothesis that the position of the fan and ventilation holes on the top is more conducive to thermal management, climate stability and energy efficiency. These results are consistent with the previous related studies of Villagran et al.26), Wangkahart et al.28), and Zhu et al.33), which reported that improved ventilation and optimized roof configurations improved airflow, reduced temperature gradients, and resulted in more uniform distributions of temperature and humidity in greenhouses. The temperature obtained in the present work was in a narrower and more
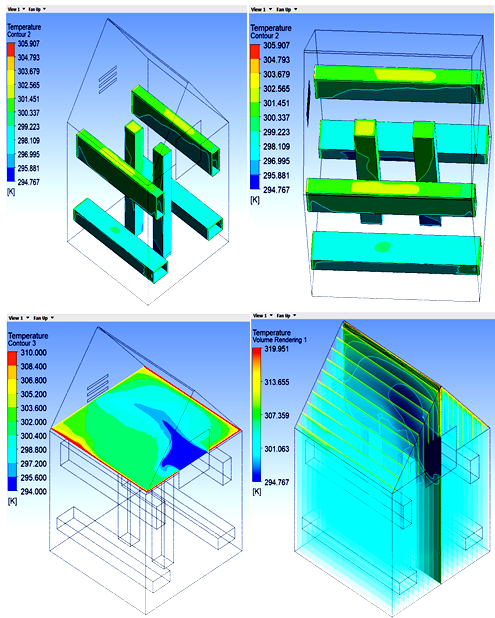
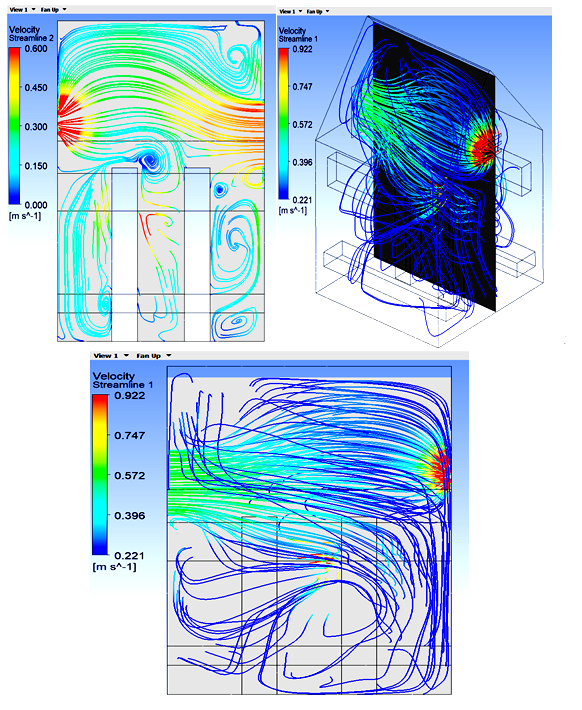
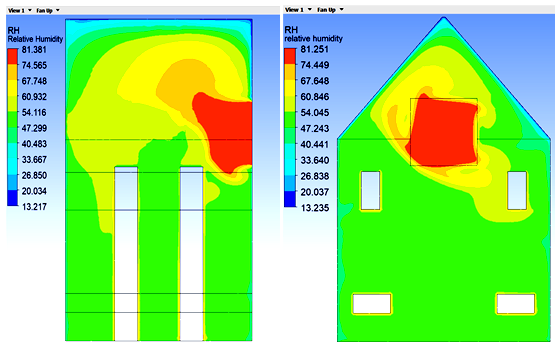
Table 10: Climate conditions, energy consumption, & energy savings in the three designs of experimental greenhouse setup
| Design | 1st | 2nd | 3rd |
|---|---|---|---|
| Temp. (oC) | 27.19-32.76 | 24.96-31.64 | 26.07-27.19 |
| Humidity (%) | 70–88 | 58-84 | 60.9-81.3 |
| Airflow velocity (m/s) | 0.05-0.12 | 0.22-0.31 | 0.396 |
| Initial energy Eint (kWh) | 125.30 | 130.10 | 134.55 |
| Final energy Efin (kWh) | 130.10 | 134.55 | 138.05 |
| Energy consumption Edaily (kWh/day) | 4.80 | 4.45 | 3.50 |
| Energy saving Esav (%) | — | 7.3 | 27.1 |
stable range (26.07–27.19°C) than that of Wangkahart et al.28), which provides more favorable conditions for plant growth.
Further improvement of energy efficiency can be achieved by the application of advanced control strategies such as fuzzy logic, adaptive PID or variable speed fan control.
3.2. Results of practical implementation and traditional MATLAB simulation
3.2.1. Experimental results
Experimental tests on the greenhouse system were
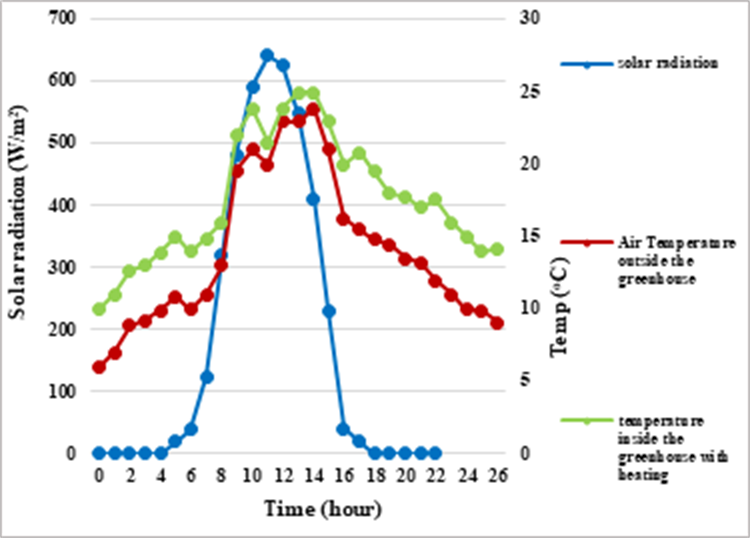
implemented in the city of Baghdad/Al-Dora on December 1, 2025, where the temperature at 7:00 was 11°C, and the humidity was 46%, to obtain heat and humidity values inside and outside the greenhouse. Readings were taken for a full day and recorded every half an hour. The results of the practical system will be compared to the results of the simulation in the next section. As a result of the decrease in the intensity of solar radiation, the plant temperature and air temperature began to decrease, ranging from a minimum of 8°C at 13:00 and reaching a maximum value of 23°C around 12:30. To maintain the right temperature for the plant, the temperature inside the greenhouse must be raised to be suitable for plant growth. The outside air temperature is often lower than the temperatures inside the greenhouse with heating. Therefore, the heating system inside the greenhouse was used to raise the temperature to the ideal level for plant growth. The air temperature was lower than in the greenhouse with heating by about 4°C, as shown in Figure 14.
Figure 15 illustrates the general humidity distribution in Iraq's climate. It was observed that there are significant differences in humidity levels inside and outside the greenhouse. The curve shows that humidity inside the greenhouse is sometimes 0-15% higher than the humidity outside. This is due to the greenhouse's reliance on a
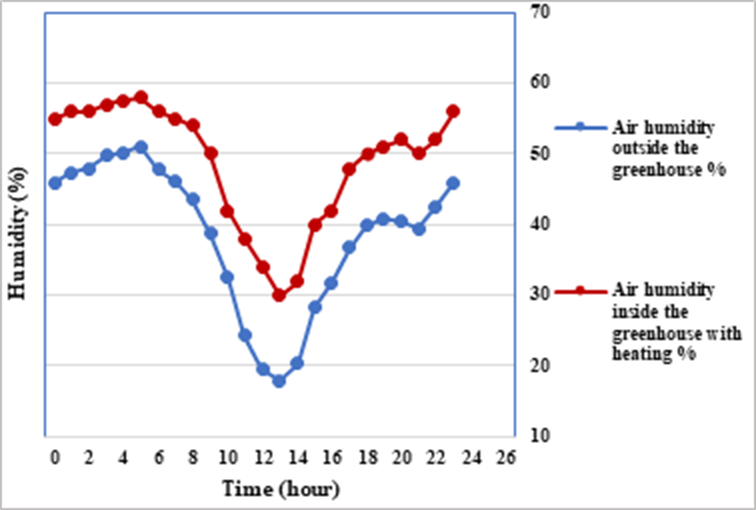
heating and humidifying system to provide optimal humidity for plant growth.
Actual fieldwork measurements were implemented on December 1, 2025, in Baghdad. The findings indicated that the automated greenhouse system exhibits a greater ability to maintain stable living quarters than the outdoor environment could provide. The range of temperatures in the outdoor environment (15-22.5°C) exceeds that of the optimized configuration of the greenhouse system (indoor temperatures corresponding to ideally the best temperature for plant development of (26.07-27.19oC). The range of relative humidity inside the greenhouse system (60.85-81.25%) was also stable against the outdoors' range of ~ 40-80% (i.e., the relative humidity recorded indoors remained unchanged throughout the day regardless of what was happening outdoors). All experimental observations indicate that the new vent/fan arrangement can improve the thermostat and accomplish its goal of controlling the greenhouse environmental comfort.
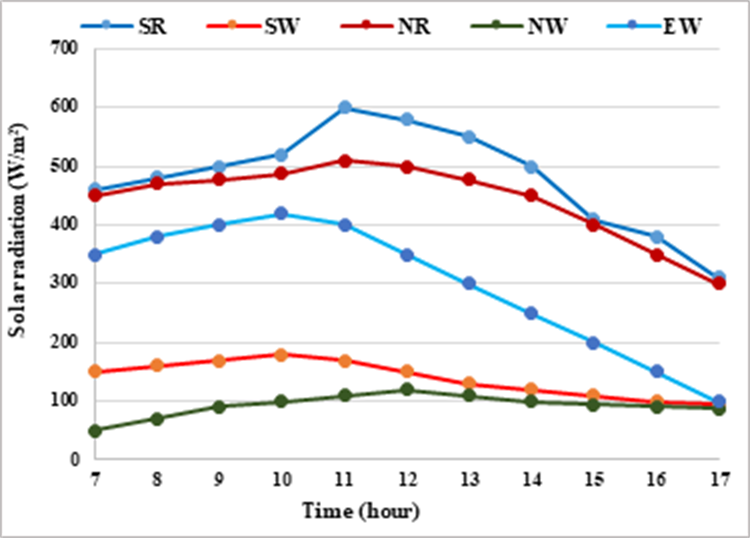
Figure 16 shows the intensity of radiation falling on all walls of the greenhouse. Where SR is southern roof, SW is south-west, NR is northern roof, NW is north-west, and EW is east-west. The Figure shows that the SR is the wall most exposed to solar radiation.
3.2.2. Comparative performance analysis inside the greenhouse
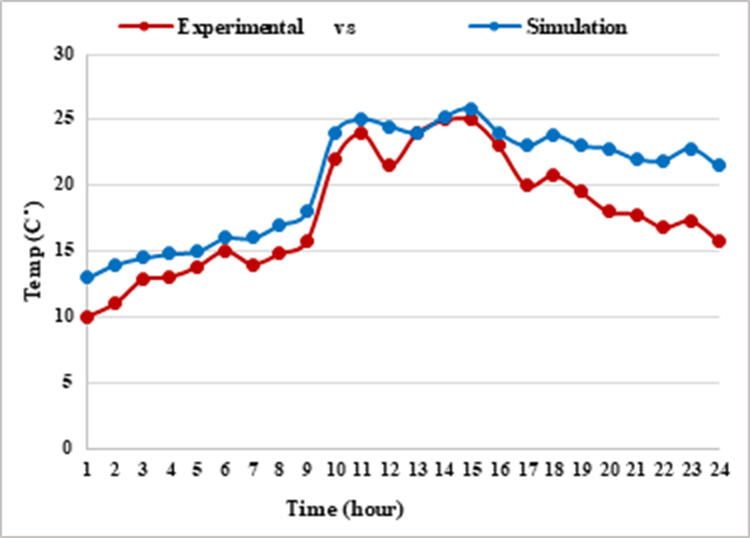
Figure 17 shows a comparison between the experimental and simulated results, revealing a similar correlation in the overall structure of both curves. The temperature gradually increases during daytime hours, peaking between 12:00 and 15:00, before commencing to decrease as evening approaches. The experimental values showed fluctuations, which were ascribed to abrupt variations in solar radiation, air circulation within and outside the greenhouse, and thermal loss via its walls.
The simulation results were significantly more stable and smooth because the mathematical model used in MATLAB showed relatively optimal behavior, free from sudden influences of environmental conditions. This demonstrates the model's capacity to precisely depict overall temperature behavior.
Figure 18 shows the comparison between the experimental and simulation results of humidity inside the greenhouse. The general drift of the two curves is close, as the humidity gradually rises during the daytime hours and decreases at 14:00, after which it rises again in the evening. In practice, humidifier operation resulted in sharp fluctuations over specific time periods, due to the devices' instantaneous
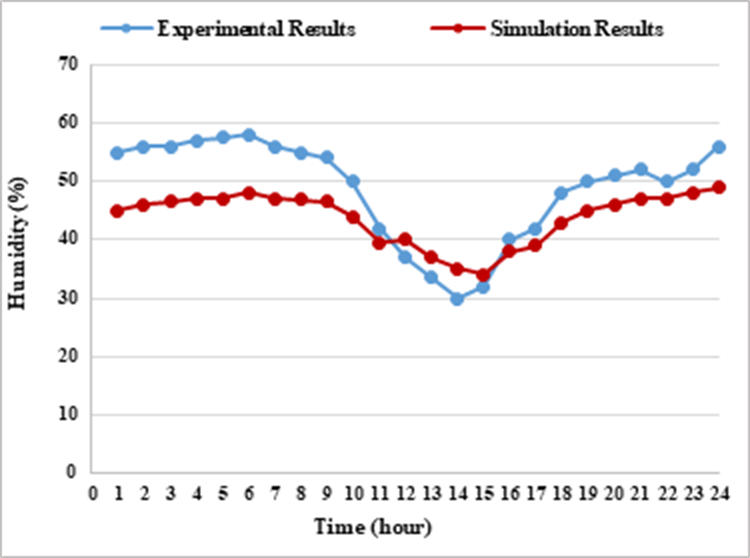
response, as well as moisture loss through ventilation and transpiration from plants. However, in the simulation, despite including a full day's worth of data, the fluctuations were more stable and smoother, as the mathematical model does not fully reflect the nonlinear nature of device response and sudden climate changes.
The accuracy of the numerical model was validated through experimentation. The average discrepancy (simulation vs. experimental) from the numerical model to the experiment was only 2.60°C for temperature and 5.89% for relative humidity, thus confirming good agreement between CFD simulation results and actual greenhouse operation conditions.
3.3. Quantitative uncertainty analysis and validation of the greenhouse model results
There was an experimental validation done to check that the CFD model could accurately predict the thermal/humidity behavior of a greenhouse under realistic working conditions. A comparison was then made between the numerical greenhouse model and actual experimental data to verify whether there was a good match between them. The greenhouse model was quantitatively validated by comparing the hourly temperature and humidity characteristics of the simulated and experimental results in Figures 17 and 18, respectively. MAE and RMSE can be determined as follows:
It was found that for hourly temperature response, MAE = 2.742°C and RMSE = 3.178°C, while for humidity, MAE = 5.479 %RH and RMSE = 6.714 %RH.
Temperature comparisons show that the model reproduces the general daily trend. There are even greater differences in the rapid transition period (9:0–15:0) when sunset and ventilation changes produce the largest gradients. The calculated values of MAE and RMSE indicate moderate agreement. These error values indicate that the simulation predictions were, on average, within a few degrees of the measured values. The highest percentage of error occurs at low experimental temperatures (in the morning), and in hours of intense heating, a small absolute difference will turn into a large percentage difference.
On the other hand, according to MAE and RMSE values, the simulated model and experimental results show good agreement for humidity comparison. The model shows recovery in the evening and low humidity during the day. The presence of crops, simplified ventilation boundary conditions, and assumptions about evaporation/transpiration rates in the numerical models likely explain the differences between simulated and experimental humidity.
The relative error (relative deviation) can be found as:
The model's relative deviation in error, in agreement with Equation 20, was found to be 0.1701 for temperature and 0.1416 for humidity. The low deviations support the validity of comparing the experimental results with the results of the analytical model used for testing purposes. Therefore, they showed that all conclusions obtained from this investigation are accurate, confirming the ability of the CFD prediction model to provide reliable predictions when evaluating greenhouse climates and enhancing ventilation systems.
The current CFD model has shown good agreement with experimental data; however, more improvements can be made in terms of predicting accuracy by implementing more accurate techniques. Based on previous greenhouse studies performed using CFD and the use of best-practice procedures for numerical analysis, Table 11 demonstrates potential reductions in both temperature and humidity prediction errors obtained through the use of more advanced simulation techniques.
Quantitative comparisons show that using advanced numerical methods to model greenhouse CFD can dramatically enhance prediction accuracy when compared with a steady-state approach (i.e., the method employed in this research). The use of transient simulations, dynamic solar radiation boundary conditions, and porous media plant transpiration models provides the greatest improvement in predicting realistic thermal and humidity behavior within greenhouses. When these advanced techniques are combined, it is estimated that the total prediction accuracy can be improved by ~ 50%.
The value of the deviations in temperature and humidity results when replacing plants with wood can be found from
Table 11: Reductions in temp and humidity prediction error using advanced simulation techniques over the proposed technique
| umerical method | Present technique | Advanced numerical method | Temp MAE reduction (%) | Humidity MAE reduction (%) | Overall CFD prediction accuracy improvement (%) |
|---|---|---|---|---|---|
| Simulation approach | Steady-state CFD | Transient CFD simulation | 20 | 15 | 18 |
| Turbulence model | Standard k−ε | RNG k−ε | 25 | 20 | 23 |
| Turbulence model | Standard k−ε | SST k−ω | 30 | 26 | 28 |
| Mesh strategy | Standard mesh | Fine mesh independence analysis | 35 | 29 | 32 |
| Solar radiation modeling | Constant thermal boundary | Dynamic solar radiation boundary conditions | 40 | 33 | 36 |
| Crop representation | Simplified crop assumptions | Porous-media crop model with transpiration | 48 | 41 | 44 |
| Combined advanced model | Traditional CFD framework | Integrated advanced numerical framework | 50–55 | 40–45 | 48–52 |
Table 11. The error from the experimental validation for the surrogate model of wood was 2.60°C for temperature and 5.89% RH for relative humidity. The revised crop assumptions of using a simplified model to a highly complex model incorporating an advanced porous-media model with active transpiration yielded 48% and 41% reductions in MAE for temperature and humidity, respectively. Therefore:
1- Temperature Deviation = 2.60°C × 48% = 1.25°C (within the expected range of 1-3°C).
2- Humidity Deviation = 5.89% RH × 41% = 2.41% RH (relative to the expected 5–10% range)
Within the confines of CFD modeling in greenhouses, the deviation of 1-3°C and 5-10% RH is an industry-wide recognized compromise because of the tremendous savings achieved in computational time and complexity through the elimination of complex biological transpiration algorithms while still providing an accurate representation of the macroclimate and airflow distribution.
Overall, while fine-scale anomalies exist (especially during transient peaks), the simulation provides a physically consistent representation of the greenhouse microclimate suitable for design studies and control strategy development. To further reduce the uncertainty, it is recommended to increase the temporal resolution of the boundary conditions (solar radiation and outdoor wind), incorporate more detailed crop transpiration modeling, and perform sensitivity analyses on material properties and ventilation leakage.
The CFD results for the small-scale greenhouse and the experimental results from this work cannot be directly applied to full-scale agricultural greenhouses. The airflow structure, thermal stratification, solar gain distribution, and ventilation behavior are all significantly influenced by geometric scale and volume. The small greenhouse experiences a greater influence from the effects of the wall and boundary than do commercial greenhouse systems and, as such, experiences thermal response times and airflow travel times that are generally much shorter than those of commercial greenhouse systems.
Dimensional similarity analysis using Reynolds number, Grashof number, and Richardson number matching will assist in reducing scale effects in future work, as well as the use of full-scale or larger greenhouse simulation validations. Scaling laws and dynamic similarity methods will assist in increasing the usability of these results to real agricultural greenhouses.
Future methodological improvements may also include 1) analysis of mesh independence, 2) dynamic external boundary conditions, and 3) linking the CFD model to intelligent control algorithms. These improvements will certainly improve prediction accuracy and energy optimization performance.
Analysis of the results of the greenhouse system allows drawing some conclusions and comparisons with previous relevant research, as shown in Table 12.
Table 12: Summary of the findings of previous studies on various types of agricultural greenhouse control systems
| Ref. | Greenhouse type | Main structural features | Control / Analysis method | Main findings |
|---|---|---|---|---|
| 26 | Tropical greenhouse structures | - Conventional wood - Curved multi-span (DMG) - Gothic multi-span (GMG) | CFD-based passive ventilation analysis | - Ventilation rates increased by 3.4 times compared with traditional design - Temp reduced by 2.8°C. - Ventilation is strongly affected by greenhouse geometry. |
| 30 | Plastic greenhouse | Polyethylene greenhouse with rooftop PV panels | PV-powered greenhouse system | - Temp reduced by 5–15°C; approximately 50% electricity saving - Sustainable on-site energy generation achieved. |
| 31 | Smart solar greenhouse | Hybrid covers with PV & selective films | Smart adaptive cover control | - Energy efficiency improved by 25% - Light transmission improved by 10–20% - PV arrays provided 40–60% energy savings. |
| 19 | Solar greenhouse dryer | 3D solar dryer structure | Thermal & airflow CFD simulation | - Average ambient temperature reached 66.1°C. - Solar drying efficiency improved by approximately 15%. |
| 27 | Three-span arched greenhouse | Steel frame with polyethylene cover | Natural ventilation analysis | - Vent opening & wind speed strongly affected greenhouse microclimate - Humidity variations reduced by approximately 18%. |
| 28 | Experimental crop greenhouse | 4-roof configurations | Mathematical optimization & CFD modeling | - Continuous airflow achieved - Temp maintained between 30.4–34.1°C - Crop yield improved by ~ 12%. |
| 32 | Smart agricultural greenhouse | IoT-based modular structure | Automated IoT control system | - Agricultural efficiency reached 87.5% - Irrigation & cooling accuracy improved - Reduced manual operation. |
| 33 | Glass greenhouse | Structural glass enclosure | IoT cooling system with CFD validation | - Stable temperature around 27.21°C - Humidity ranged from 57–86% - Temp peaks reduced by 5–7°C. |
| 39 | Solar greenhouse | Semi-circular roof with passive vents | Passive ventilation control | - Relative humidity maintained above 65% - Daily temperature variation controlled within ±2°C. |
| 40 | Eight-span plastic greenhouse | Large multi-span greenhouse | CFD airflow & humidity simulation | Increasing wind speed improved temperature & humidity uniformity by ~ 35%. |
| 29 | Closed greenhouse design | Fully enclosed greenhouse structure | CFD thermal-flow analysis | - Thermal uniformity improved by 39.4% - Air circulation efficiency increased by 22%. |
| 35 | Intelligent vegetable greenhouse | Controlled-environment greenhouse | Single-neuron PID algorithm | - Temp & humidity maintained within ±1°C & ±3% RH - Energy savings reached 18%. |
| Present study | Automated compact greenhouse | Compact pyramidal greenhouse with upper fan & upper vents | CFD simulation with experimental validation | - Best performance achieved using top fan & top vents - Temp maintained between 26.07–27.19°C - Humidity between 60.85–81.25%; improved indoor climate stability & sustainable operation. |
4. Conclusion
This study aims to evaluate three different venting arrangement types for greenhouses located in Baghdad by using CFD simulation and laboratory trials for verifying the CFD results obtained. The design with the fan mounted on top and the vent placed high had the best environment for growing plants, maintaining temperatures of 26.07-27.19°C, relative humidity of 60.85-81.25%, and a velocity of the airflow at 0.396 m/s. This type of design resulted in improving the climate within the greenhouse by approximately 15-20% when compared to the other arrangements, as demonstrated by the more uniform distribution of temperature and humidity and a decrease in the temperature variations from ±4.50 to ±0.60 °C.
In addition to climate improvements, the optimized arrangement increases the energy efficiency of the greenhouse by decreasing the duty cycle of the fan and heater from 75 to 55% and 50 to 35%, respectively. The result is that the electrical energy consumption is reduced from 4.80 to 3.50 kWh/day (1,752 to 1,278 kWh/year), which corresponds to a 27.1% reduction in energy consumption. These were helped by improved distribution of airflow, less thermal stratification, and ventilation powered by PV.
Future studies should focus on developing transient CFD modeling considering the effect of energy loss due to crop transpiration, intelligent control strategies such as fuzzy logic and adaptive PID control methods, and a long-term experimental study to determine the effect of different growing seasons on yield and energy consumption for growing crops.
Acknowledgements
We sincerely thank our colleagues for their essential guidance that promoted the development of this work through constructive criticism, technical support, and constructive talks.
References
- A. Behzadi and A. Arabkoohsar, "Feasibility study of a smart building energy system comprising solar PV/T panels and a heat storage unit," Energy, 210 (118528) (2020). doi:10.1016/j.energy.2020.118528
- D. Kassymbekov and D. Aitkul, "Economic Aspects of the Benefits of Renewable Energy Considered in the Legal Framework in Different Countries," Evergreen, 11 (2) 576-585 (2024). doi:10.5109/7183311
- R.A. Dunlap, "Renewable Energy: Requirements and Sources (Synthesis Lectures on Renewable Energy Technologies Series)," 4th Edition, Spring, 2024. doi:10.1007/978-3-031-77185-9
- M. Ayundyahrini, D.A. Susanto, H. Febriansyah, F.M. Rizanulhaq, and G.H. Aditya, "Smart Farming: Integrated Solar Water Pumping Irrigation System in Thailand," Evergreen, 10 (1) 553-563 (2023). doi:10.5109/6782161
- M.W. AlShaar, Z. Al-Omari, W. Emar, M. Alnsour, G. Abu-Rumman, "Application of PV-Thermal Array for Pumping Irrigation Water as an Alternative to PV in Ghor Al-Safi, Jordan: A case study," Evergreen, 9 (4) 1140-1150 (2022). doi:10.5109/6625725
- A. Ashraf and K. Jamil, "Solar-powered irrigation system as a nature-based solution for sustaining agricultural water management in the Upper Indus Basin," Nature-Based Solutions, 2 (100026) (2022). doi:10.1016/j.nbsj.2022.100026
- L.A. Rasheed, J.A.-K. Mohammed, and R.A. Jessam, "Performance Enhancement of a Single Pass Solar Air Heater by Adopting Wire Mesh Absorber Layer," Evergreen, 10 (2) 880-887 (2023). doi:10.5109/6792883
- L.A. Rasheed, J.A.-K. Mohammed, and R.A. Jessam, "Performance Enhancement of Solar Air Heater by Integrating Innovative Absorber Design and Automatic Control Flow Rate," Evergreen, 10 (3) 1439-1448 (2023). doi:10.5109/7151693
- L.A. Rasheed, A. V. Yurchenko, J.A.-K. Mohammed, V.I. Syryamkin, and N.V. Ershov, "The effect of automated airflow regulation on the performance of an indirect solar dryer: a comparative study," Russ Phys J, 68 288–293 (2025). doi:10.1007/s11182-025-03431-1
- L.A. Rasheed, A.V. Yurchenko, V.I. Syryamkin, and J.A.-K. Mohammed, "Optimization of Agricultural Drying using PCM Based Automated Indirect Solar Dryers," Russ Phys J, 66 (2023) 983-989. doi:10.1007/s11182-023-03033-9
- A. Lingayat, R. Balijepalli, and V.P. Chandramohan, Applications of solar energy based drying technologies in various industries – A review," Solar Energy, 229 (2021) 52-68. doi:10.1016/j.solener.2021.05.058
- K. Tewari, and R. Dev, "Analysis of modified solar water heating system made of transparent tubes & insulated metal absorber," Evergreen, 5 (1) 62-72 (2018). doi:10.5109/1929731
- Y.-D. Kim, K. Thu, and K.C. Ng, "Evaluation and parametric optimization of the thermal performance and cost effectiveness of active-indirect solar hot water plants," Evergreen, 2 (2) 50-60 (2015). doi:10.5109/1544080
- F. Eze, M.N. Egbo, U. Anuta, and J.M. Mwabora, "A review on solar water heating technology: Impacts of parameters & techno-economic studies," Quaternaire, 48 (29) 2024. doi: 110.1186/s42269-024-01187-1
- I. Fitriana, N. Niode, Anindhita, W. A. Darmawan, et al., "Rooftop Solar Power System for EV Charging Station of Household Customers in Indonesia: A review and an Opportunity for Developing Countries," Evergreen, 11 (2) 821-845 (2024). doi:10.5109/7183364
- Z. Aqachmar, H.B. Sassi, K. Lahrech, and A. Barhdadi, "Solar technologies for electricity production: An updated review," Inter J Hydr Ener, 46 (60) 30790-30817 (2021). doi:10.1016/j.ijhydene.2021.06.190
- R. P. Castro, P. D. da Silva, and L. C. C. Pires, "Advances in Solutions to Improve the Energy Performance of Agricultural Greenhouses: A Comprehensive Review," Appl. Sci., 14 (14) 6158 (2024). doi:10.3390/app14146158
- D. Zhou, H. Meinke, M. Wilson, L.F.M. Marcelis, and E. Heuvelink, "Towards delivering on the sustainable development goals in greenhouse production systems," Resour, Conserv Recycl, 169 (105379) (2021). doi:10.1016/j.resconrec.2020.105379
- Y.H.P. Duong, N.T. Vo, P.T.K Le, and V.T. Tran, "Three-Dimensional Simulation of Solar Greenhouse Dryer," Chem Eng Trans, 83 (2021) 211-216. doi:10.3303/CET2183036
- A. devlet, "Modern Agriculture and Challanges," Frontiers in Life Sciences and Related Technol. 2 (1) 21-29 (2021). doi:10.51753/flsrt.856349
- S.S. Mohamed, A.A. Belal, S.K. Abd-Elmabod, M.A. ElShirbeny, A. Gad, and M.B. Zahran, "Smart farming for improving agricultural management," The Egyp J Remo Sens Space Scie, 24 (3) 971-981 (2021). doi:10.1016/j.ejrs.2021.08.007
- B. Rabbi, Z.-H. Chen, and S. Sethuvenkatraman, "Protected cropping in warm climates: A review of humidity control and cooling methods, " Energies, 12 (14) 2737 (2019). doi:10.3390/en12142737.
- R.W. Liu, H. Guzman, J.L., and M. Li, "A model based methodology for the early warning detection of cucumber downy mildew in greenhouses: An experimental evaluation," Comput. & Electron. in Agricul., 194 (106751) (2022). doi:10.1016/j.compag.2022.106751
- I. Tsafaras, J.B. Campen, C. Stanghellini, et al., "Intelligent greenhouse design decreases water use for evaporative cooling in arid regions," Agricul. Water Manag., 250 (106807) (2021). doi:10.1016/j.agwat.2021.10680
- J.R. Lamichhane, "Greenhouse cultivation for more sustainable food systems," Nature Food, 5 (2024) 457–458. doi:10.1038/s43016-024-00987-y
- E.A. Villagran, E.J. Baeza Romero, and C.R. Bojacá, "Transient CFD Analysis of the Natural Ventilation of Three Types of Greenhouses Used for Agricultural Production in a Tropical Mountain Climate," Biosystems Eng., 188 (288304) (2019). doi:10.1016/j.biosystemseng.2019.10.026
- Lyu X., Y. Xu, M. Wei, C. Wang, G. Zhang, and S. Wang, "Effects of Vent Opening, Wind Speed and Crop Height on Microenvironment in Three-Span Arched Greenhouse under Natural Ventilation," Comp Electro Agricul, 2022. doi:10.1016/j.compag.2022.107326
- Wangkahart S., C. Junsiri, A. Srichat, S. Poojeera, K. Laloon, K. Hongtong, and P. Boupha, "Using greenhouse modelling to identify the optimal conditions for growing crops in Northeastern Thailand," Math. Model. of Eng. Prob., 9 (6) 1648-1658 (2022). doi:10.18280/mmep.090626
- I. Ghibeche, A. Nourani, T.T. Naas, and S.E. Benziouche, "A computational fluid dynamics (CFD) modeling in a new design of closed greenhouse," Studies in Engineering and Exact Sciences, 5 (1) 649-666 (2024). doi:10.54021/seesv5n1-037
- H. D. Salman, M. A. Nasser Ali, and J. J. Faraj, "Study the possibility of using solar panels on the rooftop of plastic greenhouse for power generation during Iraqi climate," J Adv Resear Flu Mech. Therm Scien, 69 (2) 91–110 (2020). doi:10.37934/ARFMTS.69.2.91110
- C. Maraveas, D. Loukatos, T. Bartzanas, K.G. Arvanitis, and J.F. Uijterwaal, "Smart and Solar Greenhouse Covers: Recent Developments and Future Perspectives," Front. in Ener. Resear., 9 (783587) (2021). doi:10.3389/fenrg.2021.783587
- U. Asibeluo and O.G. Ekuyota "Design and development of smart agricultural greenhouse," Turkish J. Agric. Eng. Resear., 4 (2) 191-202 (2023). doi:10.46592/turkager.1362000
- Z. Zhu, Y. Li, and S. Gong, "Design and experiment of Internet-of-Things cooling system in glass greenhouse based on computational fluid dynamics simulation," J. of Agric. Eng., 54 (1384) (2023). doi:10.4081/jae.2023.1384
- J. Riahi, H. Nasri, A. Mami, and S. Vergura, "Effectiveness of the Fuzzy Logic Control to Manage the Microclimate Inside a Smart Insulated Greenhouse," Smart Cities, 7 (3) 1304–1329 (2024). doi:10.3390/smartcities7030055
- S. Huang, X. Huiyu, L. Chongjie, D. Tongyang, and H. Guanghui, "Intelligent Regulation of Temperature and Humidity in Vegetable Greenhouses Based on Single Neuron PID Algorithm," Electronics, 13 (11) 2083 (2024). doi:10.3390/electronics13112083
- V. Thomopoulos, F. Tolis, T.-F. Blounas, D. Tsipianitis, and A. Kavga, "Application of Fuzzy Logic and IoT in a Small-Scale Smart Greenhouse System," Smart Agric Tech, 8 (100446) (2024). doi:10.1016/j.atech.2024.100446
- M. Jawad, F. Wahid, S. Ali, Y. Ma, A. Alkhyyat, and Y. Lee, "Energy Optimization and Plant Comfort Management in Smart Greenhouses Using the Artificial Bee Colony Algorithm," Scientific Reports, 15 (1752) (2025). doi:10.1038/s41598-024-84141-5
- W. Lei, H. Lu, X. Qi, C. Tai, X. Fan, and L. Zhang, "Field Measurement of Environmental Parameters in Solar Greenhouses and Analysis of the Application of Passive Ventilation," Solar Energy, 263 (111851) (2023). doi:10.1016/j.solener.2023.111851
- Q. Mao and H. Li., "Simulation of Ambient Temperature and Humidity Distribution in Eight-Span Greenhouse under Different Wind Conditions and Corn Height," Case Stud. in Therm. Eng., 61 (105099) (2024). doi:10.1016/j.csite.2024.105099
- H. Fatnassi, P.E. Bournet, T. Boulard, J.C. Roy, F.D. Molina-Aiz, and R. Zaaboul "Use of computational fluid dynamics tools to model the coupling of plant canopy activity and climate in greenhouses and closed plant growth systems: A review," Biosys Eng, 230 (2023) 388–408. doi:10.1016/j.biosystemseng.2023.04.016
- S. Tigampo, S. Kooli, N. Ben Salah, W. Foudhil, R. Errais, V. Sambou, and S. Ben Jabrallah, "CFD modelling of the microclimate of a cultivated greenhouse: Validation between experimental and numerical results," J Ther Eng, 9(5) (2023) 1545–1564. doi:10.18186/thermal.1370719
- R. Liu, M. Li, J.L. Guzmán, and F. Rodríguez, "A fast and practical one-dimensional transient model for greenhouse temperature and humidity," Comput Electron Agric, 186 (106186) (2021). doi:10.1016/j.compag.2021.106186
- M. Zhang, T. Yan, W. Wang, X. Jia, J. Wang, and J.J. Klemeš, "Energy-saving design and control strategy towards modern sustainable greenhouse: A review," Renewable and Sustainable Energy Reviews, 164 (112602) (2022). doi:10.1016/j.rser.2022.112602
- S.-C. Vanegas-Ayala, J. Barón-Velandia, and D.-D. Leal-Lara, "A Systematic Review of Greenhouse Humidity Prediction and Control Models Using Fuzzy Inference Systems," Adv Hum Comput Interact, 8483003 (2022). doi:10.1155/2022/8483003