
Abstract
Jakarta is increasingly at risk of urban flooding, especially in the Ciliwung and Cisadane watersheds, where heavy rainfall and inadequate drainage systems increase the likelihood of flooding. The main objective of this study is to develop an integrated approach that combines computational flood modeling with Nature-based Solutions (NbS) to improve flood prediction, assess extreme hazard scenarios, and propose sustainable mitigation strategies. A hybrid methodology was applied by integrating the Hydrologic Engineering Center-River Analysis System (HEC-RAS) with the Geomorphic Flood Area (GFA) tool. The GFA provides quick and affordable mapping by defining flood-prone areas using high-resolution digital elevation models (DEMs) and a binary classification algorithm. In order to evaluate flood extents under extreme scenarios, such as a 100-year return period (Q100), HEC-RAS concurrently simulates water surface profiles for different flow regimes. Spatially explicit flood hazard maps for both recent and anticipated occurrences are created using a GIS-based dashboard to visualize these outputs. According to scenario analysis, Pluit Reservoir's high-risk flood zones would significantly expand under Q100 projections. The surface water level would rise by about 1 meter, which would mean an additional 800,000 m³ of floodwater. The study further evaluates floating wetlands planted with cattails (Typha latifolia) as a complementary NbS intervention. The results show that floating wetlands provide only a limited direct contribution to short-term flood storage during an individual extreme event, approximately 0.6% of the additional Q100 flood volume. In addition to their limited contribution to water retention, floating wetlands can contribute to nutrient reduction, biodiversity enhancement, and improved water quality. These findings highlight the importance of combining GIS, hydrodynamic modelling, and carefully contextualized NbS evaluation to support evidence-based and adaptive urban flood-risk reduction in rapidly urbanizing coastal cities such as Jakarta.
Keywords: computational modeling, geomorphic flood area, hydrologic engineering center-river analysis system, nature-based solutions, urban flooding
Outline
1. Introduction
The contributing factors to flooding in metropolitan settings are population growth, limited land availability, flat topography, catchment area characteristics, and various soil types1–4). The Jakarta area exhibits significant population density, with slope conditions ranging from 1% to 15%, and proximity to the coastal region, thereby increasing susceptibility to flooding, as shown by compound wave, surge, and river flooding with land subsidence in northern Jakarta5), floods rising from about five to over 20 per year with losses of about USD 500 million6), community-based flood-adaptation planning in North Jakarta kampungs7), climate- and urbanization-driven increases in peak discharge and inundation8), flood-disrupted access to critical services9), and subdistrict-level vulnerability mapping10). Therefore, a distinct flood management method is required for early warning system, as illustrated by Delft-FEWS discharge refinement in West Java11), a bibliometric review showing regional research gaps12), a review of forecasting models dominated by neural networks since 201113), integration of community and institutional systems in Colombia14), and rainfall-threshold methods for flash-flood warning15). Data on flood conditions that have transpired over a 5-year period. Using extensive and varied data, it is processed into a digital mapping system using machine learning16–19) to classify the extent of flooding.
Various flood maps have been released by various agencies; nevertheless, it is important to acknowledge that these maps are only useful for a maximum of five years owing to the dynamic nature of urban development. Computer aids are essential to resolve this issue, as computers are the primary instruments for processing, interpreting, and displaying intricate flood data, for example computer-vision support for flood monitoring, modeling, and public awareness20), AI-based flood prediction with attention to data bias and interpretability21), Sentinel-1 flood mapping with speckle filtering and geometric correction22), deep-learning water-level estimation from camera images (mean error 3.32 cm)23), and AdaBoost-GIS susceptibility mapping (AUC = 0.864)24). The function of computer technology in flood mapping involves the collection and processing of extensive data including rainfall statistics, river discharge, surface elevation, and urban infrastructure information, as in synthetic-hydrograph discharge estimation with MIKE FLOOD hazard mapping25), urban flood monitoring reviews highlighting radar, satellite, IoT, and AI26), Sentinel-1 flood mapping in Google Earth Engine27) and with fuzzy topographic refinement (98.5% accuracy)28), Sentinel-1/2 fusion for cloud-prone areas29), and evidence that global DEMs overestimate flood extent and underestimate depth30). These data were subsequently processed using specific technologies to create structured outputs such as digital flood risk maps.
Geographic Information System (GIS) software is a prevalent technology employed in flood mapping that enables computers to display diverse information, including flood susceptibility levels, impacted regions, and mitigation strategies, on a single interactive map. Machine learning technology uses algorithms to train systems to identify previous trends in flood data, enabling the prediction of future flood probabilities, including MLP-based forecasting from meteorological, hydrological, and crowdsourced data (97.93% correct)31), deep neural networks outperforming SVM, KNN, and Naïve Bayes32), a review of 1,101 flood prediction studies33), SAR-based identification of recurrent flood zones34), and hybrid ensemble susceptibility zonation35). Computers enable machine learning to classify and arrange regions according to differing flood risks, thereby facilitating the implementation of suitable safeguards for each location. Currently, it is feasible to integrate multiple technologies to achieve optimal outcomes, for instance HEC-RAS and HEC-HMS with GIS for Q25–Q500 hazard mapping36), ELECTRE band selection with SVM water classification37), AHP with machine learning (CART accuracy 0.892)38), ensemble learning consistent with rainfall–runoff inundation maps39), and metaheuristic-optimized classifiers with Sentinel-1 data (AUC = 0.889)40).
This study examined the integration of computer technology into the creation of flood vulnerability maps as a foundation for developing adaptive and sustainable flood management strategies. In recent years, Nature-based Solutions (NbS) have emerged globally as an alternative and complementary approach to conventional grey infrastructure41–44). NbS utilize natural processes and ecosystems, such as wetlands, green spaces, and vegetated waterways, to minimize flood risk by enhancing water retention, slowing surface runoff, and restoring ecological balance. Their main objective is to reduce peak flood discharges while simultaneously delivering co-benefits such as improved water quality, biodiversity enhancement, and long-term climate resilience45–48). Although GIS-based flood mapping and hydraulic modelling are widely used, their integration with quantitative NbS assessment remains limited, particularly in polder-dependent coastal megacities. This gap is significant for Jakarta, where flood risk is driven by rapid urbanization, low-lying coastal terrain, drainage constraints, and reliance on engineered polder systems. This study addresses this gap by integrating GFA-based hazard identification, HEC-RAS modelling, GIS visualization, and NbS assessment to evaluate flood risk reduction in the Pluit Polder System under existing and projected extreme flood scenarios49–51).
Given Jakarta’s increasing exposure to urban flooding and the limitations of conventional grey infrastructure, this study sets out three main objectives. First, to improve flood prediction and vulnerability mapping by integrating computational tools, specifically the Hydrologic Engineering Center-River Analysis System (HEC-RAS)36,52,53), the Geomorphic Flood Area (GFA) classifier, and GIS-based visualization. While the use of GIS and hydraulic modelling in flood studies is well established, the novelty of this study lies in the combined use of rapid geomorphic flood-prone area identification through GFA, hydrodynamic simulation through HEC-RAS, and Nature-based Solution evaluation within a single scenario-based framework for Jakarta’s Pluit Polder System54–57). Second, the study assesses extreme flood hazard conditions, particularly the 100-year return period scenario (Q100), to estimate upper-bound flood risks under both existing and projected hazard conditions. Third, it evaluates the potential contribution of floating wetlands planted with cattails (Typha latifolia) as a complementary NbS intervention within the Pluit Polder System, with attention to both short-term flood-storage contribution and longer-term hydrological, ecological, and water-quality benefits. By linking GFA-based hazard screening, HEC-RAS-based hydraulic simulation, and NbS performance assessment, this study contributes an evidence-based framework for adaptive and integrated flood management in rapidly urbanizing regions.
2. Literature Review
2.1. Geomorphic Flood Area (GFA)
To calculate the existing flooding hazards in watersheds of the Jakarta area, Geomorphic Flood Area (GFA), a tool developed by Samela58) combined with the geospatial tool GIS software, is used to perform accurate flood-mapping calculation and visualization, as in GARI-based story maps for flood risk communication59), ArcGIS architecture best practices60), entropy-weighted AHP risk zoning (21.29% high risk)61), a meta-analysis showing GIS supports flood risk mapping in Malaysia62), and GIS-AHP hazard mapping in Bitlis63). The GFA generates flood susceptibility maps by integrating geomorphological data from DEMs with flood hazard data from existing inundation maps, which typically cover only parts of a basin. It classifies points within a basin into flood-prone or non-flood-prone areas using a linear binary classifier based on the Geomorphic Flood Index (GFI), identified as the most suitable of eleven descriptors for data-scarce regions64), compared with deep-learning inundation mapping65), extended to uncalibrated rainfall depths in arid regions (accuracy above 80%)66), adapted to cliffed coasts (74% to 94%)67), and combined with IDF-area curves in Iranian basins68). The index can be seen in (1), which involves comparing the water level () at the nearest river (r) point with the elevation difference () between that point and the basin point. The water level is estimated as a function of the contributing area using the hydraulic scaling function, as seen in (2),
where is the water depth [m], [km²] is the contributing area at the nearest river point, and n is a dimensionless exponent. The GFI was calibrated using a training area, with a minimum calibration area of 2% of the basin size required to determine the optimal threshold. This method is beneficial when there is a lack of comprehensive data for flood simulations, and provides preliminary suggestions regarding geomorphologically prone flood areas, making it both cost-effective and fast.
2.2. Hydrologic Engineering Center-River Analysis System (HEC-RAS)
To perform the Q100 projection of hazards in the Jakarta area watersheds, HEC-RAS provides essential tools for hydraulic modeling. The approach allows the simulation of both steady and unsteady flow regimes, making it a valuable tool for understanding flood risks under various scenarios69–72). Equation (3) and (4) show the comprehensive usage of the HEC-RAS calculation,
where represents the total discharge in the main channel, and denotes the discharge from the main channel. Parameter is defined as the ratio of the conveyance capacity of main channel's, , to the total conveyance capacity, ,, where z represents the conveyance capacity of the overbank. The variable is the water elevation, and and are the roughness coefficients of the main channel and overbank, respectively. and represent the cross-sectional areas of the main channel and the overbank, and is the gravitational acceleration.
2.3. Nature-based Solution (NbS)
Nature-based Solutions (NbS) represent a pivotal shift in urban infrastructure planning from climate-vulnerable to climate-resilient approaches. Many cities now focus on ways to reconnect with nature, enhance the ecological value of shared urban spaces, and address climate change challenges in an inclusive and sustainable manner. Urban ecosystems are becoming increasingly central to these innovations, serving as NbS to improve urban living conditions and promote resilience73–76). NbS are actions supported or copied from nature with the aim of preserving the functionality of natural ecosystems or restoring them in human-modified ecosystems. In this context, NBS are proposed as nature-based interventions that can address sustainability challenges such as climate change, hydrogeological risk, environmental disasters, food security, water security, human health, resource scarcity, social and economic development, ecosystem and landscape degradation caused by urbanization processes, and biodiversity restoration and enhancement21,25).
2.4. Related Works
Previous studies, such as flood modeling at the Situ Duit Bridge on the Ciliwung River in Bogor, Indonesia, were analyzed by Rau77). The study used ten years of rainfall data from the Citeko Meteorological Station (up to 2018) along with river geometry data obtained via drone surveys and DEMNAS. To enhance the accuracy, images and videos documenting past flood events were sourced from online platforms. Hydrological data, including discharges for the return periods (Q2, Q50, Q100, and Q200), were calculated using the Nakayasu Synthetic Unit Hydrograph (SUH) method78–80). The methodology included UAV topographical surveys, unit hydrograph analysis, and flood inundation modeling using HEC-RAS 5.0.7. The study also incorporated online visual media to validate past flood events, achieving a strong correlation between simulated and observed flood conditions. This work demonstrates the value of combining hydraulic modelling, topographic data, and alternative validation sources in data-limited environments. However, its focus was primarily on hydraulic reconstruction and flood-level estimation, without extending the analysis to Nature-based Solution performance or long-term mitigation scenarios.
Another study81) investigated the integration of Nature-based Solutions (NbS) for flood mitigation in Jayapura, Indonesia, using multi-criteria decision analysis and the Analytic Hierarchy Process, considering land use, infrastructure, and environmental criteria. This approach is useful for identifying priority areas for NbS implementation, but it does not quantify how such interventions affect flood depth, volume, or hazard extent under extreme scenarios. Other Southeast Asian countries, including Singapore48,82) and Thailand83), have also explored NbS for urban flood mitigation as part of ASEAN’s collective goal84). These studies highlight the regional importance of NbS, yet their findings are not directly transferable to Jakarta’s highly urbanized, low-lying, and polder-dependent flood management system.
In semi-arid regions such as Türkiye, the integration of HEC-RAS and HEC-HMS with GIS significantly enhances flood modeling capabilities by improving data accuracy, efficiency, and hazard map predictions for rivers such as Tigris85) and Göksu36). Similarly, in arid regions, such as Saudi Arabia66) and Iran68,70), flood inundation mapping has been improved using the GFI classifier to address the significant risks posed by flash floods. Floods can cause substantial structural, social, and economic damage. This study extends the GFI to predict flood extent maps for uncalibrated rainfall depths, improves inundation map accuracy through calibration methods, and assesses the GFI’s performance across diverse terrains and resolutions. Using the HEC-RAS 2D hydrodynamic model, reference flood maps were generated from three case studies in Saudi Arabia using high-resolution (1 m) and resampled low-resolution DEMs under varying rainfall depths. The results show that the GFI produces inundation maps with over 80% accuracy compared with the reference maps, revealing strong relationships between rainfall depths and GFI threshold parameters. This facilitates the building’s generation of inundation maps for any rainfall event, contributing to improved flood risk management and preparedness in arid regions. However, their focus remains primarily on physical hazard simulation, with limited integration of Nature-based Solutions as measurable flood mitigation interventions. A study59) discussed a flood risk assessment project in the Petite-Nation River watershed, Quebec, Canada, utilizing the GARI tool to evaluate the damage to residential based on water height. Input data included hydrometric station readings, building damage curves, and property assessments, whereas outputs were visualized through GIS layers in ArcGIS Online, culminating in an interactive story map. However, they are either focused on damage assessment and communication or on urban drainage interventions, rather than on integrating rapid flood hazard screening, HEC-RAS-based hydraulic simulation, and NbS evaluation in a polder-based coastal megacity.
The 1D/2D coupled surface runoff model using the simulation software InfoWorks ICM, which incorporates sustainable urban drainage systems (SUDS) and low-impact development (LID) elements, was studied by Neumann86), as different scenarios were modeled to evaluate the effectiveness of various nature-based solutions. The input for the study included rainfall data with varying return periods and characteristics of selected rainfall events, as well as the design of green roofs and LID systems. The output consisted of flood volume comparisons between different scenarios, including the effectiveness of various NbS types in flood reduction and the inflow and outflow ratios for swales. The study quantified flood volume reduction, inflow–outflow ratios, and the performance of green roofs and swales, thereby showing how NbS-related interventions can be evaluated through urban drainage simulation. However, its focus was primarily on stormwater management and SUDS performance, rather than on integrating geomorphic flood-prone area screening with large-scale hydrodynamic flood hazard mapping. The Shuttle Radar Topography Mission (SRTM) Digital Elevation Model (DEM) was studied by Kumar87) to create a high-resolution representation of the terrain, which is essential for flood hazard risk modeling, Land Use and Land Cover (LULC) maps, and river geometry generated through HEC-GEO-RAS, and the output consists of flood hazard zoning maps, hydraulic modeling results, and cross-section diagrams of the river. This study highlights the importance of DEM-based terrain representation and GIS-supported hydraulic modelling for flood risk assessment. Nevertheless, it did not explicitly evaluate NbS performance or connect flood hazard zoning with intervention-based flood risk reduction scenarios.
3. Materials and Methods
3.1. Jakarta Watersheds Analysis
To perform a maximum flood discharge analysis, the watershed or catchment area that affects roads in the Jakarta region must first be identified. Determining the watershed is crucial for analyzing the water flow distribution as water enters specific areas downstream. Therefore, accurately identifying the upstream catchment area that affects the downstream location is essential77). In this study, the identified watersheds are the Ciliwung and Cisadane watersheds, covering 38,610.25 and 151,576.64 hectares respectively. This catchment area was used for further hydrological and hydraulic analysis.
3.2. Rainfall Dataset
The rainfall data for the study area were derived from various rain gauge stations available through an open-source website provided by a meteorological, climatological, and geophysical agency88), including the Budiarto Meteorological Station, Tangerang Geophysical Station, Soekarno Hatta Meteorological Station, Kemayoran Meteorological Station, Halim Perdana Kusuma Station, Tanjung Priok Maritime Meteorological Station, Bogor Climatological Station, Citeko Meteorological Station, South Tangerang Climatological Station, Cikasungka Station, and Gunung Mas Station. A map of the locations of these stations is shown in Figure 1.
The maximum daily rainfall for each month is used to analyze rainfall conditions, based on 20 years of data (2001–2020). After that, the regional precipitation was determined using the Polygon Thiessen method89). The representation of the precipitation data can be seen in Table 1.
Table 1: Dataset Representation
| Year | Rain Gauge Stations | Regional precipitation | |||
|---|---|---|---|---|---|
| Bogor | Budiarto | ... | Cikasungka | ||
| 2001 | 107.50 | 87.70 | ... | 138.00 | 111.18 |
| 2002 | 127.00 | 89.30 | ... | 80.00 | 108.07 |
| 2003 | 123.30 | 89.00 | ... | 90.00 | 109.68 |
| ... | ... | ... | ... | ... | ... |
| 2020 | 122.90 | 118.60 | ... | 93.75 | 117.60 |
| Average | 127.12 | 101.38 | ... | 100.47 | 117.43 |
| Maximum | 169.10 | 227.50 | ... | 199.50 | 165.06 |
| Minimum | 97.40 | 68.10 | ... | 46.00 | 90.69 |

3.3. Rainfall Frequency Analysis
The design rainfall analysis was based on the maximum rainfall with a specific return period, which was calculated using frequency analysis. Design rainfall analysis is essential for estimating design flood discharge, which informs the dimensions of spillways, dam heights, and other supporting structures. Design rainfall refers to the largest annual rainfall with a certain probability of occurrence in a region, or rainfall with a specified return period. Statistically, the design of rainfall for a given return period can be estimated from long-term maximum annual daily rainfall data (> 20 years) through frequency distribution analysis. Design rainfall is typically calculated for return periods of 2, 5, 10, 20, 25, 50, 100, and 1000 years.
To determine the most appropriate probability distribution for design rainfall estimation, Normal, Lognormal, Log Pearson Type III, and Gumbel distributions were evaluated using statistical parameter conformity, Chi-square goodness-of-fit, and Smirnov–Kolmogorov tests. The Chi-square test assessed the vertical deviation between observed and theoretical frequencies, while the Smirnov–Kolmogorov test examined the maximum horizontal deviation between empirical and theoretical probability distributions. Although all four distributions satisfied the Chi-square and Smirnov–Kolmogorov criteria, the Normal and Lognormal distributions did not fully meet the required skewness and kurtosis parameters. The Gumbel distribution was therefore selected because it satisfied the goodness-of-fit requirements, showed appropriate conformity for annual maximum rainfall analysis, and is suitable for modelling extreme hydrological events. Consequently, Gumbel-based design rainfall values were used as input for design flood estimation and subsequent HEC-RAS flood hazard simulation.
3.4. Calculating Existing Flood Hazard Using GFA
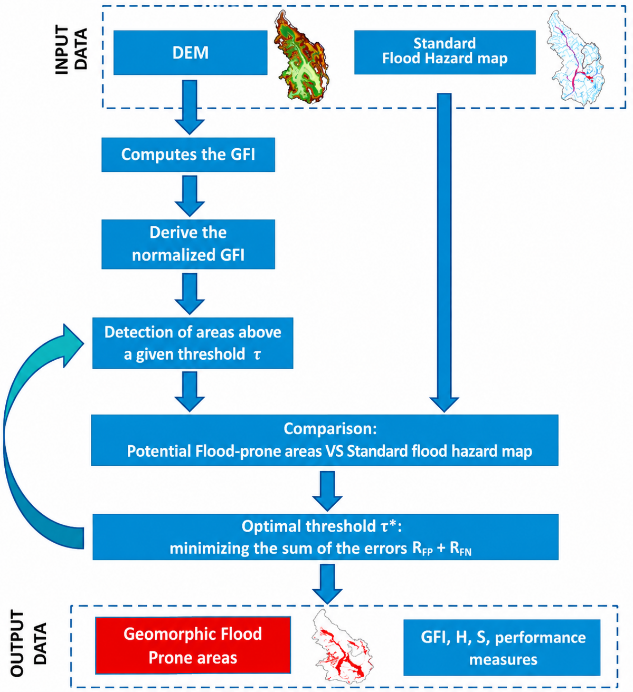
By utilizing the DEM and applying the GFI, the Geomorphic Flood Area (GFA) can perform binary classification to identify existing flood-prone areas in 2020. Figure 2 presents a flowchart of the GFA process, outlining the input data and the corresponding outputs.
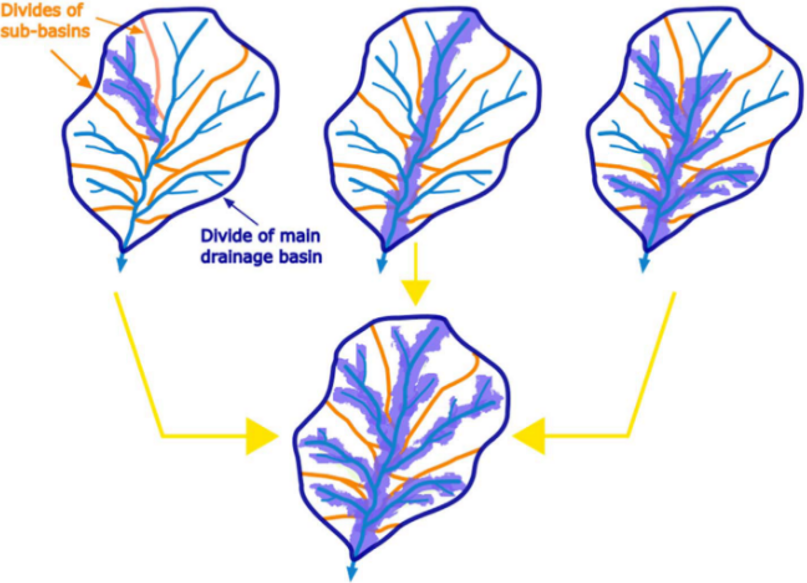
An example of the results is shown in Figure 3, which illustrates the subdivision of sub-basins within watersheds90), specifically focusing on key drainage patterns in the region. This visualization offers insights into how floodwaters flow through various sections of the city's watersheds, particularly in areas such as the Ciliwung River basin, which is highly prone to flooding. By identifying the most affected areas, the GFA tool aids in flood risk management and provides more targeted Nature-based Solutions for mitigating flood impacts in Jakarta.
3.5. Calculating Q100 Flood Hazard Projection Using HEC-RAS
The HEC-RAS provides essential tools for hydraulic modeling, making it particularly effective for simulating water surface profiles and flood events in complex urban environments in Jakarta. It allows a detailed analysis of flood behavior, including projections for different return periods, such as Q100 (100-year projection) based on 20 years of data (2001–2020). A flowchart of the HEC-RAS process is shown on Figure 4.
The hydraulic model geometry was developed from DEMNAS topographic data, from which river cross-sections, bank stations, channel geometry, and floodplain characteristics were extracted. Particular attention was given to the left and right riverbanks because these features influence overbank storage, flood conveyance, and the ability of the channel system to contain high-flow events. Manning’s roughness coefficients were assigned based on land-use characteristics surrounding each watershed, so
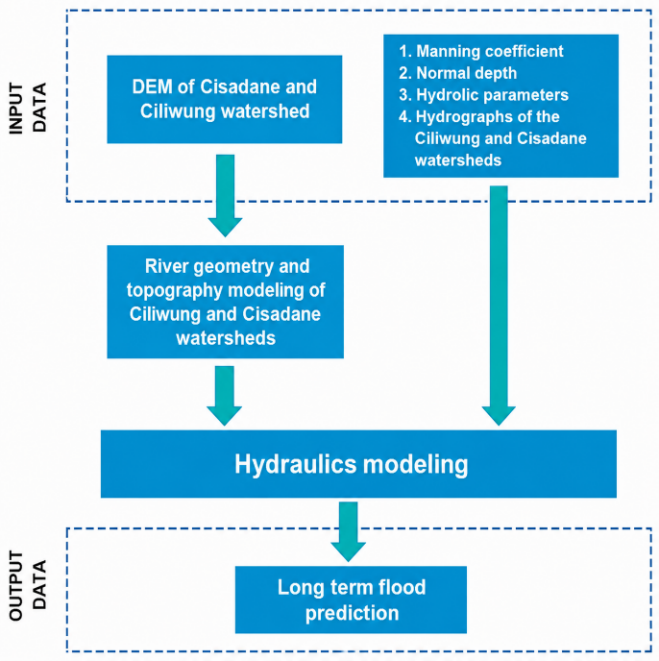
the values varied spatially according to the physical condition of the riverbed, riverbanks, and adjacent floodplain areas rather than being represented by a single uniform coefficient. This land-use-based assignment was used to better reflect differences in hydraulic resistance across urban, vegetated, open-water, and floodplain surfaces.
The unsteady flow simulation was governed by the one-dimensional Saint-Venant equations of mass and momentum. Flow hydrographs were used as upstream boundary conditions, while downstream conditions were defined according to the hydraulic configuration of the modelled reach. The design flood hydrographs were generated using the Nakayasu Synthetic Unit Hydrograph method, which estimates flood discharge based on effective hourly rainfall and watershed characteristics. This method was selected because it provides a practical approach for deriving design flood hydrographs in catchments where continuous discharge observations are limited. The key parameters considered in the Nakayasu hydrograph include time to peak, time lag, time base, catchment area, and main channel length. For the Q100 scenario, the resulting peak discharge was 1,047.63 m³/s for the Ciliwung watershed and 2,172.93 m³/s for the Cisadane watershed, which were then used as hydraulic inputs for the flood hazard simulation.
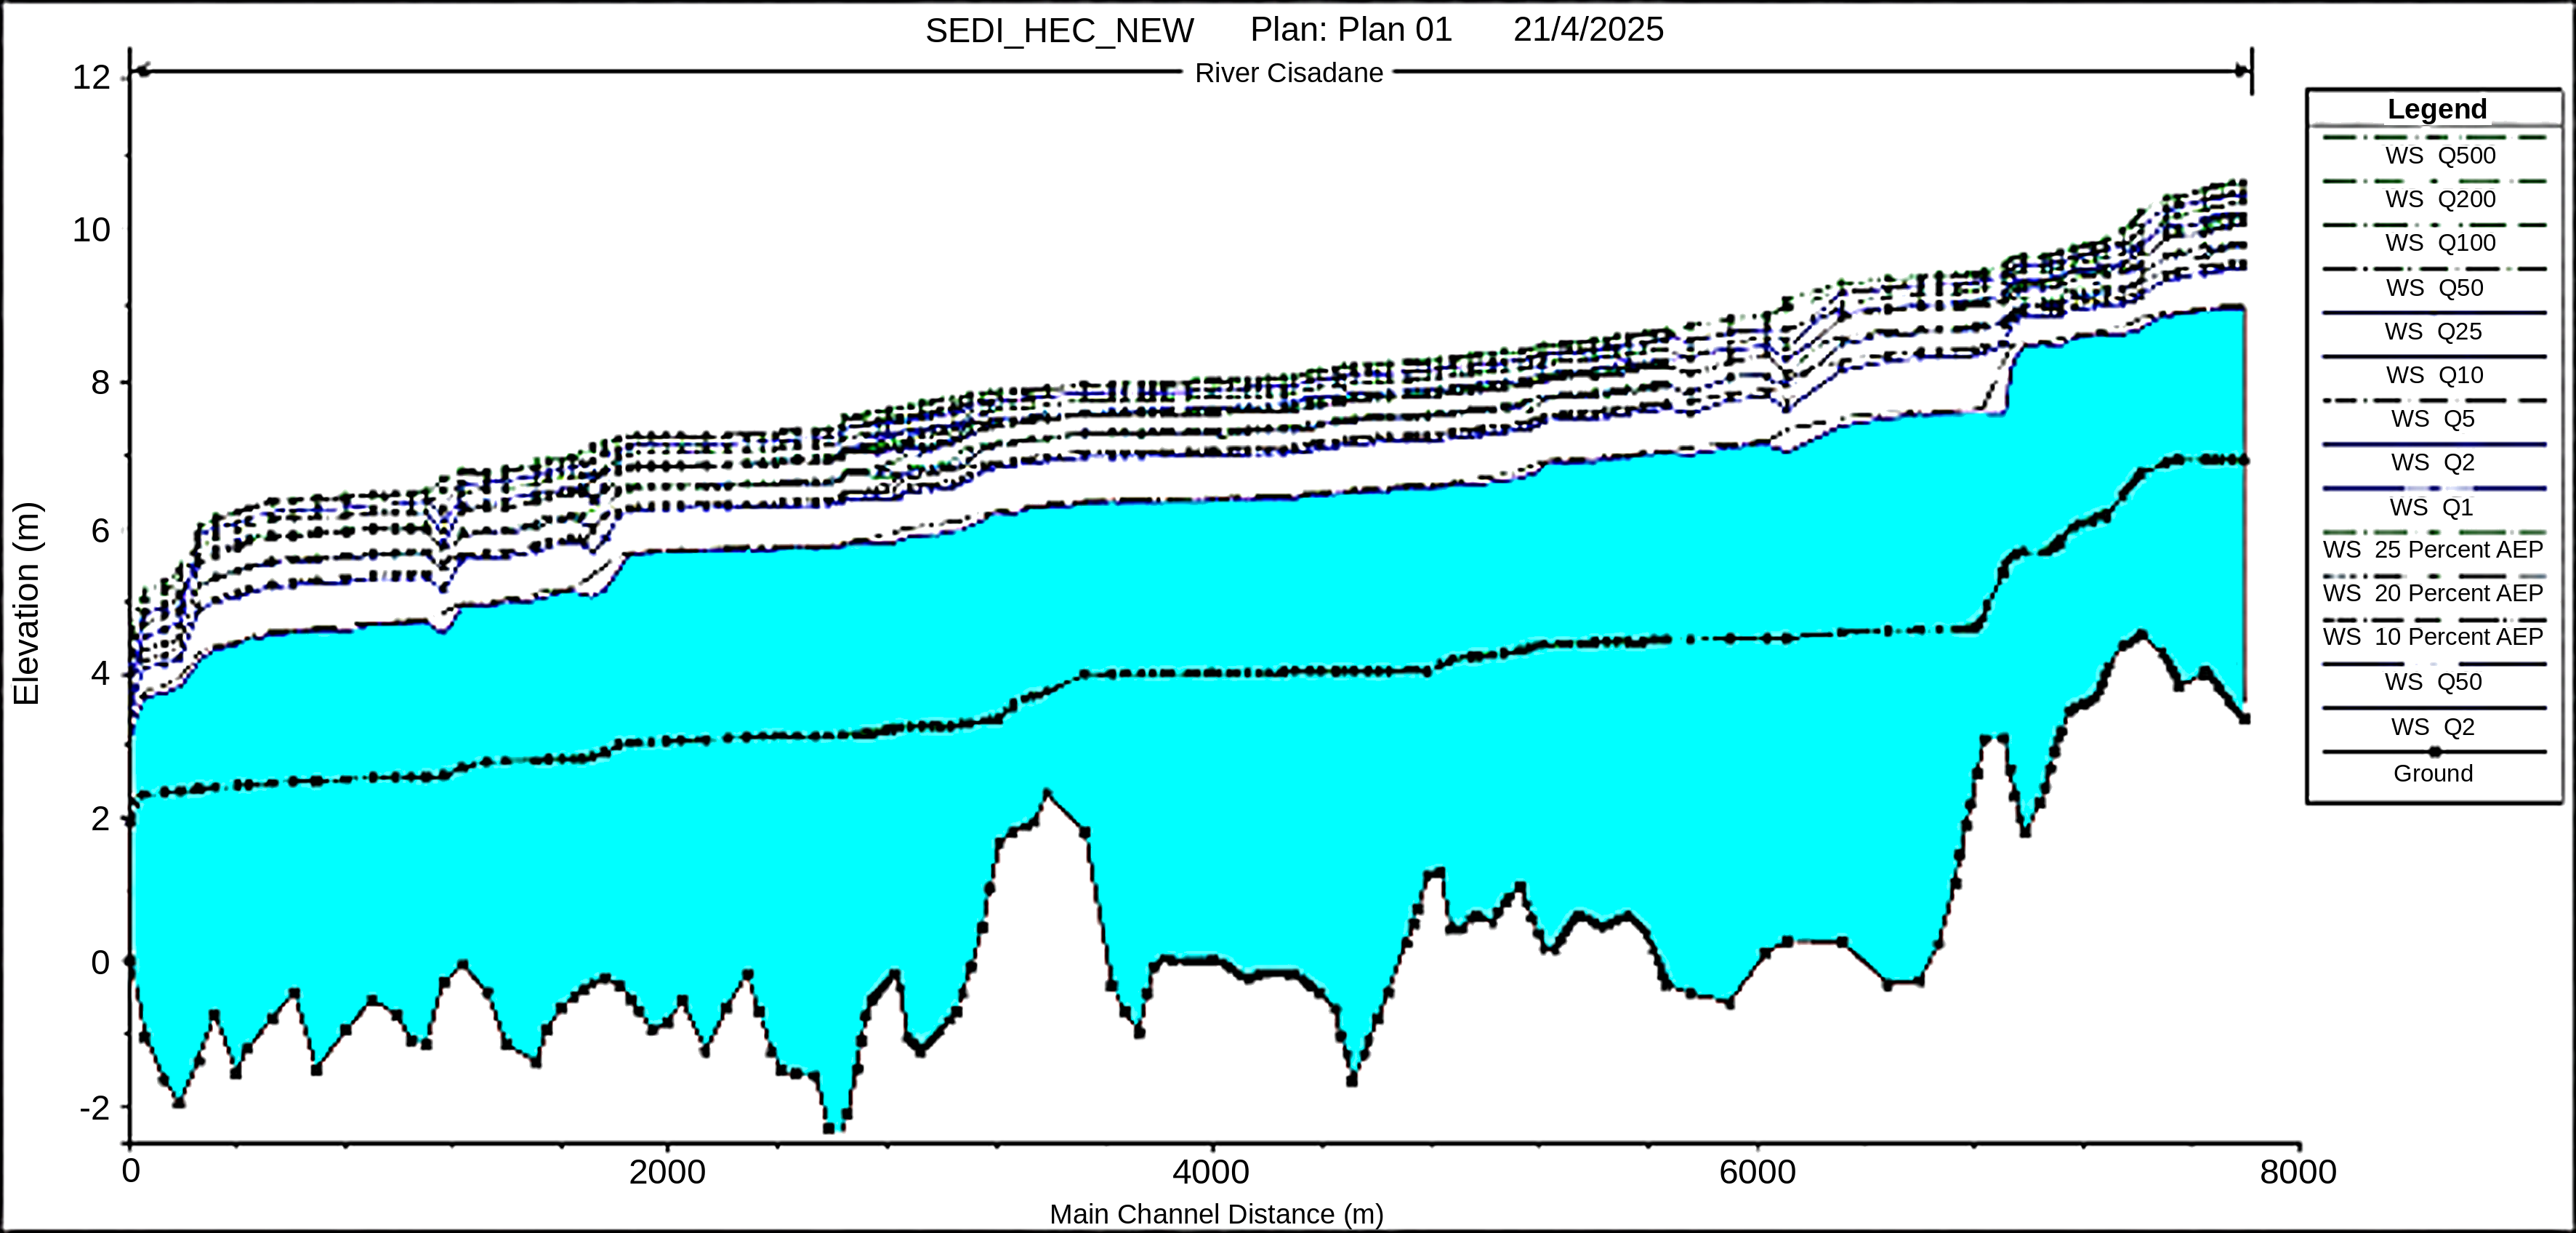
For example, HEC-RAS simulations for the Cisadane River91), as illustrated in Figure 5, demonstrate the model's ability to predict water surface elevations and flood extents under various scenarios.
This study subsequently utilizes HEC-RAS to simulate flood behavior in areas where Nature-based Solutions (NbS), such as wetlands and permeable surfaces, are implemented, in order to assess their effectiveness in reducing flood risks
4. Results and Discussion
The flood discharge simulation was conducted by integrating hydrological analysis, hydraulic modelling, and terrain-based spatial assessment. Twenty years of maximum daily rainfall data from 11 rain gauge stations were first processed using rainfall frequency analysis. Four probability distributions, namely Normal, Lognormal, Log Pearson Type III, and Gumbel, were evaluated through statistical parameter checks and goodness-of-fit tests, after which the Gumbel distribution was selected for design rainfall estimation. The resulting design rainfall values were then transformed into design flood hydrographs for the Ciliwung and Cisadane watersheds using the Nakayasu Synthetic Unit Hydrograph method. Subsequently, the HEC-RAS model was configured under an unsteady flow approach to simulate water-surface elevation, flood depth, and discharge profiles under existing and and the Q100 scenario. The model geometry was derived from DEM-based river cross-sections, while Manning’s roughness coefficients were assigned according to land-use
characteristics across the channel, riverbanks, and floodplain areas. Model validations were performed by comparing observed field hydrographs with HEC-RAS simulated hydrographs using the Nash–Sutcliffe Efficiency (NSE). The NSE evaluates the agreement between observed and simulated discharge patterns, including peak magnitude, timing, and recession behaviour. The model achieved NSE values of 0.78 for the Ciliwung watershed and 0.74 for the Cisadane watershed, indicating satisfactory hydraulic model performance. The slightly lower NSE for Cisadane is likely associated with its longer river system and more heterogeneous land-use composition, which increases variability in runoff response, flow routing, and hydraulic roughness.
The integration of geometric parameters derived from DEM topographical data enables accurate representation of riverbanks for flood modeling. Unsteady flow analysis and subsequent flood assessment yield critical insights into water surface elevations, riverbed profiles, and bank levels. As illustrated in Figure 6, the model highlights the capacity of the Ciliwung and Cisadane river basins to accommodate varying floodwater levels, emphasizing their distinct hydrological behaviors across different regions. In this study, a 100-year return period (Q100) was selected because it represents a widely accepted design standard in hydrological and flood risk studies, especially for critical urban infrastructure. Q100 scenarios are frequently applied in Jakarta’s flood management planning. By simulating Q100, this research provides insight into the upper-bound flood hazard, ensuring that both structural measures (such as polder and pumping systems) and non-structural measures (such as Nature-based Solutions) are evaluated against Jakarta’s most critical flood risks.
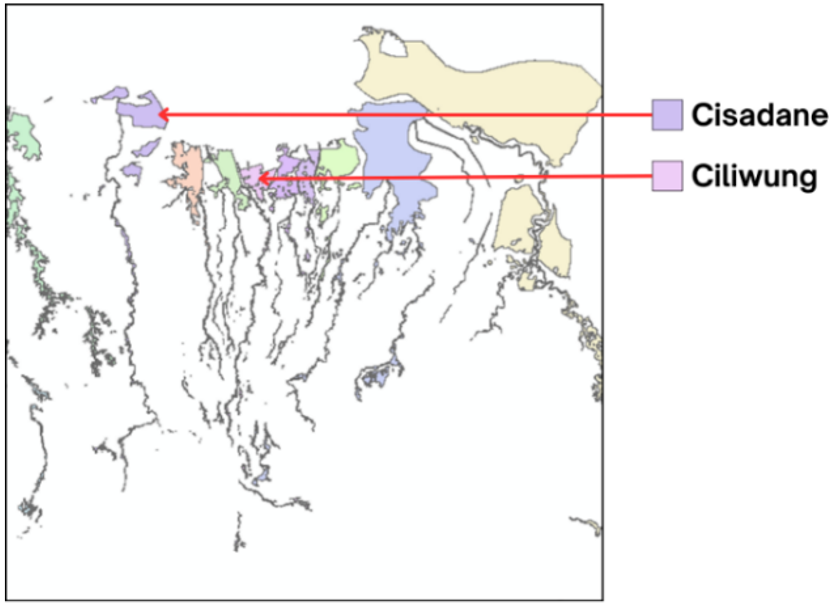
Table 2: Flood Hazard Level Colors
| Level 1 Hazard (Low) | Flood depth < 0.5 meter | |
|---|---|---|
| Level 2 Hazard (Medium) | Flood depth between 0.5 – 1 meter | |
| Level 3 Hazard (High) | Flood depth > 1 meter |
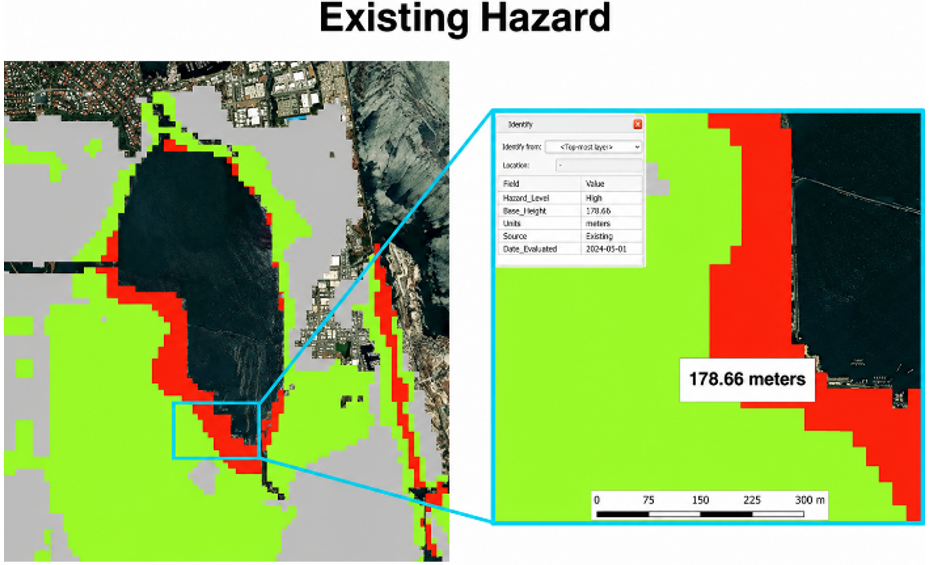
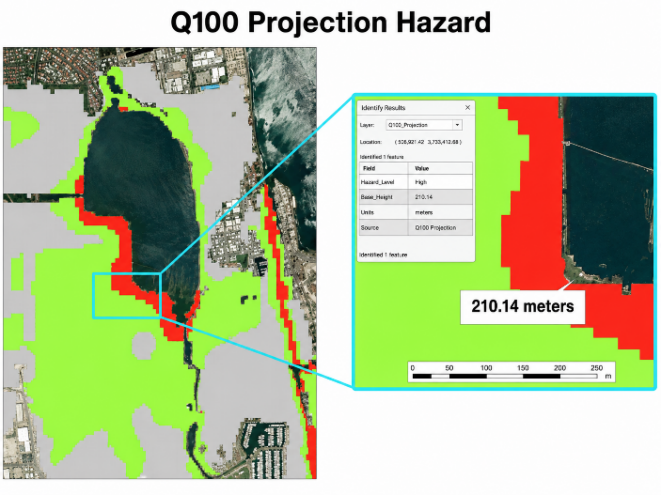
The flood hazard assessment in Jakarta revealed insights when comparing existing hazards to Q100 projection hazards, as shown in Figure 7. The color coding in the hazard assessment maps helps clarify the urgency in conveying the levels of flood risk associated with different areas in Jakarta. In the color coding of the hazard map shown in Table 2, the areas shaded in red indicate the highest level of hazard (level 3), representing significant vulnerability to flooding. Green areas denote a medium hazard level (level 2), reflecting a moderate risk, whereas gray areas indicate the lowest hazard level (level 1).
Figure 7 also shows that there are differences in hazard levels when comparing the existing hazard and the Q100 projection hazard map, which illustrates an increased flood risk, with more regions transitioning to all levels of hazard, particularly around key locations related to the Ciliwung River, which affects areas in the western parts of Jakarta, called Pekojan and Pejagalan. A few examples of the Q100 urban flood risk projection are indicated by yellow circles. This projection emphasizes the urgent need for effective flood management strategies to mitigate risks in these high-hazard zones as the potential for severe flooding escalates significantly.
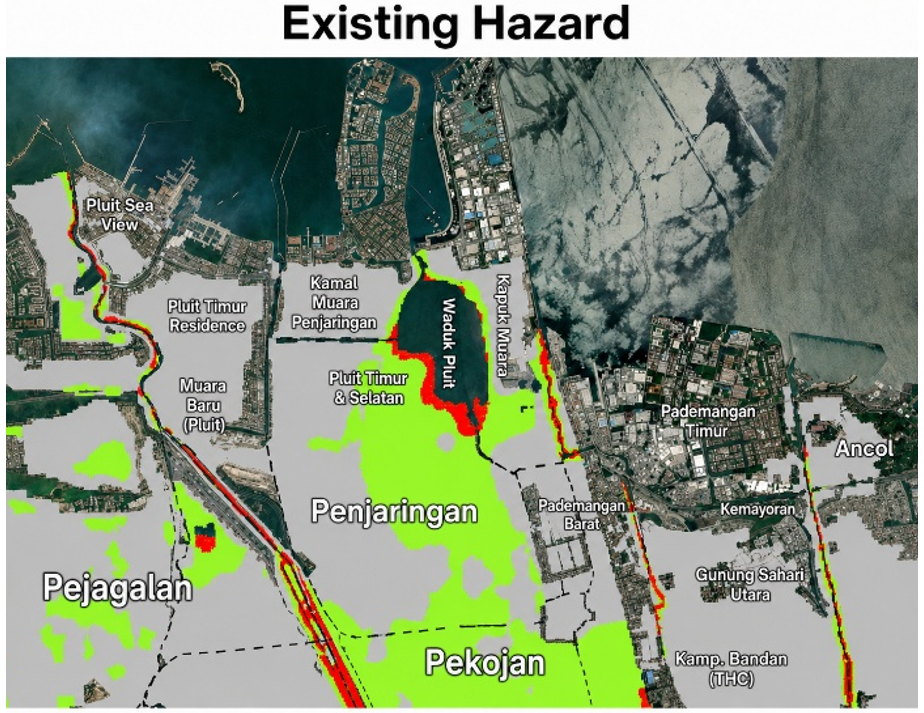
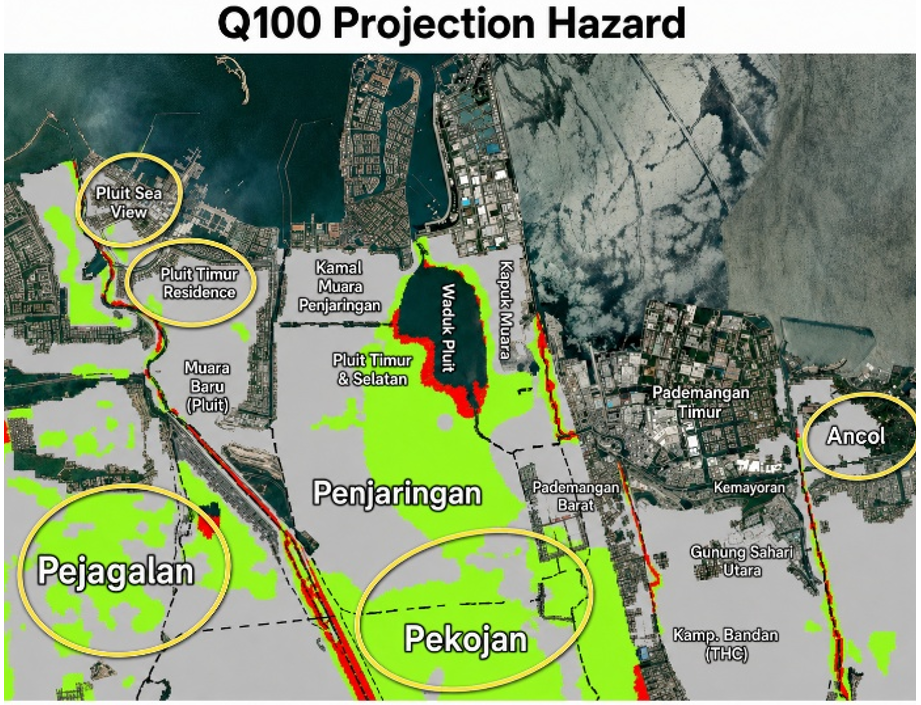
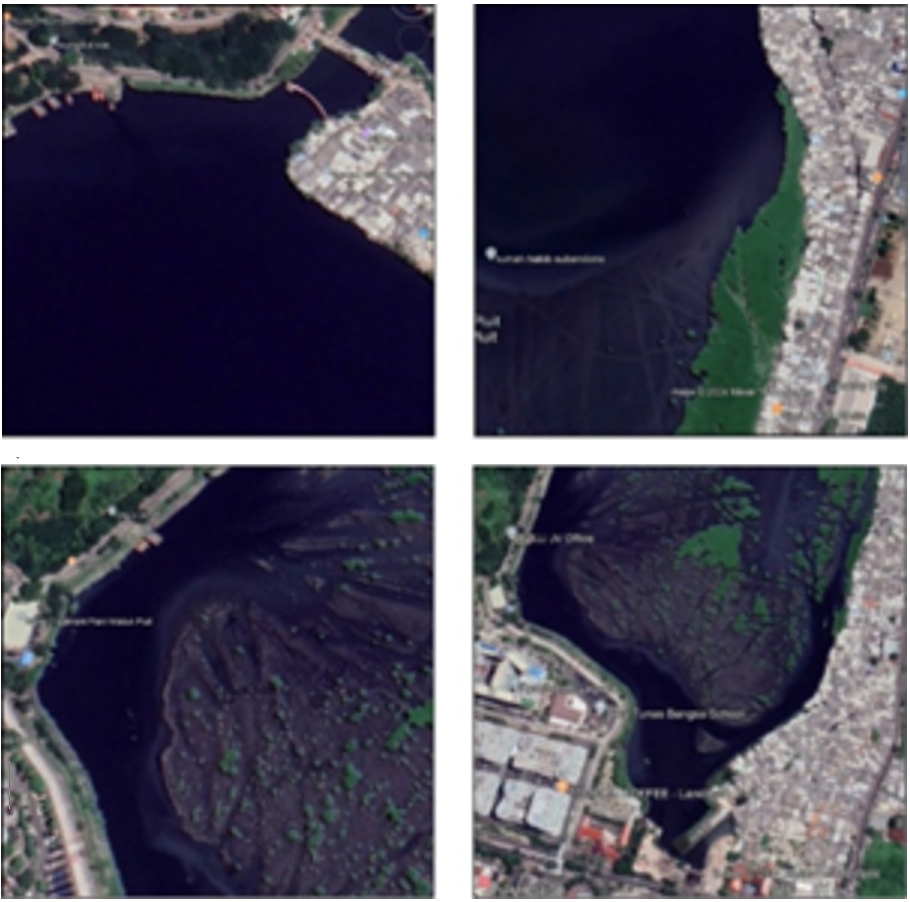
The comparison analysis of existing and Q100 projections reveals an increase in the Level 3 hazard area at Waduk Pluit (Pluit Reservoir) in Northern Jakarta. The satellite imagery in Figure 8 visually highlights the current state of the reservoir and the areas vulnerable to flooding. The reservoir has a total area of 80 ha, originally consisting of green open space but is now surrounded by various developments. Currently, approximately 20 ha of the area around the Pluit Reservoir has been restored to open space, with five hectares designated as parks92). This imagery is vital for understanding hazard projections and monitoring water-level changes, particularly in areas with rising hazard levels.
Pluit Reservoir spans a total area of 80 hectares, The reservoir has a depth of ±2 to 6 m and can still accommodate ±17-million-meters³ of water volume from one of the DAS analyzed, the Ciliwung, and Cideng and Angke Rivers. The water level in Pluit Reservoir fluctuates, with a normal level of around ±1.4 to 1.5 meters, but during the dry season, it drops by approximately ±90 centimeters below the normal level. Under the Q100 scenario, the current hazard length of Pluit Reservoir, approximately ±178.66 meters, is projected to increase to around ±210.14 meters, marking a significant expansion of ±31.48 meters in the Level 3 flood hazard zone. This change, illustrated in Figure 9, reflects a substantial increase in flood vulnerability over the next 100 years. Although the expansion is horizontal, it implies a surface water level rise of approximately 1.0 meters. Given the reservoir’s area of 80 hectares, this rise corresponds to an additional 800,000 m³ of water, increasing the total volume from around 17 million m³ to approximately 17.8 million m³.
A first-order sensitivity assessment shows that each 0.1 m change in projected water level corresponds to approximately 80,000 m³ of storage-volume variation.
Thus, a ±0.1–0.2 m uncertainty in water level would result in an estimated ±80,000–160,000 m³ variation in floodwater volume.
This uncertainty may be influenced by rainfall frequency estimation, synthetic hydrograph generation, Manning’s roughness coefficients, terrain and bathymetric representation, and hydraulic boundary conditions. Therefore, the projected 800,000 m³ increase should be interpreted as a scenario-based estimate rather than a deterministic value, while still indicating a substantial increase in flood hazard potential at Pluit Reservoir.
4.1. Nature-Based Solutions (NbS) Using Floating Wetlands and Cattails
Floating wetlands are an innovative form of Nature-Based Solution (NbS) aimed at enhancing urban flood resilience while simultaneously improving water quality and ecological health. These systems are designed to absorb excess water and slow its flow, helping to reduce peak discharge during heavy rainfall and contributing to localized flood mitigation. An illustration of floating wetlands and their components, which are also used in the southern part of the globe Queensland, Australia93), is shown in Figure 10(a). Floating wetlands are artificial platforms designed to support the growth of emergent aquatic plants in water, which are usually too deep for their
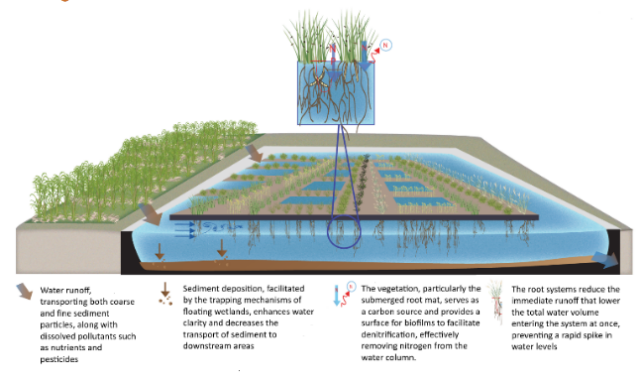
natural establishment. This platform fosters a unique ecosystem capable of capturing excess nutrients and transforming common pollutants into harmless byproducts, thereby significantly enhancing the quality of aquatic environments75).
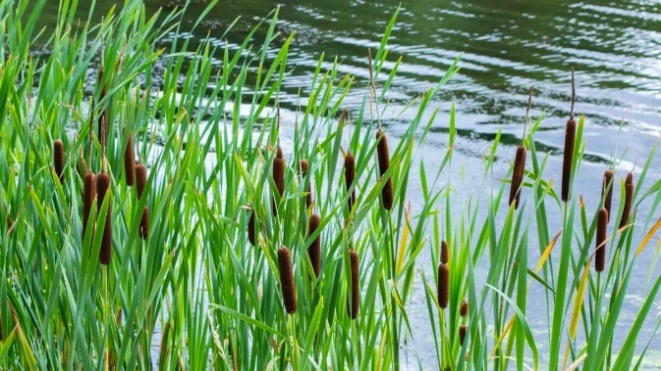
Constructed from buoyant platforms, these wetlands support the growth of aquatic vegetation such as cattails (Typha latifolia), which are well-known for their adaptability and phytoremediation capabilities. Cattails have notable water absorption capacity, as shown in Figure 10(b). Its fibers can absorb approximately 72.30% of water, with the top and bottom parts of the leaf absorbing 79.79% and 66.63%, respectively. This high absorption efficiency makes cattails highly effective for moisture management in various applications94). When used in floating wetlands, cattails have proven effective in reducing flood impacts by storing excess water during periods of heavy rainfall. In countries such as India, cattail plants can absorb 1–2 liters of water per day and are known to remove excess nutrients like nitrogen and phosphorus, making them valuable for water purification while also supporting wetland biodiversity95).
Floating wetlands can store 1 to 3 million gallons of water per acre during heavy rainfall, reducing downstream water volume by 30–50%, depending on their size and type. This not only mitigates flooding but also stabilizes water levels, supporting both terrestrial and aquatic ecosystems95). Additionally, floating wetlands remove nutrients, metals, and organic matter through plant–microbe interactions96), perform best with suitable plant selection, aeration, and harvesting97), and depend on design factors such as water depth, retention time, and surface coverage98), making them a versatile nature-based solution. Beyond flood control, harvesting cattails in reservoirs like Pelly's Lake (Canada) is simulated to yield 1,550 tonnes of biomass, removing 4.65 tonnes of nitrogen and 1.55 tonnes of phosphorus100), while generating carbon offsets for potential carbon credit revenue (about 1.05 t CO₂ per tonne of biomass99)), and harvesting in the Northern Great Plains also removes excess cattail and runoff nutrients101). These combined environmental and economic benefits highlight the value of cattails in sustainable flood management.
As a Nature-based Solution (NbS) for flood management within the Pluit Polder System, floating wetlands planted with cattails are technically feasible and compatible with existing infrastructure. The Pluit Reservoir functions as the primary retention basin in the system, making it suitable for the deployment of floating wetlands without requiring land acquisition or major structural modification. Covering 5–10% of the reservoir surface (approximately 40,000–80,000 m²), these wetlands may only retain around 0.6% of floodwater during a Q100 event. This indicates that floating wetlands cannot replace pumping infrastructure, reservoir storage, or structural flood defenses. Their role is therefore better understood as complementary, supporting localized flow attenuation, nutrient reduction, water-quality improvement, biodiversity enhancement, and ecological resilience. Since this study does not directly simulate the effect of floating wetlands on flood hydrograph, their impact on peak discharge reduction and flood-volume attenuation should be interpreted cautiously.
In addition to their limited direct storage contribution, floating wetlands may provide ecological and water-quality benefits within the Pluit Polder System. Their potential functions include nutrient removal, reduction of eutrophication risk, biodiversity support, and improvement of the reservoir’s long-term ecological condition. However, because this study does not explicitly simulate the effect of floating wetlands on flood hydrograph, their contribution to peak discharge reduction, flood-volume attenuation, or delay time cannot be quantified at this stage. Therefore, the NbS component should be interpreted as a complementary feasibility and co-benefit assessment rather than as a direct hydrological performance result. Therefore, while NbS cannot replace structural defenses in managing Q100 floods, they work effectively as an integrated measure within the Pluit Polder System, providing continuous ecological services and supporting adaptive urban flood management in combination with existing grey infrastructure.
From a policy and design perspective, the findings suggest that Jakarta’s flood-risk management should shift from conventional infrastructure expansion toward an integrated resilience framework combining polder operation, reservoir capacity maintenance, sedimentation control, and technically feasible ecological interventions. The sensitivity of floodwater volume estimates to small changes in projected water level highlights the need for uncertainty-aware planning under rainfall extremes, hydrograph variability, land-use change, and reservoir-level fluctuation. Within this framework, NbS should be positioned as a complementary measure that offers ecological and operational co-benefits, rather than as a fully quantified hydrograph-based flood-control intervention, since its effects on peak discharge, delay time, and flood-volume attenuation were not explicitly modelled. Nevertheless, this study provides a practical basis for linking scenario-based flood hazard mapping with adaptive, spatially targeted, and ecologically enhanced flood-risk reduction strategies in Jakarta.
5. Conclusion
This study set out to (1) improve flood prediction and vulnerability mapping, (2) assess extreme hazard scenarios under a 100-year return period (Q100), and (3) evaluate the potential of Nature-based Solutions (NbS) for Jakarta’s flood management. By integrating the Geomorphic Flood Area (GFA) tool, HEC-RAS hydraulic modeling, and GIS-based visualization, the research produced detailed hazard maps for the Ciliwung and Cisadane watersheds. The results demonstrated a substantial increase in flood risk under Q100 projections, particularly around the Pluit Reservoir, where surface water levels are projected to rise by approximately 1 meter, corresponding to an additional 800,000 m³ of floodwater, as well as in rapidly urbanizing zones like Pekojan, Pejagalan, and Ancol. This finding indicates that relatively small changes in projected reservoir water level can generate substantial changes in floodwater volume, highlighting the importance of uncertainty-aware and scenario-based flood assessment in Jakarta’s polder-dependent urban environment.
The main scientific contribution of this study lies in linking rapid geomorphic flood-prone area identification, HEC-RAS hydraulic simulation, and GIS-based hazard visualization within a single framework. This integration provides a basis for assessing flood hazard patterns in highly urbanized coastal catchments affected by rainfall extremes, land-use change, drainage constraints, and polder infrastructure dependence. The NbS assessment further shows that floating wetlands planted with Typha latifolia should be interpreted as a complementary feasibility and co-benefit measure rather than as a direct hydrograph-based flood-control intervention. Their short-term storage contribution during Q100 events is limited, and their effects on peak discharge, delay time, and flood-volume attenuation were not explicitly modelled. Future work should incorporate observed discharge, water-level, and inundation data for formal validation, as well as coupled hydrological–hydraulic modelling to quantify the direct hydrological performance of NbS under different rainfall and polder-operation scenarios.
Acknowledgements
The authors would like to thank the GeoEco-AI Research Interest Group (RIG) of Binus University for their invaluable support and for providing the facilities that made this research possible.
Author Contribution
A.A.S.G: Project administration, Validation, Supervision, Methodology, Writing – review & editing, Resources. E.I: Conceptualization, Writing – original draft, Investigation, Methodology, Formal analysis, Data curation. G.A.T and J.J.T: Conceptualization, Writing – review & editing, Investigation, Resources. J.J and Y.W: Investigation, Methodology, Resources.
While preparing this work, the authors used ChatGPT to improve the quality of the article writing. After utilizing this tool, the authors reviewed and edited the publication's content as needed, taking full responsibility for it.
Data Availability
This research uses spatial data from the Jakarta Satu geoportal (https://jakartasatu.jakarta.go.id/geoportal) and publicly available Sentinel-2 Level-2A (L2A) satellite imagery, accessed through Google Earth Engine, to obtain high-resolution spatial information.
References
- A.A. Beshir, and J. Song, “Urbanization and its impact on flood hazard: the case of addis ababa, ethiopia,” Nat. Hazards, 109 (1) 1167–1190 (2021). doi:10.1007/s11069-021-04873-9.
- S. Ertan, and R.N. Çelik, “The assessment of urbanization effect and sustainable drainage solutions on flood hazard by gis,” Sustain., 13 (4) 1–19 (2021). doi:10.3390/su13042293.
- W. Liu, X. Zhang, Q. Feng, T. Yu, and B.A. Engel, “Analyzing the impacts of topographic factors and land cover characteristics on waterlogging events in urban functional zones.,” Sci. Total Environ., 904 166669 (2023). doi:10.1016/j.scitotenv.2023.166669.
- H.D. Nguyen, D. Fox, D.K. Dang, L.T. Pham, Q.V. Viet Du, T.H.T. Nguyen, T.N. Dang, V.T. Tran, P.L. Vu, Q.H. Nguyen, T.G. Nguyen, Q.T. Bui, and A.I. Petrisor, “Predicting future urban flood risk using land change and hydraulic modeling in a river watershed in the central province of vietnam,” Remote Sens., 13 (2) 1–24 (2021). doi:10.3390/rs13020262.
- W.G. Bennett, H. Karunarathna, Y. Xuan, M.S.B. Kusuma, M. Farid, A.A. Kuntoro, H.P. Rahayu, B. Kombaitan, D. Septiadi, and T.N.A. Kesuma, “Modelling compound flooding: a case study from jakarta, indonesia,” Nat. Hazards, 118 (1) 277–305 (2023). doi:10.1007/s11069-023-06001-1.
- T.A. Kurniawan, C. Meidiana, H.H. Goh, D. Zhang, M. Jiang, M.H.D. Othman, A. Anouzla, F. Aziz, M. Mahmoud, and M.I. Khan, “Social dimensions of climate‐induced flooding in jakarta (indonesia): the role of non‐point source pollution,” Water Environ. Res., 96 (9) e11129 (2024). doi:10.1002/wer.11129.
- A.M. Prana, A. Curl, M.R. Dionisio, C. Gomez, D. Hart, H. Apriyanto, and H. Prasetya, “Urban planning approaches to support community-based flood adaptation in north jakarta kampungs,” Disaster Prev. Manag. An Int. J., 33 (4) 383–405 (2024). doi:10.1108/DPM-05-2023-0114.
- B.A. Priyambodoho, S. Kure, N.F. Januriyadi, M. Farid, A.C.G. Varquez, M. Kanda, and S. Kazama, “Effects of urban development on regional climate change and flood inundation in jakarta, indonesia,” J. Disaster Res., 17 (4) 516–525 (2022). doi:10.20965/jdr.2022.p0516.
- P. Kiparisov, V. Lagutov, and G. Pflug, “Quantification of loss of access to critical services during floods in greater jakarta: integrating social, geospatial, and network perspectives,” Remote Sens., 15 (21) 5250 (2023). doi:10.3390/rs15215250.
- D.P. Ong, D.E. Adrian, J.C. Andrew, and A.A.S. Gunawan, “Flood Analysis of Jakarta to Support Mitigation Efforts,” in: 2025 Int. Conf. Informatics, Multimedia, Cyber Inf. Syst., IEEE, 2025: pp. 826–831. doi:10.1109/icimcis68501.2025.11327117.
- B. Pranoto, H. Soekarno, E. Hartulistiyoso, M.N. Aidi, D. Sutrisno, D. Pohan, Radhika, B. Sutejo, A.H. Kuncoro, and I. Nahib, “Integrating flood early warning system (fews) for optimizing small hydropower sites: a west java case study,” Evergreen, 11 (3) 2691–2699 (2024). doi:10.5109/7236908.
- O. Calvo-Solano, and A. Quesada-Román, “Worldwide research trends and networks on flood early warning systems,” GeoHazards, 5 (3) 582–595 (2024). doi:10.3390/geohazards5030030.
- N. Byaruhanga, D. Kibirige, S. Gokool, and G. Mkhonta, “Evolution of flood prediction and forecasting models for flood early warning systems: a scoping review,” Water, 16 (13) 1763 (2024). doi:10.3390/w16131763.
- M.J.H. Salgado, L. Alfonso, and J.J.V. Upegui, “Towards integrating community and institutional flood early warning systems: a framework applied to an andean tropical case,” Int. J. Disaster Risk Reduct., 116 105126 (2025). doi:10.1016/j.ijdrr.2024.105126.
- M.J. Henao Salgado, and J. Zambrano Nájera, “Assessing flood early warning systems for flash floods,” Front. Clim., 4 787042 (2022). doi:10.3389/fclim.2022.787042.
- M. Avand, A. Kuriqi, M. Khazaei, and O. Ghorbanzadeh, “DEM resolution effects on machine learning performance for flood probability mapping,” J. Hydro-Environment Res., 40 1–16 (2022). doi:10.1016/j.jher.2021.10.002.
- R. Bentivoglio, E. Isufi, S.N. Jonkman, and R. Taormina, “Deep learning methods for flood mapping: a review of existing applications and future research directions,” Hydrol. Earth Syst. Sci., 26 (16) 4345–4378 (2022). doi:10.5194/hess-26-4345-2022.
- H. Shahabi, A. Shirzadi, K. Ghaderi, E. Omidvar, N. Al-Ansari, J.J. Clague, M. Geertsema, K. Khosravi, A. Amini, S. Bahrami, O. Rahmati, K. Habibi, A. Mohammadi, H. Nguyen, A.M. Melesse, B.B. Ahmad, and A. Ahmad, “Flood detection and susceptibility mapping using sentinel-1 remote sensing data and a machine learning approach: hybrid intelligence of bagging ensemble based on k-nearest neighbor classifier,” Remote Sens., 12 (2) (2020). doi:10.3390/rs12020266.
- H.S. Munawar, A.W.A. Hammad, and S.T. Waller, “A review on flood management technologies related to image processing and machine learning,” Autom. Constr., 132 103916 (2021). doi:10.1016/j.autcon.2021.103916.
- U. Iqbal, P. Perez, W. Li, and J. Barthelemy, “How computer vision can facilitate flood management: a systematic review,” Int. J. Disaster Risk Reduct., 53 102030 (2021). doi:10.1016/j.ijdrr.2020.102030.
- Z. Liu, N. Coleman, F.I. Patrascu, K. Yin, X. Li, and A. Mostafavi, “Artificial intelligence for flood risk management: a comprehensive state-of-the-art review and future directions,” Int. J. Disaster Risk Reduct., 117 105110 (2025). doi:10.1016/j.ijdrr.2024.105110.
- N. Nimbarte, T. Gedam, B. Masram, A. Tiwari, and S. Balamwar, “Flood Risk Analysis through Computer Vision and Geometric Correction Approach,” in: 2024 Int. Conf. Comput. Intell. Comput. Appl., IEEE, 2024: pp. 259–262. doi:10.1109/ICCICA60014.2024.10584915.
- F.E. Fernandes Jr, L.G. Nonato, and J. Ueyama, “A river flooding detection system based on deep learning and computer vision,” Multimed. Tools Appl., 81 (28) 40231–40251 (2022). doi:10.1007/s11042-022-12813-3.
- A.-L. Balogun, T.Y. Sheng, M.H. Sallehuddin, Y.A. Aina, U.L. Dano, B. Pradhan, S. Yekeen, and A. Tella, “Assessment of data mining, multi-criteria decision making and fuzzy-computing techniques for spatial flood susceptibility mapping: a comparative study,” Geocarto Int., 37 (26) 12989–13015 (2022). doi:10.1080/10106049.2022.2076910.
- N. Beden, and A. Ulke Keskin, “Flood map production and evaluation of flood risks in situations of insufficient flow data,” Nat. Hazards, 105 (3) 2381–2408 (2021). doi:10.1007/s11069-020-04404-y.
- J. Liu, H.-S. Cho, S. Osman, H.-G. Jeong, and K. Lee, “Review of the status of urban flood monitoring and forecasting in tc region,” Trop. Cyclone Res. Rev., 11 (2) 103–119 (2022). doi:10.1016/j.tcrr.2022.07.001.
- P. Tripathy, and T. Malladi, “Global flood mapper: a novel google earth engine application for rapid flood mapping using sentinel-1 sar,” Nat. Hazards, 114 (2) 1341–1363 (2022). doi:10.1007/s11069-022-05428-2.
- M. Hansen, J. Vejby, and J. Koch, “Flood mapping using Sentinel-1 imagery with topographical and hydrological contextualization: case study from Ribe, Denmark,” Int. J. Appl. Earth Obs. Geoinf., 143, 104816 (2025). doi:10.1016/j.jag.2025.104816.
- Q. Chen, X. Karagiannis, and S.M. Mudd, “Detecting floods from cloudy scenes : a fusion approach using sentinel-1 and sentinel-2 imagery,” in: NeurIPS 2022 Workshop on Tackling Climate Change with Machine Learning, Climate Change AI, 1–7 (2022).
- Z. Zandsalimi, S. Feizabadi, J. Yazdi, and S.A.A. Salehi Neyshabouri, “Evaluating the impact of digital elevation models on urban flood modeling: a comprehensive analysis of flood inundation, hazard mapping, and damage estimation,” Water Resour. Manag., 38 (11) 4243–4268 (2024). doi:10.1007/s11269-024-03862-4.
- S. Puttinaovarat, and P. Horkaew, “Flood forecasting system based on integrated big and crowdsource data by using machine learning techniques,” IEEE Access, 8 5885–5905 (2020). doi:10.1109/ACCESS.2019.2963819.
- S. Sankaranarayanan, M. Prabhakar, S. Satish, P. Jain, A. Ramprasad, and A. Krishnan, “Flood prediction based on weather parameters using deep learning,” J. Water Clim. Chang., 11 (4) 1766–1783 (2019). doi:10.2166/wcc.2019.321.
- K.T. Antwi-Agyakwa, M.K. Afenyo, and D.B. Angnuureng, “Know to predict, forecast to warn: a review of flood risk prediction tools,” Water, 15 (3) (2023). doi:10.3390/w15030427.
- H. Kausarian, J.T.S. Sumantyo, Batara, A. Suryadi, and T. Pangestu, “SAR sentinel data analysis: hydrological dynamics and rainfall patterns in the kampar river basin (2018-2023),” Evergreen, 11 (3) 1558–1567 (2024). doi:10.5109/7236811.
- E. Hidayah, Juliastuti, Azmeri, H. Herawati, S. Suroso, S. Wahyuni, and A.A.S. Gunawan, “A Hybrid Novel Ensemble of Prediction Indices for GIS-Based Flood Susceptibility Zonation,” in: Prog. Multicriteria Decis. Mak. Model. A New Paradig. to Monit. Hazards, Springer, 2025: pp. 411–431. doi:10.1007/978-3-031-89246-2_17.
- İ.B. Peker, S. Gülbaz, V. Demir, O. Orhan, and N. Beden, “Integration of hec-ras and hec-hms with gis in flood modeling and flood hazard mapping,” Sustainability, 16 (3) (2024). doi:10.3390/su16031226.
- H. Farhadi, A. Esmaeily, and M. Najafzadeh, “Flood monitoring by integration of remote sensing technique and multi-criteria decision making method,” Comput. Geosci., 160 105045 (2022). doi:10.1016/j.cageo.2022.105045.
- F. Taromideh, R. Fazloula, B. Choubin, A. Emadi, and R. Berndtsson, “Urban flood-risk assessment: integration of decision-making and machine learning,” Sustainability, 14 (8) 4483 (2022). doi:10.3390/su14084483.
- M. Saber, T. Boulmaiz, M. Guermoui, K.I. Abdrabo, S.A. Kantoush, T. Sumi, H. Boutaghane, T. Hori, D. Van Binh, and B.Q. Nguyen, “Enhancing flood risk assessment through integration of ensemble learning approaches and physical-based hydrological modeling,” Geomatics, Nat. Hazards Risk, 14 (1) 2203798 (2023). doi:10.1080/19475705.2023.2203798.
- S. Askar, S. Zeraat Peyma, M.M. Yousef, N.A. Prodanova, I. Muda, M. Elsahabi, and J. Hatamiafkoueieh, “Flood susceptibility mapping using remote sensing and integration of decision table classifier and metaheuristic algorithms,” Water, 14 (19) 3062 (2022). doi:10.3390/w14193062.
- Y. Wijayanti, A.A.S. Gunawan, E. Irwansyah, and S. Wulandari, “Nature-based solutions for flood mitigation in metropolitan areas,” Eng. Technol. Appl. Sci. Res., 14 (6) 18896–18901 (2024). doi:10.48084/etasr.9070.
- P. Asare, F. Atun, and K. Pfeffer, “Nature-based solutions (nbs) in spatial planning for urban flood mitigation: the perspective of flood management experts in accra,” Land Use Policy, 133 106865 (2023). doi:10.1016/j.landusepol.2023.106865.
- H.S. Bin Rosmadi, M.F. Ahmed, M. Bin Mokhtar, B. Halder, and M. Scholz, “Nature-based solutions (nbs) for flood management in malaysia,” Water, 16 (24) 3606 (2024). doi:10.3390/w16243606.
- I. Mustofa, Perdinan, R.F. Adi, R.E.T. Prabowo, S.D. Pratiwi, S. Aprilia, and S.C. Janna, “Nature-Based Solutions (NbS) for Sustainable Riverine Systems: Case Study Bengawan Solo Watershed, Indonesia,” in: Int. Conf. Radioscience, Equatorial Atmos. Sci. Environ., Springer, 2023: pp. 833–847. doi:10.1007/978-981-97-0740-9_74.
- E.M. Bernhardt, S. Zandaryaa, G. Arduino, B. Jiménez Cisneros, J. Payne, S.M. Zadeh, M. McClain, K. Irvine, M.C. Acreman, and C. Cudennec, “NBS [nature-based solutions] for managing water quality,” in: WWAP (United Nations World Water Assessment Programme)/UN-Water, The United Nations World Water Development Report 2018: Nature-Based Solutions for Water, UNESCO, Paris, France (2018).
- E. Heneghan, M. Collier, and M. Kelly-Quinn, “An evaluation of the potential applications of nature-based solutions for water quality protection: Ireland as a case study,” Biol. Environ. Proc. R. Irish Acad., Royal Irish Academy , 121B (3) 147–162 (2021) doi:10.3318/BIOE.2021.14.
- F.K. Geronimo, H. Guerra, M. Jeon, N.J. Reyes, and L.-H. Kim, “Influence of bacterial community to the water quality performance of urban stormwater nature-based solutions,” Ecol. Eng., 183 106761 (2022). doi:10.1016/j.ecoleng.2022.106761.
- C.S.S. Ferreira, K. Potočki, M. Kapović-Solomun, and Z. Kalantari, “Nature-Based Solutions for Flood Mitigation and Resilience in Urban Areas BT - Nature-Based Solutions for Flood Mitigation: Environmental and Socio-Economic Aspects,” in: C.S.S. Ferreira, Z. Kalantari, T. Hartmann, P. Pereira (Eds.), Springer International Publishing, Cham, 2022: pp. 59–78. doi:10.1007/698_2021_758.
- B. Denjean, M.A. Altamirano, N. Graveline, R. Giordano, P. Van der Keur, D. Moncoulon, J. Weinberg, M.M. Costa, Z. Kozinc, and M. Mulligan, “Natural assurance scheme: a level playing field framework for green-grey infrastructure development,” Environ. Res., 159 24–38 (2017). doi:10.1016/j.envres.2017.07.006.
- L. Nilsson, N. Cárdenas, F. Kirimi, S. Ohler, and J. Mulligan, “Costing of nature-based and grey solutions for water management: case studies in Nairobi,” Proc. Inst. Civ. Eng. Eng., Emerald Publishing Limited, 177 (6) 30–42 (2024). doi:10.1680/jcien.24.00963.
- C.C. Anderson, F.G. Renaud, S. Hanscomb, and A. Gonzalez-Ollauri, “Green, hybrid, or grey disaster risk reduction measures: what shapes public preferences for nature-based solutions?,” J. Environ. Manage., 310 114727 (2022). doi:10.1016/j.jenvman.2022.114727.
- U.A.C. of Engineers, “Hydrologic modeling system technical reference manual,” Hydrol. Model. Syst. HEC-HMS Tech. Ref. Man., (March) 148 (2000).
- T. Wijaya, and Y. Wijayanti, “Flood mapping using hec-ras and hec-hms: a case study of upper citarum river at dayeuhkolot district, bandung regency, west java,” IOP Conf. Ser. Earth Environ. Sci., 1324 (1) 12103 (2024). doi:10.1088/1755-1315/1324/1/012103.
- F. Susilo, “Relocation of residents on the banks of the pluit reservoir and its impact on the level of community vulnerability,” Information, Commun. Disaster, 1 (2) 94–102 (2024). doi:10.61511/icd.v1i2.2024.1945.
- H.M.D.M. Putti, O. Shalih, and A.N.R. Mardiah, “Risk perception and community adaptation on the coastal slums area in facing rob flood (case study pluit, north jakarta coastal),” Int. J. Disaster Dev. Interface, 2 (2) 265–274 (2022). doi:10.53824/ijddi.v2i2.22.
- G. Nurrahmi, and H. Fitri, “The Role of Stakeholders in Flood Disaster Adaptation and Mitigation: A Study in Penjaringan, North Jakarta,” in: 9th Int. Conf. Strateg. Glob. Stud. 2025 ((ICSGS 2025), Atlantis Press, 2025: pp. 519–529. doi:10.2991/978-94-6463-918-6_34.
- B.K. Lubangaol, A.P. Irawan, and W.A. Pranoto, “Study of integrated systems pumps in coast of dki jakarta,” IJEBD (International J. Entrep. Bus. Dev., 5 (3) 420–429 (2022). doi:10.29138/ijebd.v5i3.1800.
- C. Samela, R. Albano, A. Sole, and S. Manfreda, “A gis tool for cost-effective delineation of flood-prone areas,” Comput. Environ. Urban Syst., 70 43–52 (2018). doi:10.1016/j.compenvurbsys.2018.01.013.
- K. Oubennaceur, K. Chokmani, A. El Alem, and Y. Gauthier, “Flood risk communication using arcgis storymaps,” Hydrology, 8 (4) (2021). doi:10.3390/hydrology8040152.
- ESRI, “Architecting the arcgis system: best practices,” Esri White Pap., (May) 27 (2023). https://www.esri.com/~/media/Files/Pdfs/products/arcgis-platform/architecting-the-arcgis-platform. (accessed Feb. 20, 2026).
- L. Ziwei, T. Xiangling, L. Liju, C. Yanqi, W. Xingming, and Y. Dishan, “GIS-based risk assessment of flood disaster in the lijiang river basin,” Sci. Rep., 13 (1) 6160 (2023). doi:10.1038/s41598-023-32829-5.
- A.N. Leeonis, M.F. Ahmed, M. Bin Mokhtar, B. Halder, C.K. Lim, N.A. Majid, and M. Scholz, “Importance of geographic information system (gis) application to reduce the impact of flood disasters in malaysia: a meta-analysis,” Water, 17 (2) 181 (2025). doi:10.3390/w17020181.
- M.C. Aydin, and E. Sevgi Birincioğlu, “Flood risk analysis using gis-based analytical hierarchy process: a case study of bitlis province,” Appl. Water Sci., 12 (6) 122 (2022). doi:10.1007/s13201-022-01655-x.
- C. Samela, T.J. Troy, and S. Manfreda, “Geomorphic classifiers for flood-prone areas delineation for data-scarce environments,” Adv. Water Resour., 102 13–28 (2017). doi:10.1016/j.advwatres.2017.01.007.
- A. Gebrehiwot, and L. Hashemi-Beni, “3d inundation mapping: a comparison between deep learning image classification and geomorphic flood index approaches,” Front. Remote Sens., 3 868104 (2022). doi:10.3389/frsen.2022.868104.
- M.A. Hamouda, A.G. Awadallah, and R.H. Abdel-Maguid, “Extension of the geomorphic flood index classifier to predict flood inundation maps for uncalibrated rainfall depths in arid regions,” Nat. Hazards, 120 (5) 4633–4655 (2024). doi:10.1007/s11069-023-06393-0.
- C. Albertini, D. Miglino, V. Iacobellis, F. De Paola, and S. Manfreda, “Delineation of flood‐prone areas in cliffed coastal regions through a procedure based on the geomorphic flood index,” J. Flood Risk Manag., 15 (1) e12766 (2022). doi:10.1111/jfr3.12766.
- F. Faridani, S. Bakhtiari, A. Faridhosseini, M.J. Gibson, R. Farmani, and R. Lasaponara, “Estimating flood characteristics using geomorphologic flood index with regards to rainfall intensity-duration-frequency-area curves and caddies-2d model in three iranian basins,” Sustainability, 12 (18) (2020). doi:10.3390/su12187371.
- V. Bonner, G. Brunner, and M. Jensen, “HEC river analysis system (hec-ras),” Proc. - Natl. Conf. Hydraul. Eng., (pt 1) 376–380 (1994).
- A.A.M. AL-Hussein, S. Khan, K. Ncibi, N. Hamdi, and Y. Hamed, “Flood analysis using hec-ras and hec-hms: a case study of khazir river (middle east—northern iraq),” Water, 14 (22) (2022). doi:10.3390/w14223779.
- K. Khatooni, F. Hooshyaripor, B. MalekMohammadi, and R. Noori, “A new approach for urban flood risk assessment using coupled swmm–hec-ras-2d model,” J. Environ. Manage., 374 123849 (2025). doi:10.1016/j.jenvman.2024.123849.
- W.G. Namara, T.A. Damisse, and F.G. Tufa, “Application of hec-ras and hec-georas model for flood inundation mapping, the case of awash bello flood plain, upper awash river basin, oromiya regional state, ethiopia,” Model. Earth Syst. Environ., 8 (2) 1449–1460 (2022). doi:10.1007/s40808-021-01166-9.
- M. Calabrese, F. Iandolo, P. Vito, R. D’Amore, and F. Caputo, “Nature-based solutions: a smart way to improve urban resilience in the face of climate change,” ITM Web Conf., 51 (2023). doi:10.1051/itmconf/20235103003.
- S.N. Sharma, and D. Ayuba, “Nature Based Solutions to Prevent Urban Flooding,” 2024. doi:10.5281/zenodo.10651295.
- K. Aghaloo, A. Sharifi, N. Habibzadeh, T. Ali, and Y.-R. Chiu, “How nature-based solutions can enhance urban resilience to flooding and climate change and provide other co-benefits: a systematic review and taxonomy,” Urban For. Urban Green., 95 128320 (2024). doi:10.1016/j.ufug.2024.128320.
- T. McPhearson, N. Kabisch, and N. Frantzeskaki, “Nature-based solutions for cities,” 2023. doi:10.4337/9781800376762.
- M.I. Rau, M.H. Hidayatulloh, Y. Suharnoto, and C. Arif, “Evaluation of flood modelling using online visual media: case study of ciliwung river at situ duit bridge, bogor city, indonesia,” IOP Conf. Ser. Earth Environ. Sci., 622 (1) 0–12 (2021). doi:10.1088/1755-1315/622/1/012041.
- A. Hidayat, L.M. Limantara, W. Soetopo, and D. Sisinggih, “Alpha parameter modeling of nakayasu synthetic unit hydrograph based on the watershed shape factor,” J. Hunan Univ. Nat. Sci., 49 (1) (2022). doi:10.55463/issn.1674-2974.49.1.5.
- D.S. Krisnayanti, M.E. Bolla, J.K. Nasjono, and M.J.M. Wangge, “The analysis of alpha parameter on Nakayasu Synthetic Unit Hydrograph in Timor Island watersheds,” in: IOP Conf. Ser. Mater. Sci. Eng., IOP Publishing, 2019: p. 12015. doi:10.1088/1757-899X/669/1/012015.
- I.N. Sinarta, P.I. Wahyuni, and P. Aryastana, “Analysis of debris flow hazard in volcanic soil by the flood flows modelling (dflowz) and nakayasu synthetic unit hydrograph,” Int. Rev. Civ. Eng. (I. RE. CE), 14 (2) 112–118 (2023). doi:10.15866/irece.v14i2.20470.
- D.W. Christiana, “Building resilience through nature-based solutions: exploring the urban-rural linkages in flood mitigation strategies for jayapura,” Smart City, 3 (2) (2023). doi:10.56940/sc.v3.i2.3.
- K. Zhou, F. Kong, H. Yin, G. Destouni, M.E. Meadows, E. Andersson, L. Chen, B. Chen, Z. Li, and J. Su, “Urban flood risk management needs nature-based solutions: a coupled social-ecological system perspective,” Npj Urban Sustain., 4 (1) 25 (2024). doi:10.1038/s42949-024-00162-z.
- K.N. Irvine, A. Suwanarit, F. Likitswat, H. Srilertchaipanij, A. Sahavacharin, J. Wongwatcharapaiboon, P. Boonkam, M. Ingegno, and S. Janpathompong, “Nature-based solutions to enhance urban flood resiliency: case study of a thailand smart district,” Sustain. Water Resour. Manag., 9 (1) 43 (2023). doi:10.1007/s40899-023-00821-6.
- A. Suratno, T. Pistorius, B. Mislimshoeva, and S. Elkan, “Study on Nature-based Solutions (NbS) in ASEAN,” 2022.
- S. Ogras, and F. Onen, “Flood analysis with hec-ras: a case study of tigris river,” Adv. Civ. Eng., 2020 (1) 6131982 (2020). doi:10.1155/2020/6131982.
- J. Neumann, C. Scheid, and U. Dittmer, “Potential of decentral nature-based solutions for mitigation of pluvial floods in urban areas—a simulation study based on 1d/2d coupled modeling,” Water, 16 (6) (2024). doi:10.3390/w16060811.
- S. Kumar Singh, S. Kanga, B. Đurin, N. Kranjčić, R. Chaurasia, and D. Markovinović, “Flood risk modeling using hec-ras and geospatial techniques,” E-Zbornik, Elektron. Zb. Rad. Građevinskog Fak., 11 (22) 20–36 (2021). doi:10.47960/2232-9080.2021.22.11.20.
- BMKG, “Impact monitoring of hydrometeorological hazards,” (November) (2022).
- A.A. SAFRISURYANI, and I.H. Isnugroho, “Comparison study between rainfall probability analysis based on annual maximum daily areal rainfall and annual maximum daily point rainfall in grindulu river basin,” (2022).
- G. Panahi, S.R. Khodashenas, and A. Faridhosseini, “Using geomorphologic indicators in preparation for flood zoning and flood risk maps in the kashafroud basin, iran,” J. Flood Risk Manag., 17 (2) e12981 (2024). doi:10.1111/jfr3.12981.
- M.A.S. Hasibuan, S.D. Tarigan, and W. Ambarwulan, “Flood Inundation Distribution Modelling for River Boundary Management in Cisadane Sub-Watershed,” in: IOP Conf. Ser. Earth Environ. Sci., IOP Publishing, 2022: p. 12087. doi:10.1088/1755-1315/1109/1/012087.
- K.B. Pradini, and R.L. Kaswanto, “Reservoir Management Analysis of Water Quality and Pollution Load in Jakarta,” in: IOP Conf. Ser. Earth Environ. Sci., IOP Publishing, 2020: p. 12041. doi:10.1088/1755-1315/501/1/012041.
- C.. Headley, R.T, Tanner, “Application of floating wetlands for enhanced stormwater treatment: a review. client technical report prepared for auckland council,” (November) 100 (2006).
- M. Othman, G. Ruzaidi, K. Khalisanni, and Z. Nazarudin, “Morphology and water absorption analysis on single fibre and leaf of typha latifolia,” Adv. Mater. Res., 576 492–495 (2012). doi:10.4028/www.scientific.net/AMR.576.492.
- S. Narayanasamydamodaran, N. Kumar, and J. Zuo, “The role of plant uptake in total phosphorous and total nitrogen removal in vegetated bioretention cells using vetiver and cattail,” Chemosphere, 364 143276 (2024). doi:10.1016/j.chemosphere.2024.143276.
- M.J. Shahid, M. Arslan, S. Ali, M. Siddique, and M. Afzal, “Floating wetlands: a sustainable tool for wastewater treatment,” Clean–Soil, Air, Water, 46 (10) 1800120 (2018). doi:10.1002/clen.201800120.
- J. Mao, G. Hu, W. Deng, M. Zhao, and J. Li, “Industrial wastewater treatment using floating wetlands: a review,” Environ. Sci. Pollut. Res., 31 (4) 5043–5070 (2024). doi:10.1007/s11356-023-31507-3.
- G.S. Colares, N. Dell’Osbel, P.G. Wiesel, G.A. Oliveira, P.H.Z. Lemos, F.P. da Silva, C.A. Lutterbeck, L.T. Kist, and Ê.L. Machado, “Floating treatment wetlands: a review and bibliometric analysis,” Sci. Total Environ., 714 136776 (2020). doi:10.1016/j.scitotenv.2020.136776.
- R. Grosshans, “Cattail (typha spp.) biomass harvesting for nutrient capture and sustainable bioenergy for integrated watershed management,” Ph.D. thesis, University of Manitoba, Winnipeg, Canada (2014). http://hdl.handle.net/1993/23564 (accessed Feb. 20, 2026).
- P. Berry, F. Yassin, R. Grosshans, and K.-E. Lindenschmidt, “Surface water retention systems for cattail production as a biofuel,” J. Environ. Manage., 203 500–509 (2017). doi:10.1016/j.jenvman.2017.08.019.
- D. Svedarsky, R. Grosshans, H.D. Venema, S.N. Ellis-Felege, J. Bruggman, A. Ostlund, and J. Lewis, “Integrated management of invasive cattails (typha spp.) for wetland habitat and biofuel in the northern great plains of the united states and canada: a review,” Mires Peat, 25 09 (2019). doi:10.19189/MaP.2018.APG.367.