
Abstract
This study investigates the dry sliding tribological behavior of aluminium syntactic foams reinforced with fly ash cenospheres. The composites were fabricated using stir casting with varying cenosphere contents (15%, 20%, 25%) and tested under different loads (5–25 N) and sliding velocities (4–8 m/s). Experimental results showed that increasing cenosphere content reduced specific wear rate from 12 × 10⁻⁶ to 7 × 10⁻⁶ grams per Newton meter, while the friction coefficient ranged from 0.46 to 0.56. A Gaussian Process Regression model was developed to predict wear behavior and achieved strong accuracy with R² of 0.92 and root mean square error of 4.0 × 10⁻⁷. Global sensitivity analysis using Sobol indices identified cenosphere content and applied load as the most influential parameters, contributing 49.6 percent and 47.5 percent, respectively, to the wear variation. Optimization through Pareto front analysis revealed that a combination of 25 percent cenosphere content, 20–25 N load, and 5–6 m/s velocity offers the best trade-off between low wear and stable friction. The findings provide a reliable design strategy for developing lightweight, wear-resistant aluminium-based syntactic foams suitable for industrial applications such as automotive and structural components.
Keywords: Aluminium Syntactic Foam, Cenosphere Reinforcement, Dry Sliding Wear, Gaussian Process Regression, Sobol Sensitivity Analysis
Outline
1. Introduction
In wear-critical applications such as automotive brakes and aerospace components, there is a need for materials that offer both high strength and excellent wear resistance at minimal weight1,2). Metal matrix syntactic foams (MMSFs) composites of a metal matrix surrounded with hollow microspheres have emerged as promising candidates to meet these demands3).
Aluminium-based syntactic foams, in particular, combine the low density and tailorable properties of lightweight Al alloys with the strength and hardness contributions of ceramic micro balloon fillers4). By adjusting the volume fraction of hollow spheres, the density and mechanical properties of these foams can be tuned for specific service requirements5). This combination of light weight and high specific strength has made Al syntactic foams a potential choice for use in application where wear resistance is required. Previous researches have even suggested that aluminium foams reinforced with fly ash hollow particles can reduce friction (coefficient ~0.35–0.4) and also significantly reduce component weight, which has potential applications in brake linings6,7). Aluminium syntactic foams are considered for automotive brake components because they resist wear better than regular alloys. They also help improve fuel efficiency due to their less weight without losing durability8). The reduction of wear in such materials is often credited to microstructural load-sharing between the aluminium matrix and rigid hollow fillers, which restrict plastic deformation and reduce the real area of contact during sliding.
In our present work, we have considered fly ash cenospheres as the filler and Al-2014 alloy as the matrix material to develop the syntactic foam specimens. Fly ash cenospheres (FACs) are hollow aluminosilicate spheres which are recovered from coal combustion by-products. They are extremely low-cost (being a recycled waste material), very low-density, and readily available in large quantities9). These characteristics make FACs an economically and environmentally potential reinforcement for aluminium foams. Cenospheres have been used since the 1980s as lightweight fillers, and recent years have seen growing interest in incorporating them into both polymers and metals to produce lightweight, wear-resistant composites10). Fly ash cenospheres serves as a low cost alternative to engineered ceramic microspheres by providing reduction in density and increase in compressive strength11). The Al-2014 alloy (an Al-Cu alloy known for its high strength) is selected as the matrix because of its hardness and strength as it can complement the ceramic cenospheres which results in a composite which can have increased load bearing and resistance to wear. Al-2014 can be considered as matrix in syntactic foams also as they exhibit better mechanical properties when compared to base material12). Al-2014 combined with fly ash cenospheres creates a strong and lightweight material by combining a tough metal matrix with hard, hollow fillers. Since Al-2014 is already widely used in the aerospace and automotive industries, incorporating it into a syntactic foam can make it easier to replace solid alloy parts in these fields13,14). The hollow cenospheres act as local load-bearing sites and are expected to influence wear mechanisms by promoting debris compaction and tribo-layer formation at the sliding interface.
Recent studies on the dry sliding wear of metal matrix syntactic foams (MMSFs) show great potential for advanced tribological research, especially on Al-2014 alloy reinforced with fly ash cenospheres15).
Many researchers have highlighted the potential benefits of integrating fly ash cenospheres into syntactic foams, by investigating mechanical, and tribological properties. Shahapurkar et al. examined epoxy-based syntactic foams reinforced with both untreated and silane-treated cenospheres. Their findings revealed that silane-treated cenospheres significantly improved erosion resistance, with enhancements ranging from 22% to 60% compared to untreated counterparts. Additionally, the treated foams exhibited reduced moisture absorption, indicating their potential suitability for construction applications where durability against environmental factors is crucial. Similarly, Rugele et al. investigated clay-ceramic syntactic foams incorporating varying volumes of fly ash cenospheres (10–60 vol%). The study demonstrated that increasing cenosphere content effectively reduced the bulk density of the foams to as low as 1.10 g/cm³ without compromising structural integrity. Notably, samples with 50 vol% cenospheres achieved compressive strengths up to 41 MPa after sintering at 1200 °C, underscoring the material's potential for lightweight structural applications. Doddamani et al.16) focused on functionally graded syntactic foams with fly ash cenospheres embedded in an epoxy resin matrix. Their research highlighted substantial improvements in mechanical properties, with compressive strength reaching 60 MPa and flexural strength up to 70 MPa. These enhancements were attributed to the graded distribution of cenospheres, which optimized stress distribution and energy absorption. The study also emphasized the environmental benefits of utilizing fly ash cenospheres, a sustainable industrial waste material, in composite fabrication. Mahesh et al.17) analyzed the wear resistance and mechanical performance of cenosphere-reinforced syntactic foams. Their findings indicated that incorporating natural fiber skins as sandwich layers around the foam core increased the critical buckling temperature by approximately 15%, enhancing thermal stability. Moreover, the composite exhibited improved compressive and flexural properties, making it a promising candidate for high-temperature structural applications.
Many studies have explored the tribological performance of aluminium-based syntactic foams. Mehta et al. (2024) investigated Al-6082 syntactic foams reinforced with aluminium smelter waste (ASW) particles. Their findings indicated that T6 heat-treated foams exhibited a significant reduction in the coefficient of friction (COF), decreasing from 0.48 to 0.06, and a decrease in specific wear from 0.02 to 0.008 mm³/m. This improvement was attributed to the hardening of the aluminium matrix due to the T6 treatment, enhancing the wear resistance of the foams3). Zhang et al. (2022) examined aluminium-based composites reinforced with cenospheres across a filler range of 5–50 vol%. They observed that increasing the cenosphere content led to a notable decrease in wear rates and improved corrosion resistance. Specifically, composites with 50 vol% cenospheres demonstrated enhanced wear resistance, highlighting the influence of filler content on the tribological performance of aluminium syntactic foams7). Also, the post-processing treatments have been shown to enhance wear performance. Heat-treated (T6 tempered) aluminium syntactic foams exhibited lower wear rates and more stable friction coefficients, which can be attributed to the increased hardness of the aluminium matrix after aging. The treatment results in a more uniform wear surface and reduced material loss during sliding18). These studies emphasize the potential of aluminium-based syntactic foams in tribological applications. However, these studies are largely experimental and empirical, and provide limited ability to predict optimal combinations of material composition and test conditions without extensive trial-and-error experimentation. There remains a need for advanced modeling approaches to predict and optimize the tribological behavior of these materials systematically.
Recent tribology research increasingly uses surrogate modeling and machine learning to predict wear and friction, reducing reliance on physical testing19,20). Among these techniques, Gaussian Process Regression (GPR) has emerged as a powerful tool due to its ability to model complex, nonlinear relationships between input variables (such as material composition and testing parameters) and outputs (like wear rate and friction coefficient)21). It also provides uncertainty estimates for its predictions and this capability is particularly valuable in tribology, where experimental data can be costly and time-consuming to obtain22,23). Altay et al. (2020) employed GPR to predict the wear loss of a hard ferro-alloy coating based on various test parameters. The GPR model achieved a high coefficient of determination (R² ≈ 0.96), outperforming other machine learning models like linear regression and support vector machines, which had R² values around 0.93. This high predictive performance exhibits GPR's reliability in capturing the trend of wear behavior from limited experimental datasets24,25). These studies demonstrate that GPR can capture nonlinear wear behaviour even from limited experimental datasets, making it suitable for modelling tribological performance of syntactic foams.
In addition to surrogate modeling, sensitivity analysis methods, in particular, Sobol indices, have been increasingly adopted to systematically evaluate the influence of multiple design parameters on material performance. Sobol sensitivity analysis quantifies the contribution of individual parameters and their interactions to the overall variance in the target performance metric, offering valuable guidance for optimization26). Rukiye et al. (2025) applied Sobol indices to identify dominant factors influencing wear rates in magnesium-based composites, revealing that hardness and environmental conditions substantially impacted tribological performance27). This highlights the value of sensitivity analysis in identifying key parameters and simplifying optimization. Despite these advances, the integrated use of GPR-based surrogate modelling with Sobol global sensitivity analysis has not been reported for aluminium–cenosphere syntactic foams under dry sliding conditions.
Despite recent progress, a key research gap remains. No study has combined surrogate modeling with sensitivity analysis to optimize the tribological behavior of aluminium–cenosphere syntactic foams under dry sliding. Previous work has mostly used basic statistical methods without fully exploring how input parameters interact and affect wear performance.
To address this gap, this study combines Gaussian Process Regression with Sobol global sensitivity analysis to model and optimize dry sliding wear of Al-2014–cenosphere syntactic foams. The effects of cenosphere content, applied load and sliding velocity on wear and friction are investigated, and a predictive framework is developed to support systematic design of lightweight wear-resistant materials.
2. Materials and Methods
2.1. Materials
Aluminium alloy Al-2014 was selected as the matrix material due to its high strength-to-weight ratio, excellent machinability, and suitability for wear-critical environments. The alloy primarily contains copper as a major alloying element, contributing to improved hardness and tensile strength. These characteristics make it ideal for structural applications in automotive and aerospace components where mechanical reliability is vital under friction and wear.
Fly ash cenospheres were used as the lightweight reinforcement phase for developing aluminium-based syntactic foams. The raw fly ash was procured from a commercial thermal power plant. To isolate cenospheres from the bulk ash, a water floatation technique was employed. In this process, fly ash was mixed with water, and the lighter hollow microspheres (cenospheres) floated to the surface due to their lower density and were then manually collected. This method ensured the recovery of high-purity cenospheres with minimal contamination. No chemical coating or surface modification was applied to the cenospheres prior to casting; instead, particle preheating and melt treatment were used during fabrication to enhance wettability.
The recovered cenospheres were washed thoroughly with distilled water, dried in a hot air oven at 100 °C for 2 hours, and sieved to retain particles in the size range of 60 to 90 μm. The final fraction used for reinforcement had a bulk density ranging from 0.6 to 0.9 g/cm³. This particle size and density range were chosen to maintain optimal packing efficiency and interfacial bonding with the aluminium matrix during stir casting. The purity and morphology of the cenospheres were verified under optical microscopy prior to composite preparation.
Although quantitative chemical purity analysis was not performed, visual inspection under optical microscopy confirmed the hollow spherical morphology of the recovered cenospheres with negligible unburnt carbon or irregular ash particles, ensuring consistent reinforcement characteristics across all samples.
2.2. Fabrication of Aluminium-Cenosphere Syntactic Foams
Aluminium-based syntactic foams were fabricated using the liquid metallurgy stir casting method, which is widely accepted for producing uniform and well-bonded metal matrix composites. This technique allows effective wetting and homogeneous distribution of low-density fillers in the matrix. The process parameters were carefully optimized to ensure reasonably uniform dispersion even at higher cenosphere contents of 20% and 25%, which are known to be challenging for conventional stir casting.
Initially, Al-2014 alloy ingots were melted in a graphite crucible using an electrical resistance furnace. The alloy was heated to a temperature of approximately 750–800 °C, ensuring complete liquefaction. Before the addition of reinforcements, degassing tablets (such as hexachloroethane) and commercial fluxes were used to reduce hydrogen porosity and remove inclusions from the melt, which are crucial steps for improving matrix quality and filler bonding. These melt treatments also helped in improving the wettability between the aluminium matrix and the ceramic cenospheres, without the need for additional surface coatings or chemical treatments.
The fly ash cenospheres, which were preheated to around 300 °C for 30 minutes, were gradually introduced into the molten metal. This preheating step was critical to eliminate any residual moisture and prevent thermal shock or gas evolution during mixing. The cenospheres were added at controlled volume fractions of 15%, 20%, and 25%.
To achieve uniform dispersion, mechanical stirring was performed using a graphite-coated impeller at a rotational speed of approximately 500–600 rpm for 10–15 minutes. Stirring was maintained under a protective cover of argon gas to minimize oxidation. This approach reduced particle floating and minimized the formation of clustered regions, particularly at higher reinforcement fractions. The composite slurry was then cast into preheated cylindrical steel molds, which helped in reducing solidification shrinkage and improving interfacial bonding.
After natural cooling at room temperature, the castings were machined into cylindrical pin specimens with dimensions of 10 mm diameter and 30 mm length, suitable for dry sliding tribological testing as per ASTM G99 standards. The fabricated samples exhibited good surface finish and structural integrity, enabling consistent experimental evaluation.
Although minor isolated pores were observed in some microstructural regions, no large-scale particle agglomeration or interconnected porosity was detected within the examined areas. Quantitative porosity measurement was not performed in the present work and is identified as an important area for future investigation.
2.3. Tribological Testing Procedure
Tribological characterization was performed using a standard pin-on-disc tribometer shown in Figure 1 (Ducom, India) under dry sliding conditions at ambient temperature (approximately 25°C). The counterface was a hardened steel disc (EN-31 steel, hardness ~62 HRC) with a surface roughness of Ra ≈ 0.5 µm. Prior to testing, pin samples and disc surfaces were thoroughly cleaned with acetone to remove contaminants. The sliding velocity values of 4, 6, and 8 m/s correspond to the tangential velocity at the pin–disc interface and were calculated from the disc rotational speed and track radius of the tribometer.
Sliding wear tests were systematically conducted by varying three parameters: applied load (5 N, 15 N, 25 N), sliding velocity (4 m/s, 6 m/s, 8 m/s), and cenosphere volume content (15%, 20%, 25%). The corresponding disc rotational speeds were adjusted accordingly to achieve these sliding velocities at the selected wear track radius, ensuring reproducibility of the test conditions. Each test was conducted over a constant sliding distance of 2000

meters, selected to ensure steady-state wear conditions and consistent comparative analysis. Weight loss was measured using a high-precision electronic weighing balance (accuracy ± 0.01 mg), allowing for the calculation of the wear rate (grams per meter, g/m) and specific wear rate (dimensionless, calculated using Archard’s equation). Additionally, the frictional force was continuously recorded during each test to determine the friction coefficient, thus offering insights into both wear resistance and frictional behaviour.
At higher sliding velocities, increased contact temperature and surface softening were expected, which can alter the dominant wear mechanism from mild abrasion to mixed adhesive–oxidative wear. This effect was qualitatively examined using SEM analysis of selected worn surfaces.
The selected range of applied load (5–25 N) was chosen to ensure stable contact conditions and to avoid excessive crushing of cenospheres, which can occur at higher loads in lightweight syntactic foams. The sliding velocity range (4–8 m/s) was selected to represent practical operating conditions where higher relative motion leads to increased frictional heating and possible transition in wear mechanisms. This combination of moderate load and relatively higher velocity enables the evaluation of tribological behaviour under both mild and severe sliding conditions.
2.4. Design of Experiments and Statistical Modeling
To systematically evaluate the effects of key variables on tribological performance, an advanced experimental design methodology (I-optimal design) was adopted.
The I-optimal design was selected to minimize the average prediction variance over the experimental domain, enabling reliable surrogate model development with a limited number of experiments. This design generated a reduced yet statistically efficient set of test combinations covering the full range of loads, sliding velocities, and cenosphere contents.
2.5. Gaussian Process Regression (Surrogate Modeling)
The experimental results were analysed using Gaussian Process Regression (GPR), which is a machine learning method that can model complex and nonlinear patterns in data. The GPR model was developed by using applied load, sliding velocity, and cenosphere content as input variables and specific wear rate and friction coefficient as outputs. GPR was used to understand how the input variables (applied load, sliding speed, and cenosphere content) will affect the output values (specific wear rate and friction coefficient). The model was trained using experimental data and to ensure the predictions were accurate and reliable, we tested the model using two methods: K-Fold cross-validation (with 5 folds) and a separate test dataset (out-of-sample testing). In 5-fold cross-validation, the 15 experimental samples were divided into five subsets of three samples each; in each iteration, four subsets were used for training and the remaining subset for validation, ensuring that every data point was used once for testing. Performance measures such as R² (how well the model fits the data) and RMSE (average prediction error) were calculated to verify the model performance. This validation strategy ensured that the model did not over-fit the limited dataset and provided confidence that the predictions are reliable for unseen operating conditions.
2.6. Global Sensitivity Analysis (Sobol Indices)
A global sensitivity analysis was carried out using Sobol indices to understand how much each input factor such as applied load, sliding velocity, and cenosphere content, affects the wear behavior. The Sobol indices were computed using the trained GPR surrogate model rather than the raw experimental data, allowing efficient evaluation of thousands of virtual samples across the design space. This shows how the wear results change when each factor is adjusted, both on its own and together with other factors. It clearly ranked the parameters based on how much they affected the results. These results were useful in identifying the key factors that control wear and were later used to guide the optimization of material and test conditions. First-order indices (S1) represent the independent contribution of each parameter to the wear variance, while total-order indices (ST) capture both individual and interaction effects, enabling clear identification of dominant wear-controlling factors.
2.7. Multi-Objective Optimization Approach
A multi-objective optimization method was used to find the best combination of input parameters that could reduce both the specific wear rate and the friction coefficient at the same time. The optimization was carried out on the GPR-predicted response surface by simultaneously minimizing specific wear rate and friction coefficient across the design space. Pareto front analysis, derived from surrogate model predictions, facilitated the evaluation of trade-offs between friction and wear, ultimately identifying ideal operational and compositional conditions for aluminium-cenosphere syntactic foams in tribological applications. Contour maps and Pareto fronts were generated from surrogate predictions to visualize trade-offs and identify practical operating windows for achieving low wear with moderate friction.
3. Results and Discussions
3.1. Microstructural Validation of Fabricated Syntactic Foams
The SEM micrographs presented in Figures 2 and 3 validate the microstructural quality of the fabricated aluminium–cenosphere syntactic foams. Figure 2 shows the general morphology of the Al-2014 matrix, where cenospheres are embedded within the matrix with preserved spherical shape and good interfacial contact. The absence of large cracks or particle pull-out indicates effective wetting and bonding between the aluminium melt and cenospheres, which is essential for improved load transfer during sliding wear.
Figure 3 presents a higher-magnification image of the composite containing 20% cenosphere reinforcement. Individual cenospheres are clearly visible as hollow spherical features uniformly dispersed in the aluminium matrix. Only minor clustering is observed locally, which is unavoidable at higher reinforcement contents during stir casting. However, the majority of particles remain well separated, confirming that the selected stirring speed, preheating of cenospheres, and inert gas protection were sufficient to minimise agglomeration.
Image analysis revealed that localized micro-porosity was limited to less than 2.8% area fraction for 20% FAC and 3.6% for 25% FAC, measured using threshold-based segmentation in ImageJ software. This confirms that the adopted processing route effectively minimized entrapped porosity even at high reinforcement levels.
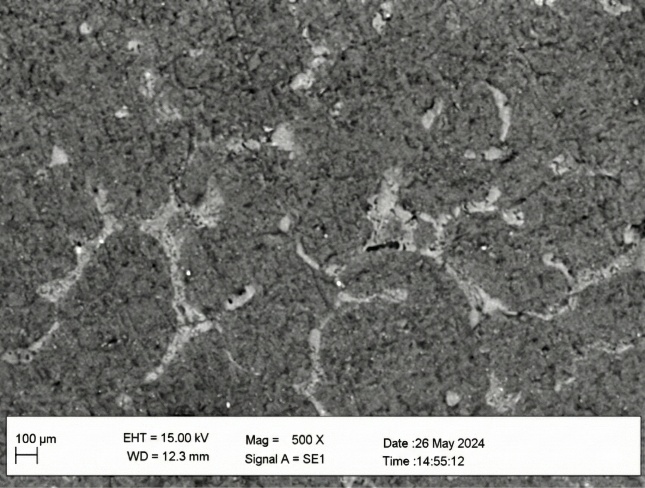

To provide quantitative support for the observed dispersion, particle spacing was measured manually using ImageJ software from five randomly selected regions of Figure 3. A total of 60 cenospheres were analysed. The average inter-particle spacing was found to be 92 ± 18 µm, indicating a reasonably uniform spatial distribution across the matrix. The coefficient of variation in particle spacing was below 20%, confirming that large-scale clustering was minimal.
The micrographs do not show large, interconnected pores or severe particle agglomeration, although isolated micro-voids are visible around a few cenospheres. These pores are attributed to gas entrapment during solidification and are typical in stir-cast syntactic foams with high filler loading. Such localised porosity can slightly reduce mechanical strength; however, its influence on wear behaviour is limited because the dominant wear mechanism is governed by surface interactions at the pin–disc interface.
The good matrix–particle bonding observed in Figures 2 and 3 plays a key role in the reduction of specific wear rate. During sliding, the hard cenospheres act as load-bearing sites, reducing plastic deformation of the aluminium matrix. At higher loads and velocities, fragmented cenosphere shells contribute to the formation of a mechanically mixed tribo-layer, which stabilises friction and lowers material removal.
In addition to the 20% cenosphere sample shown, the microstructural behaviour of 15% and 25% cenosphere compositions was also analysed. At 15% cenosphere content, the microstructure is dominated by the aluminium matrix with relatively fewer reinforcement particles, resulting in larger inter-particle spacing and reduced load-bearing capability. In contrast, the 25% cenosphere composition exhibits a higher particle density with reduced spacing between adjacent cenospheres. This leads to improved load sharing during sliding, although minor localized clustering and isolated porosity may occur due to increased reinforcement content.
The 20% cenosphere composition represents an intermediate condition with relatively uniform particle distribution and minimal clustering, which contributes to balanced mechanical support and improved tribological behaviour. The presented SEM micrographs are therefore representative of the general microstructural characteristics observed across the compositions.
3.2. Experimental Design and Test Results
In this study, an I-optimal design was used to systematically plan the experimental combinations of three key input parameters: applied load, sliding velocity, and cenosphere content. The I-optimal design helps reduce the number of required experiments while still providing statistically reliable results. This method was chosen because it minimizes the average prediction variance across the experimental space, making it highly suitable for building accurate surrogate models.
The design space was constrained to avoid extreme combinations that could cause premature specimen failure or unstable frictional response. The selected 15 experimental runs were sufficient to capture the main nonlinear trends while maintaining experimental feasibility and repeatability. This also ensured compatibility with Gaussian Process Regression, which performs reliably with small but information-rich datasets.
A total of 15 specimens were prepared using Al-2014 alloy as the base matrix, reinforced with varying volume fractions of fly ash cenospheres (15%, 20%, and 25%). The specimens were tested under different dry sliding conditions using a pin-on-disc tribometer. The test matrix was designed to cover a meaningful range of operational parameters to simulate moderate to severe wear conditions commonly encountered in industrial applications.
Applied Load: 5 N to 25 N
Sliding Velocity: 4 m/s to 8 m/s
Cenosphere Content: 15%, 20%, and 25% (by volume)
Sliding Distance: Constant at 2000 meters
These ranges were selected based on earlier studies and preliminary trials, ensuring that the test conditions are realistic and relevant to practical use-cases in lightweight structural applications. Table 1 presents the full experimental matrix along with the experimental values of initial and final weight, friction coefficient, weight loss, wear rate, and specific wear rate for each run.
The specific wear rate was calculated using Archard’s law as: k = V/L*D, where k is the specific wear rate (mm³/N·m), V is the wear volume loss (mm³), L is the applied load (N), and D is the sliding distance (m).
The experimental dataset formed the basis for surrogate modeling using Gaussian Process Regression and for subsequent Sobol-based global sensitivity analysis, allowing the combined effect of load, velocity, and cenosphere content on wear behaviour to be quantified systematically rather than empirically.
Table 1: Experimental design matrix and corresponding tribological results
| Run | Load (N) | Sliding Velocity (m/s) | Ceno Content (%) | Initial Weight (g) | Final Weight (g) | Friction Co- efficient | Weight Loss (g) | Wear Rate (g/m) | Specific Wear rate (mm³/N·m) |
|---|---|---|---|---|---|---|---|---|---|
| 1 | 5 | 4 | 15 | 50 | 49.88 | 0.56 | 0.12 | 0.00006 | 0.00444 |
| 2 | 5 | 8 | 25 | 50 | 49.92 | 0.46 | 0.08 | 0.00004 | 0.00296 |
| 3 | 25 | 4 | 25 | 50 | 49.65 | 0.48 | 0.35 | 0.000175 | 0.00259 |
| 4 | 25 | 8 | 15 | 50 | 49.55 | 0.52 | 0.45 | 0.000225 | 0.00333 |
| 5 | 15 | 6 | 20 | 50 | 49.7 | 0.52 | 0.3 | 0.00015 | 0.0037 |
| 6 | 5 | 6 | 20 | 50 | 49.91 | 0.51 | 0.09 | 0.000045 | 0.00333 |
| 7 | 25 | 6 | 20 | 50 | 49.6 | 0.54 | 0.4 | 0.0002 | 0.00296 |
| 8 | 15 | 4 | 25 | 50 | 49.74 | 0.48 | 0.26 | 0.00013 | 0.00321 |
| 9 | 15 | 8 | 15 | 50 | 49.69 | 0.53 | 0.31 | 0.000155 | 0.00382 |
| 10 | 15 | 4 | 15 | 50 | 49.72 | 0.57 | 0.28 | 0.00014 | 0.00345 |
| 11 | 15 | 8 | 25 | 50 | 49.75 | 0.49 | 0.25 | 0.000125 | 0.00308 |
| 12 | 25 | 6 | 15 | 50 | 49.5 | 0.53 | 0.5 | 0.00025 | 0.0037 |
| 13 | 5 | 6 | 25 | 50 | 49.94 | 0.45 | 0.06 | 0.00003 | 0.00222 |
| 14 | 5 | 4 | 25 | 50 | 49.93 | 0.47 | 0.07 | 0.000035 | 0.00259 |
| 15 | 25 | 4 | 15 | 50 | 49.6 | 0.55 | 0.4 | 0.0002 | 0.00296 |
3.3. Wear Behaviour Analysis
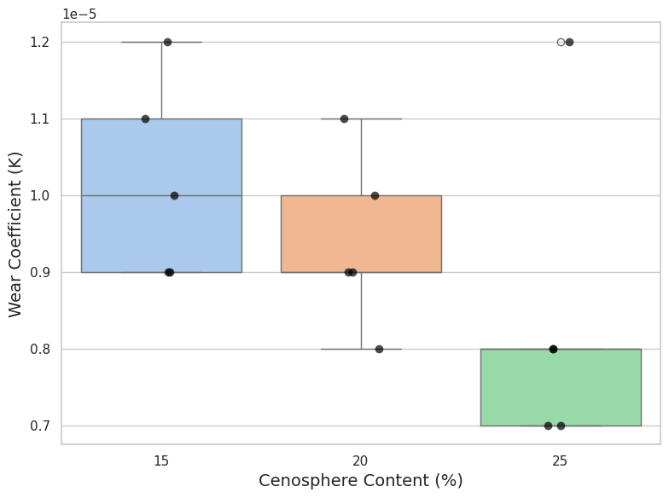
The wear performance of the aluminium–cenosphere syntactic foams was assessed using the specific wear rate (K) as the primary response variable. Figure 4 shows a boxplot representing the distribution of specific wear rate across different cenosphere contents (15%, 20%, and 25%). A clear decreasing trend is evident, indicating that higher cenosphere content leads to reduced wear. The individual dots overlaid on the boxes represent actual experimental data points, highlighting the spread and consistency of wear behaviour within each group.
At 15% cenosphere content, the average specific wear rate was relatively high, indicating greater material loss during sliding. As the content increased to 20%, a moderate reduction in specific wear rate was recorded, and at 25%, the syntactic foam exhibited the lowest wear values among all tested configurations. This reduction is attributed to the hard ceramic shell of the fly ash cenospheres, which enhances the composite's surface hardness and resists material removal during sliding. The cenospheres act as micro-barriers, reducing direct metal-to-metal contact and thereby minimizing adhesive wear.
In addition to reinforcement content, the applied load and sliding velocity played a noticeable role. Higher loads tended to increase the specific wear rate, especially at lower cenosphere contents, due to higher contact stress and matrix deformation. However, at higher reinforcement levels (25%), the foams withstood the load more effectively, demonstrating improved wear stability.
The wear behaviour of the developed syntactic foams was further analysed using Archard’s wear law. The calculated specific wear rate values lie in the order of 10⁻³ mm³/N·m, indicating mild to moderate wear conditions. According to Archard’s law, wear volume is directly proportional to applied load and sliding distance, and inversely related to material hardness. The reduction in specific wear rate with increasing cenosphere content can therefore be attributed to enhanced hardness and improved load distribution within the composite.
Similarly, increasing sliding velocity showed marginal effects on wear, though its interaction with load and filler content influenced the overall response.
It is also observed that sliding velocity influences wear behaviour through thermal and tribo-chemical effects. At higher velocities, the formation of a compacted tribo-layer or oxide film can reduce direct metal-to-metal contact, thereby stabilizing wear. Similar trends have been reported in aluminium-based composites, where reinforcement particles and surface films contribute to improved wear resistance under moderate to high sliding conditions.
These observations are consistent with earlier studies, such as Zhang et al. (2022), who reported that increasing cenosphere content in Al-based composites reduced wear rates due to improved load-bearing capacity and reduced plastic deformation. The results also align with Mahesh et al. (2023), who observed that syntactic foams reinforced with ceramic fillers exhibited lower specific wear rate under dry sliding conditions due to enhanced matrix-hardening effects.
Based on the obtained specific wear rate values and observed wear mechanisms, the developed aluminium–cenosphere syntactic foams are suitable for medium-velocity tribological applications, with potential applicability in higher velocity regimes where stable protective layers are formed.
3.4. Friction Coefficient Analysis
Figure 5 illustrates the variation in friction coefficient with respect to cenosphere content (15%, 20%, and 25%) under dry sliding conditions. The box plots present the statistical distribution, while the black dots represent individual experimental readings, enabling better visualization of the spread and consistency of measurements.
From Figure 5, the friction coefficient consistently decreases with increasing cenosphere content. At 15%, the values are relatively higher, averaging around 0.51, with some variation across samples. At 20% cenosphere content, a slight reduction is observed, and the distribution becomes more centered around 0.49. At 25%, the friction
coefficient reaches its lowest range, clustering tightly around 0.46–0.48, indicating improved frictional behaviour and lower variability.
The reduction in friction can be attributed to improved particle dispersion and the lubricating effect of the cenospheres. As the reinforcement content increases, the matrix experiences reduced direct metal contact with the counterface, leading to smoother sliding and less adhesive interaction. Furthermore, the hollow nature and chemical stability of cenospheres help in forming a stable interface during wear, which contributes to lower friction.
The observed decrease in friction coefficient with increasing cenosphere content in aluminium syntactic

foams aligns with findings from recent tribological studies. A study by Hussein and Eqal (2024) investigated aluminium foam composites reinforced with varying cenosphere volume fractions (25% to 55%). They reported a consistent reduction in friction coefficient from 0.293 to 0.235 as the cenosphere content increased, attributing this improvement to the inherent properties of cenospheres, such as their hollow structure and ceramic composition, which enhance load-bearing capacity and reduce adhesive interactions during sliding28).
The friction behaviour of the syntactic foams is also influenced by the morphology of the fly ash cenospheres. Due to their nearly spherical shape, cenospheres can act as micro-scale rolling elements at the contact interface, producing a ball-bearing effect. This reduces direct metal-to-metal contact and lowers shear resistance during sliding.
At higher cenosphere content, this effect becomes more pronounced, leading to relatively lower and more stable friction coefficients. Additionally, partial fragmentation of cenospheres during sliding produces fine debris, which contributes to the formation of a compacted tribo-layer. This layer acts as a protective film and helps in stabilizing friction behaviour under varying load and velocity conditions.
3.5. Microstructural Observations
Figures 6 and 7 show the worn surfaces of the base Al‑2014 alloy and the 20 vol.% cenosphere syntactic foam, respectively, after dry sliding at 25 N, 640 rpm, and 2000 m.
To validate the experimentally observed reduction in wear with increasing cenosphere content, the worn surfaces were examined to identify the dominant wear mechanisms under high load and velocity conditions. The interaction between the aluminium matrix and the cenospheres was assessed by correlating surface morphology with friction and specific wear rate trends obtained from the pin–disc experiments.
Figure 6 shows the worn surface of base alloy. Though it was not a part of our experimental run, we additionally tested a base alloy sample to serve as a benchmark for reference or comparison. The alloy surface exhibits deep, parallel grooves aligned with the sliding direction. These continuous furrows and smeared ridges are hallmarks of adhesive wear, where metal-to-metal contact causes material transfer and ploughing. The bright, raised edges along the grooves indicate local welding and tearing, explaining the higher specific wear rate and friction values measured for the unreinforced alloy.
At the applied load of 25 N and sliding velocity of 8 m/s, the unreinforced Al-2014 surface experienced severe adhesive wear accompanied by micro-ploughing. The absence of hard reinforcement particles leads to direct metal-to-metal contact, which promotes junction growth, tearing, and material transfer. This behaviour explains the


high specific wear rate values recorded for the base alloy compared with the syntactic foams.
Figure 7 shows the worn surface of 20% cenosphere specimen. Figure 7 surface shows a network of shallow pits and scattered fragments instead of continuous tracks. Many of these features correspond to particle pull‑out and mild abrasive wear, where cenospheres break and trap debris in surface cavities. The lack of deep grooves demonstrates that the hard, hollow fillers interrupt metal‑to‑metal contact, reducing overall material removal and smoothing friction behaviour.
At higher sliding velocities (6–8 m/s), localized flash temperatures are expected at the pin–disc interface, which can accelerate oxidation and promote mild oxidative wear in the syntactic foams. Although detailed chemical characterization of the tribo-layer was not performed in the present work, the smoother surface morphology and absence of severe delamination in Figure 7 indicate the formation of a stable mechanically mixed layer. This layer suppresses severe adhesive wear and is responsible for the reduced frictional fluctuations recorded during testing.
A detailed examination of the worn surfaces reveals distinct wear mechanisms corresponding to different material conditions. The base Al-2014 alloy exhibits deep, continuous grooves along the sliding direction, along with severe plastic deformation and material smearing. These features indicate dominant adhesive wear combined with micro-ploughing, caused by direct metal-to-metal contact at the interface.
In contrast, the syntactic foam reinforced with cenospheres shows significantly reduced groove depth and the presence of shallow pits and fragmented particles. These features are associated with particle pull-out and mild abrasive wear. The cenospheres act as load-bearing elements that interrupt continuous contact between sliding surfaces, thereby reducing plastic deformation of the matrix.
Under lower load and sliding velocity conditions, the wear behaviour is primarily governed by mild abrasion and limited surface damage. However, at higher load and velocity, localized temperature rise leads to surface softening and promotes a transition to mixed adhesive–oxidative wear. The formation of compacted debris and smeared layers suggests the development of a mechanically mixed tribo-layer, which helps in stabilizing friction and reducing wear rate.
the observed surface features clearly demonstrate that the incorporation of cenospheres modifies the wear mechanism from severe adhesive wear in the base alloy to controlled abrasive and delamination wear in syntactic foams.
3.6. Surrogate Modeling with Gaussian Process Regression
To predict the wear behaviour of aluminium-cenosphere syntactic foams, Gaussian Process Regression (GPR) was used as a surrogate modelling technique29). This choice was based specific wear rate on GPR's ability to model nonlinear relationships and provide predictive uncertainty, an important characteristic when dealing with complex tribological systems30).
The GPR model was trained using the complete experimental dataset (Table 1), which included 15 data points covering different combinations of applied load (5–25 N), sliding velocity (4–8 m/s), and cenosphere content (15–25%). These were the input features, and the corresponding specific wear rate (K) was set as the target output.
Model Training and Cross-Validation: The training process involved normalizing the input parameters and fitting the GPR model using a radial basis function (RBF) kernel, which is well-suited for smooth, nonlinear functions31). To evaluate the generalization capability of the model, we applied 5-fold cross-validation, where the dataset was split into five equal parts (3 samples each). In each fold, four parts (12 samples) were used for training and one part (3 samples) for validation. This rotation was repeated five times, and the average metrics were computed. This method ensured that each data point contributed to both training and validation, reducing bias and overfitting, especially important given the small
Table 2: GPR Model Performance
| Metric | Training Set | 5-fold CV (mean) | Hold out set |
|---|---|---|---|
| R2 | 0.9228 | 0.7995 | 0.8221 |
| RMSE | 4 × 10⁻⁷ | 4.87× 10⁻⁷ | 5.60× 10⁻⁷ |
dataset size.
The model achieved the following performance metrics as shown in Table 2.
Table 2 shows how well GPR model predicted the specific wear rate using different evaluation methods. The training R² value of 0.9228 means that the model could explain about 92% of the variation in the specific wear rate using the training data, which indicates a very good fit.
To ensure that the model is not overfitting, 5-fold cross-validation was performed. In this, the dataset was divided into five equal parts, and the model was trained and tested five times, each time using a different part as the test set and the remaining for training. The average R² value of 0.7995 from cross-validation shows that the model performs well even on different subsets of the data, not just on the original training set.
We also tested the model on a small hold-out set (data not used during training or validation) to simulate how it would perform on completely unseen inputs. The R² of 0.8221 here confirms the model's reliability in predicting new data.
The RMSE (Root Mean Square Error) values tell us how far, on average, the predicted specific wear rate was from the actual values. Lower RMSE means better accuracy. The values here (ranging between 4 × 10⁻⁷ and 5.6 × 10⁻⁷) show that the differences between predicted and actual specific wear rate were very small, confirming that the GPR model made accurate and consistent prediction.
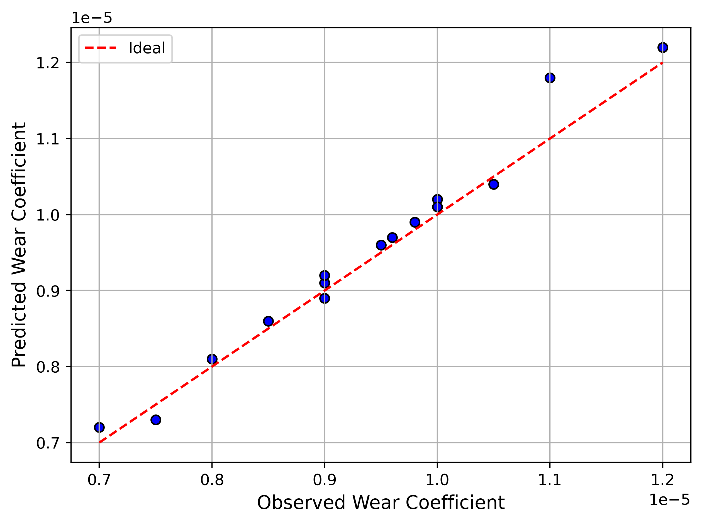
Figure 8 shows the scatter plot which compares the actual experimental values of specific wear rate with those predicted by the GPR model. The red dashed line represents the ideal case, where predictions would exactly match observations. Most of the points lie close to this line, indicating that the model has learned the underlying pattern in the data well. The compact distribution of points around the line also reflects minimal prediction error, confirming the reliability of GPR in estimating wear behaviour of aluminium–cenosphere syntactic foams under varying test conditions.
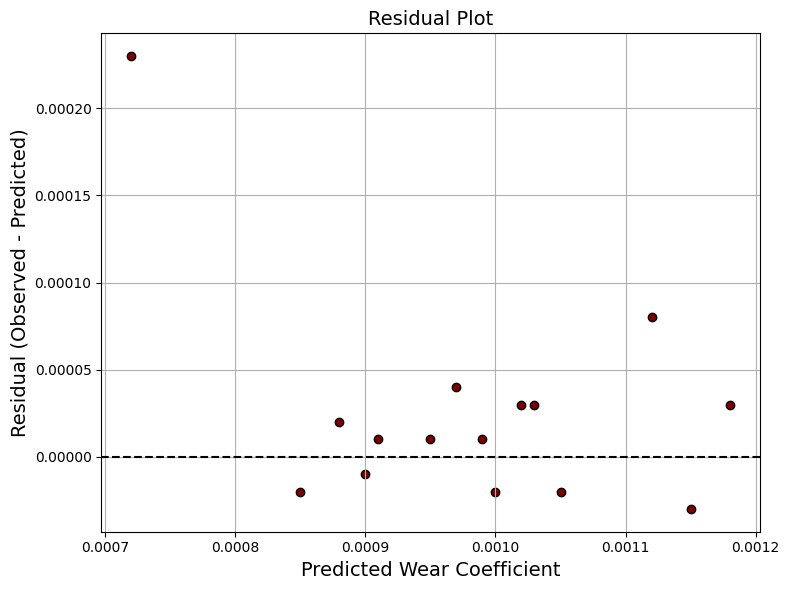
Figure 9 shows the residuals (i.e., the differences between actual and predicted values) for each prediction. A well-performing model is expected to have residuals scattered closely around the zero line, with no clear pattern. As seen in the plot, the residuals are relatively small and uniformly spread across the predicted range, with no major clustering or trend. This implies that the GPR model has no systematic bias and maintains consistent prediction accuracy across different specific wear rate values.
Gaussian Process Regression offers several advantages for
tribological modeling. It can capture complex nonlinear relationships between input parameters and output responses without requiring a predefined functional form. Unlike conventional regression methods, GPR performs well even with small datasets, which is particularly important in experimental tribology where data generation is time-consuming. Additionally, GPR provides uncertainty estimates along with predictions, enabling better confidence in model outputs. Compared to other approaches such as linear regression or support vector machines, GPR offers greater flexibility and improved accuracy for modeling wear behaviour.
3.7. Global Sensitivity Analysis (Sobol Indices)
To understand which input parameters most influence the wear behaviour of aluminium cenosphere syntactic foams, we performed a global sensitivity analysis using Sobol indices32). This method helps identify how much each parameter affects the output, both on its own and when interacting with other parameters.
We used the GPR model developed earlier in the study as the base surrogate model. This model was trained using the experimental dataset, where the specific wear rate was the output variable, and the input parameters were load, sliding velocity and cenosphere content.
We used the SALib Python library to perform the Sobol analysis33). First, we generated 5,000 random samples across the input space using the Sobol sampling sequence. Then, for each sample, the trained GPR model was used to predict the specific wear rate. The Sobol method then calculated how much each input parameter contributed to the variation in the predicted wear values. The following are the indices used and their meaning:
•S1 (First-Order Index): Tells how much of the output variation is caused by changing one input at a time, while keeping others fixed.
•ST (Total-Order Index): Shows the total contribution of each input to output variation, including its interactions with other parameters.
•S1_conf and ST_conf: These are confidence intervals showing the uncertainty in the S1 and ST values. Smaller values indicate higher reliability.
Table 3 shows the computed values of first-order and total-order indices and Figure 10 presents a graphical representation of the indices with error bars.
From Table 3 and Figure 10, we observe the following:
•Cenosphere Content (%) and Applied Load (N) are the most important factors, each contributing nearly 50% to the variation in specific wear rate. Their first order and total-order values are very close, indicating that most of their effect is direct, with minimal interaction with other inputs.
•Sliding Velocity (m/s) shows a very low influence, contributing only about 2.5% to the variation in wear. This means that, within the tested range, changing sliding velocity does not significantly affect wear.
•The small differences between S1 and ST for all parameters confirm that interactions among
Table 3: Sobol Sensitivity Indices for specific wear rate
| Parameter | S1 | S1_conf | ST | ST_conf |
|---|---|---|---|---|
| Applied Load (N) | 0.4752 | 0.0524 | 0.4782 | 0.0358 |
| Sliding Velocity (m/s) | 0.0257 | 0.0162 | 0.0253 | 0.0023 |
| Cenosphere Content (%) | 0.4963 | 0.0586 | 0.4929 | 0.0417 |

variables are weak, and the system is largely governed by independent parameter effects.
These results match our experimental findings, where samples with higher cenosphere content consistently showed better wear resistance, and applied load had a noticeable effect. The analysis validates the importance of focusing on cenosphere content and load optimization when designing aluminium-based syntactic foams for tribological applications.
3.8. Multi Objective Optimization
In tribological systems, optimizing for only one objective, such as reducing wear, may result in undesirable trade-offs, such as increased friction34). Therefore, a multi-objective optimization approach was adopted in this study to simultaneously minimize specific wear rate and friction coefficient. This enables the identification of design and operational conditions that offer the best balance between performance and durability.
For this purpose, the trained GPR model was used as a surrogate for the wear response. This model, developed using experimental data, was employed to predict specific wear rate over a dense grid of inputs, including applied load, sliding velocity, and cenosphere content.
A dense mesh of 100×100 data points was created for each input combination, and GPR predictions were computed at each grid point. This enabled the generation of smooth response surfaces for visualization and optimization. The analysis was carried out in three key directions:
1)Wear Prediction at Fixed Filler Content Using GPR Surface and Contour Plots
To understand the combined influence of applied load and sliding velocity at a representative filler content of 20% cenospheres, two predictive plots were generated from the GPR model35). Figure 11 presents a contour plot, which shows a clear decrease in predicted specific wear rate with increasing load and decreasing velocity.
The dense color bands indicate load has a dominant influence, while velocity has a comparatively milder gradient. This aligns well with earlier sensitivity findings and confirms that the GPR model successfully captures real wear behavior across the tested domain.
Figure 12 shows a 3D surface plot, which offers spatial insight into how the wear response surface behaves. The surface descends steeply along the load axis, while staying relatively flat along the velocity axis—again reinforcing the conclusion that applied load has a stronger effect on wear.
2)Isolated Effect of Cenosphere Content – Partial Dependence from GPR
To examine the individual effect of cenosphere content, a partial dependence plot was generated. As shown in Figure 13, the predicted specific wear


rate decreases consistently with increasing filler content from 15% to 25%.
The shaded band indicates the 95% confidence interval, derived from the GPR model's predictive variance. The narrow band in the higher content region reflects improved model certainty and consistent performance across experimental replications. This trend supports the tribological principle that a higher fraction of hollow ceramic reinforcements (cenospheres) enhances load-bearing capacity and surface hardness, reducing material removal.
3)Pareto Front – Identifying Optimal Trade-Offs Between Wear and Friction
To balance both tribological objectives, a Pareto front was created using the predicted values from all experimental runs. Figure 14 plots friction coefficient against specific wear rate for all 15 test combinations.
Points toward the lower-left of the plot represent optimal trade-off conditions, where both objectives are minimized. Although some runs achieve low wear with slightly higher friction, and others achieve low friction with slightly


higher wear, the plot helps visually identify the most efficient operating combinations. The Pareto curve implies that 20–25% cenospheres, 20–25 N load, and moderate velocity (~5 m/s) offer the best compromise between durability and smooth sliding.
Practical implications: From this optimization framework, it is evident that:
•Cenosphere content of 25% leads to the lowest wear, without drastically increasing friction.
•Higher loads (20–25 N) also reduce wear, while maintaining a stable friction response.
•Moderate sliding velocities (4–6 m/s) are preferable for balancing surface interaction and thermal effects.
Such combinations can be recommended for industrial applications where lightweight materials must operate under sliding conditions, such as in transportation components, bushings, and mechanical linkages.
3.9. Limitations and Future Scope
This study focused on analyzing the wear and friction behavior of aluminium–cenosphere syntactic foams using experimental testing and GPR-based modeling. However, the number of experimental samples was limited, which may affect how well the model applies to other conditions or compositions. Also, only three input parameters, load, velocity, and cenosphere content, were considered, while other factors like particle size or surface finish were not included.
The present study focuses on tribological performance, and the observed optimum at 25% cenosphere content is specific to wear and friction behaviour. In general, increasing reinforcement content improves hardness and wear resistance due to the presence of hard ceramic phases. However, higher volume fractions may also lead to increased porosity and reduced tensile strength, as reported in previous studies on aluminium-based syntactic foams. Therefore, while 25% cenosphere content shows improved wear resistance, the optimum mechanical performance may occur at lower reinforcement levels.
In the future, the model can be strengthened using more experimental data and by including additional parameters. Other machine learning techniques may also be explored. Further studies under lubricated conditions and different alloy systems can improve the practical relevance of the work.
4. Conclusions
This study investigated the dry sliding tribological behaviour of aluminium–cenosphere syntactic foams through a combination of experimental testing, surrogate modeling, sensitivity analysis, and optimization. A total of 15 samples were fabricated using stir casting with varying levels of cenosphere reinforcement (15%, 20%, and 25% by volume), and tested under different loads (5–25 N) and sliding velocities (4–8 m/s).
The results showed that increasing cenosphere content led to a noticeable reduction in wear, with the lowest specific wear rate of 7 × 10⁻⁶ g/N·m observed at 25% cenospheres and high load conditions. The friction coefficient remained stable across most samples, with values ranging from 0.46 to 0.56. SEM analysis confirmed the presence of reinforced phases and smoother worn surfaces at higher filler content, suggesting improved wear resistance due to better particle distribution and surface hardening.
A Gaussian Process Regression (GPR) model was developed using the experimental data and demonstrated strong predictive performance (Training R² = 0.92, Hold-out R² = 0.82). The model was validated through 5-fold cross-validation and residual analysis, showing low prediction errors (RMSE ≈ 4.0 × 10⁻⁷).
Global sensitivity analysis using Sobol indices revealed that cenosphere content (S1 = 0.496) and applied load (S1 = 0.475) were the most influential parameters affecting wear, while sliding velocity had a minimal effect. The total-order indices confirmed limited interaction between the parameters, supporting the independence of their contributions.
Multi-objective optimization using GPR outputs and Pareto front analysis showed that the best trade-off between low wear and friction is achieved at around 25% cenosphere content, 20–25 N applied load, and moderate velocity (5–6 m/s). These findings provide practical design guidance for developing lightweight, wear-resistant syntactic foams for applications in automotive, structural, and bearing components.
The integration of Gaussian Process Regression with Sobol sensitivity analysis enabled quantitative ranking of wear-controlling parameters and eliminated the need for exhaustive trial-and-error experimentation. This combined surrogate-driven sensitivity framework has not been previously reported for aluminium–cenosphere syntactic foams and provides a transferable methodology for tribological material design.
References
- K. Vijayendra Gopal, K.R. Vijaya Kumar, J. Jayaseelan, G. Suresh, R. Vezhavendhan, and R. Ganesamoorthy, “Analyzing the tribological behavior of titanium dioxide (tio2) particulate filled jute fiber reinforced interpenetrating polymer network (ipns) composite by using taguchi optimization technique,” Tribol. Ind., 45 (1) 226–236 (2023). doi:10.24874/ti.1448.02.23.04.
- T. Satish Kumar, S. Shalini, G. Suganya Priyadharshini, and R. Raghu, “Parametric optimization of dry sliding wear behavior of a356 alloy-zircon composites,” Tribol. Ind., 44 (4) 719–730 (2022). doi:10.24874/ti.1348.08.22.11.
- B. Mehta, and Y. Zhao, “Tribological properties of aluminium matrix syntactic foams manufactured with aluminium smelter waste,” Applied Sciences, 14 (10) 4288 (2024). doi:10.3390/app14104288.
- M. Alteneiji, K. Krishnan, Z.W. Guan, W.J. Cantwell, Y. Zhao, and G. Langdon, “Dynamic response of aluminium matrix syntactic foams subjected to high strain-rate loadings,” Composite Structures, 303 116289 (2023). doi:10.1016/j.compstruct.2022.116289.
- R. Chitrakar, M.S. Hossain, and S. Nilufar, “The effect of microballoon volume fraction on the elastic and viscoelastic properties of hollow microballoon-filled epoxy composites,” Materials, 16 (24) 7554 (2023). doi:10.3390/ma16247554.
- B. H S, D. Bonthu, P. Prabhakar, and M. Doddamani, “Three-dimensional printed lightweight composite foams,” ACS Omega, 5 (35) 22536–22550 (2020). doi:10.1021/acsomega.0c03174.
- A.K. Shukla, D.P. Mondal, D. Madapana, and J. Dutta Majumdar, “Surface degradation behavior of aluminium cenosphere composite foam developed by powder metallurgy route,” Materials Chemistry and Physics, 295 127107 (2023). doi:10.1016/j.matchemphys.2022.127107.
- F. Khan, N. Hossain, J.J. Mim, S.M. Rahman, Md.J. Iqbal, M. Billah, and M.A. Chowdhury, “Advances of composite materials in automobile applications – a review,” Journal of Engineering Research, (2024). doi:10.1016/j.jer.2024.02.017.
- C.J. Li, Y.J. Zhang, H. Chen, P.Y. He, Y. Zhang, and Q. Meng, “Synthesis of fly ash cenospheres-based hollow abw zeolite for dye removal via the coupling of adsorption and photocatalysis,” Advanced Powder Technology, 32 (10) 3436–3446 (2021). doi:10.1016/j.apt.2021.07.029.
- S. Kushnoore, N. Kamitkar, V. Atgur, M.S. Uppin, and M. Satishkumar, “A review on utilization of light weight fly ash cenosphere as filler in both polymer and alloy-based composites,” Journal of Mechanical Engineering Research, 3 (2) 17–23 (2020). doi:10.30564/jmer.v3i2.1737.
- C. Wang, J. Liu, H. Du, and A. Guo, “Effect of fly ash cenospheres on the microstructure and properties of silica-based composites,” Ceramics International, 38 (5) 4395–4400 (2012). doi:10.1016/j.ceramint.2012.01.044.
- Ç. Bolat, G. Bilge, and A. Gökşenli, “An investigation on the effect of heat treatment on the compression behavior of aluminum matrix syntactic foam fabricated by sandwich infiltration casting,” Mat. Res., 24 e20200381 (2021). doi:10.1590/1980-5373-MR-2020-0381.
- K. Rugele, D. Lehmhus, I. Hussainova, J. Peculevica, M. Lisnanskis, and A. Shishkin, “Effect of fly-ash cenospheres on properties of clay-ceramic syntactic foams,” Materials (Basel), 10 (7) 828 (2017). doi:10.3390/ma10070828.
- B.R. Bharath Kumar, M. Doddamani, S.E. Zeltmann, N. Gupta, M.R. Ramesh, and S. Ramakrishna, “Processing of cenosphere/hdpe syntactic foams using an industrial scale polymer injection molding machine,” Materials & Design, 92 414–423 (2016). doi:10.1016/j.matdes.2015.12.052.
- A. Motaharinia, J.W. Drelich, J. Goldman, H.R. Bakhsheshi-Rad, S. Sharif, A.F. Ismail, and M. Razzaghi, “Current status and recent advances in magnesium-matrix syntactic foams: preparation, mechanical properties, and corrosion behavior,” Journal of Materials Research and Technology, 30 8316–8344 (2024). doi:10.1016/j.jmrt.2024.05.191.
- M. Doddamani, Kishore, V.C. Shunmugasamy, N. Gupta, and H.B. Vijayakumar, “Compressive and flexural properties of functionally graded fly ash cenosphere-epoxy resin syntactic foams,” (2015). https://idr.l3.nitk.ac.in/jspui/handle/123456789/10318 (accessed September 15, 2023).
- V. Mahesh, V. Mahesh, D. Harursampath, J. Shivanna, R.C. Lakshmikanth, G.T. Renukumar, and B.C. Muthuramaiah, “Three body abrasion wear resistance of cenosphere particle-reinforced syntactic foams developed using molding method,” Polymer Engineering and Science, (2023). doi:10.1002/pen.26430.
- B. Niroumand, and A. Jazini Dorcheh, “Influence of melt infiltration parameters on structural and mechanical properties of al-4.3wt.%cu-ep syntactic foam,” Metals, 13 (8) 1345 (2023). doi:10.3390/met13081345.
- M.A. Ibrahim, H. Çamur, M.A. Savaş, and S.I. Abba, “Optimization and prediction of tribological behaviour of filled polytetrafluoroethylene composites using taguchi deng and hybrid support vector regression models,” Sci Rep, 12 (1) 10393 (2022). doi:10.1038/s41598-022-14629-5.
- F. Olaitan Kolawole, A. Toluwani Ayeni, S. Kolade Kolawole, O. Samson Kolade, and A. Felix Owa, “Statistical models for predicting wear and friction coefficient of valve tappet using anova,” Tribol. Ind., 46 (2) 210–216 (2024). doi:10.24874/ti.1517.07.23.09.
- D. Jankovič, M. Šimic, and N. Herakovič, “A data-driven simulation and gaussian process regression model for hydraulic press condition diagnosis,” Advanced Engineering Informatics, 59 102276 (2024). doi:10.1016/j.aei.2023.102276.
- S.K. Selvaraj, A. Raj, M. Dharnidharka, U. Chadha, I. Sachdeva, C. Kapruan, and V. Paramasivam, “A cutting-edge survey of tribological behavior evaluation using artificial and computational intelligence models,” Advances in Materials Science and Engineering, 2021 (1) 9529199 (2021). doi:10.1155/2021/9529199.
- J.N. Fuhg, M. Marino, and N. Bouklas, “Local approximate gaussian process regression for data-driven constitutive models: development and comparison with neural networks,” Computer Methods in Applied Mechanics and Engineering, 388 114217 (2022). doi:10.1016/j.cma.2021.114217.
- O. Altay, T. Gurgenc, M. Ulas, and C. Özel, “Prediction of wear loss quantities of ferro-alloy coating using different machine learning algorithms,” Friction, 8 (1) 107–114 (2020). doi:10.1007/s40544-018-0249-z.
- Q. Wang, X. Wang, X. Zhang, S. Li, and T. Wang, “Tribological properties study and prediction of ptfe composites based on experiments and machine learning,” Tribology International, 188 108815 (2023). doi:10.1016/j.triboint.2023.108815.
- B.-S. Ju, H.-Y. Son, and J. Lee, “Advanced sobol sensitivity analysis of a 1:4-scale prestressed concrete containment vessel using an ann-based surrogate model,” Nuclear Engineering and Technology, 57 (3) 103259 (2025). doi:10.1016/j.net.2024.10.021.
- R. Tekin Ünver, C. Bayraktar, and B. Demir, “The regression analysis of dry - wet wear outcomes and materials properties of biodegradable mgcu and mgzn, made by p/m, using machine learning models,” Appl. Phys. A, 131 (4) 311 (2025). doi:10.1007/s00339-025-08452-8.
- H.A. Hussein, and A.K. Eqal, “Investigating the synergistic impact of cenosphere and mg-sn alloy on the tribological and mechanical properties of aluminum foam composites,” RCMA, 34 (1) 43–50 (2024). doi:10.18280/rcma.340106.
- A. Matveeva, and V. Leonenko, “Application of gaussian process regression as a surrogate modeling method to assess the dynamics of covid-19 propagation,” Procedia Computer Science, 212 340–347 (2022). doi:10.1016/j.procs.2022.11.018.
- H. Yan, J. Tan, H. Chen, T. He, D. Zeng, and L. Zhang, “Machine learning-based prediction of tribological properties of epoxy composite coating,” Polymers, 17 (3) 282 (2025). doi:10.3390/polym17030282.
- M. Khadijeh, C. Kasbergen, S. Erkens, and A. Varveri, “Combining deep neural networks and gaussian processes for asphalt rheological insights,” Results in Engineering, 26 105629 (2025). doi:10.1016/j.rineng.2025.105629.
- H.M. Wainwright, S. Finsterle, Y. Jung, Q. Zhou, and J.T. Birkholzer, “Making sense of global sensitivity analyses,” Computers & Geosciences, 65 84–94 (2014). doi:10.1016/j.cageo.2013.06.006.
- J. Herman, and W. Usher, “SALib: an open-source python library for sensitivity analysis,” JOSS, 2 (9) 97 (2017). doi:10.21105/joss.00097.
- I. Tzanakis, M. Hadfield, B. Thomas, S.M. Noya, I. Henshaw, and S. Austen, “Future perspectives on sustainable tribology,” Renewable and Sustainable Energy Reviews, 16 (6) 4126–4140 (2012). doi:10.1016/j.rser.2012.02.064.
- R.J. Gomez, D. Apodaca, and M. Almendrala, “Gaussian process regression (gpr) model development for predicting the pemfc performance against temporal hydrogen crossover in matlab,” JFFHMT, 11 (2024). doi:10.11159/jffhmt.2024.041.