
Abstract
Rapid urbanization in Tangerang has altered land use patterns, increasing flood risk in residential areas such as Anwa Residence. The existing drainage system, originally designed for a 10.10 ha catchment area, currently serves 22.16 ha, resulting in increased runoff and reduced hydraulic performance. This study evaluates hydrological changes and drainage system capacity using ArcGIS-based catchment delineation, drone-derived topographic data, rainfall analysis, and hydraulic modeling. The existing retention pond has a surface area of 1,386 m² and a storage capacity of 2,079 m³ (average depth 1.5 m), allowing it to accommodate only 22.15% of the total runoff volume under the 25-year design storm. To comply with the local zero-runoff policy, two eco-drainage improvement scenarios were evaluated. Hydraulic storage calculations show that deepening the pond to 6.77 m or expanding its area to 6,258 m² provides sufficient storage to accommodate 100% of the total runoff volume of 9,387 m³. The proposed design enables complete runoff retention, contributing to flood mitigation, groundwater recharge, and sustainable urban water management
Keywords: Drainage system, ecodrainage, flood, retention pond
Outline
1. Introduction
Rapid population growth and changes in land use are key factors increasing flood1). By the end of 2023, Tangerang will reach almost three times the minimum number to be categorized as a highly dense city, which is classified as more than 400 residents/km2 2). According to the International Disaster Database, Asia is the most affected continent by disasters, such as floods, earthquakes, and storms3,4). Indonesia, with its archipelagic landscape and diverse geographical features, faces recurrent natural disasters, particularly floods5). The rapid urbanization in Tangerang, particularly in areas like Anwa Residence, has led to significant land use changes, adversely affecting the local drainage systems. As residential areas expand, natural landscapes are replaced with impermeable surfaces, reducing groundwater recharge and increasing surface runoff. This transformation not only diminishes the natural resilience of the environment but also exacerbates the impacts of frequent and intense flooding events. Flooding is identified as arising in coastal areas, reservoirs, streams and canals6).
Historically, the drainage systems in this region were designed to handle specific rainfall volumes based on past climate patterns. However, with climate change contributing to more extreme weather conditions, including heavier rainfall and unpredictable storm patterns, these systems have become inadequate to cater to changing weather. For the last decade, flooding has become a yearly event for Tangerang during the rainy season7). The primary cause of the flood was the limited green area due to the latest constructions without any adjustments to the drainage system's capacity to accommodate the increased surface runoff8). The existing drainage infrastructure at Anwa Residence has struggled to cope with the increased runoff, leading to frequent flooding that disrupts daily life.
In response to these challenges, ecodrainage systems have emerged as a viable solution. Ecodrainage systems reduce surface runoff by temporarily capturing and retaining stormwater, thereby aiding in infiltrating stormwater and improving the quality of groundwater water9,10). These systems also incorporate sustainable practices that enhance water management while promoting environmental health and well-being. By integrating green infrastructure solutions, such as retention ponds and permeable surfaces, these systems aim to mimic natural hydrological processes, allowing for better water absorption and filtration, thereby restoring the natural water balance11-14). Prior research in Sidrap Regency has demonstrated that implementing retention ponds can decrease the flooding area by as much as 85.71%15). The existence of retention ponds serves as a flood mitigation strategy and facilitates recreational, residential, and educational pursuits16).
This study aims to mitigate excess runoff causing inundation in the housing area through the redesign of the existing drainage and retention systems. The research focuses on developing a design that addresses current flooding issues while accounting for longer rainfall return periods and potential land-use changes. The rainfall return period refers to the average interval over which a specific rainfall intensity is expected to be equaled or exceeded, making it a critical parameter in the design of flood control infrastructure17,18). By considering this parameter, this study contributes to the development of a more sustainable urban environment. The design process involves an assessment of existing drainage conditions and an evaluation of potential ecodrainage solutions. All analyses conducted in this study are based on applicable local and national regulations related to flood analysis and the design of flood control facilities.
2. Methods
2.1. Location and Data
Anwa Residence is an urban residential neighborhood in Karang Tengah, Tangerang. An extensive drainage system and designated infiltration zones characterize the area. However, recent changes, such as reduced vegetation cover and increased rainfall intensity, have compromised the effectiveness and efficiency of the existing drainage infrastructure. Figure 1 shows the location of the study area.
Since 2020, Anwa Residence has faced ongoing flooding issues. The rising intensity of precipitation has exceeded the capabilities of both the drainage and infiltration systems. In this study, daily rainfall data obtained from the Global Precipitation Measurement (GPM) mission for the period 2001–2021, covering a total of 20 years, were used. The GPM rainfall data were downloaded from the NASA Giovanni data portal19). The maximum daily rainfall values

derived from this dataset, which were subsequently employed in the hydrological analysis, are presented in Figure 2. Maximum daily rainfall was derived as an Annual Maximum Series (AMS), where the highest daily rainfall value was extracted for each year between 2001-2021.
For catchment analysis, the primary input data for areas outside the housing development were obtained from the Ina-Geoportal, Indonesia’s national geospatial data portal, which provides elevation data for the broader study area and its surroundings. These data were downloaded from https://tanahair.indonesia.go.id/. However, to achieve a more accurate design at the site scale, high-resolution topographic data were required. In this study, such data were acquired through drone-based surveys conducted over the housing area.

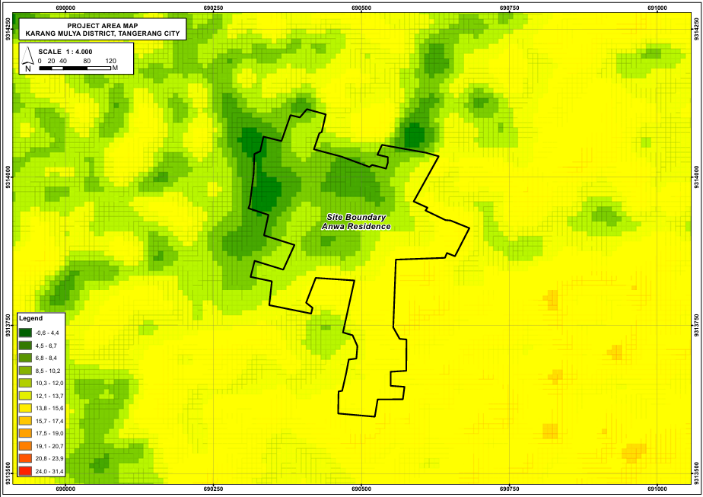

Both datasets were processed in the form of Digital Elevation Model (DEM), representing raw elevation information for the study area. The DEM data derived from the Ina-Geoportal and the drone survey were integrated using ArcGIS software, and the resulting combined elevation model is presented in Figure 3. Based on the processed DEM, the elevation of the study area ranges from approximately 7 to 12 m above mean sea level.
At the time of the study, the Anwa Residence housing area was partially constructed, with an existing main drainage channel and a retention pond, as illustrated in Figure 4. The main drain originates from the highest elevation in the southern part of the site and extends approximately 577 m toward the retention pond, with an average longitudinal slope of 0.001. Despite the presence of a retention pond covering an area of 1,386 m² and providing an estimated storage capacity of about 2,000 m³, the system has been shown to be insufficient for accommodating excess stormwater.
The calculations and analysis conducted in this study were guided by relevant regulatory frameworks, including Tangerang City Government Regulation No. 9 of 2023 on Urban Drainage System Implementation20), the Regulation of the Minister of Public Works of the Republic of Indonesia No. 12/PRT/M/2014 concerning the Implementation of Urban Drainage Systems21), and the Indonesian National Standard SNI 2415:2016 for flood discharge estimation22).
2.2. Catchment Analysis
The catchment analysis for the study area was conducted using ArcGIS (Arc Geographic Information System), a powerful Geographic Information System (GIS) platform that overcomes limitation in land data statistics and enables detailed spatial analysis and visualization of hydrological data23). ArcGIS was employed to systematically delineate the effective catchment area contributing to the main drainage system in this study. The overall workflow included data preparation, terrain preprocessing, flow analysis and catchment boundary delineation.
The use of high resolution drone data in this study allowed for improved terrain representation and higher spatial accuracy compared to publicly available DEMs, which is essential for small scale urban catchment analysis. The DEM was first processed using the Fill function to remove artificial sinks and depressions that may distort surface runoff patterns. This step ensured a hydrologically correct terrain model and a realistic representation of surface flow conditions, as shown in Figure 5.
Following the DEM correction, flow direction analysis was performed to determine the direction of surface runoff for each grid cell based on the slope conditions. The flow direction raster describes how water moves across the terrain from higher to lower elevations. Subsequently flow accumulation analysis was carried out to quantify the accumulated upstream flow for each cell by summing the number of contributing cells flowing into it5). High flow accumulation values indicate potential drainage paths and locations where runoff is likely to concentrate.
The results of the flow direction and flow accumulation analyses were used to identify the natural drainage network and dominant runoff pathways within the study area, as illustrated in Figure 6. Based on this information, basin delineation was conducted to define the catchment boundaries that contribute runoff to the main drainage channel. This step enabled the separation of effective contributing areas from non-contributing zones within the residential development.
ArcGIS also facilitated the integration of additional datasets, including land use information, to provide a comprehensive overview of the hydrological characteristics the study area24). Overall the catchment analysis provides a detailed understanding of surface runoff behavior and drainage patterns at Anwa Residence. The resulting catchment delineation serves as the critical input for hydrological calculations and hydraulic simulation.


2.3. Hydrological Analysis
Hydrological analysis is a crucial step in achieving effective and efficient water management; in this study, it is specifically applied to excess water management25). The primary objective of this analysis is to determine the design flood, which serves as the main input for the planning and design of the ecodrainage facilities26).
2.3.1. Frequency Analysis
The initial step for the hydrological analysis involves rainfall frequency analysis based on maximum daily rainfall records covering a minimum period of 20 consecutive years to determine the design rainfall22). Frequency Analysis is the estimation of how often a specified event will occur, which in this study is the design rainfall27,28). The rainfall series was prepared as an AMS, where the highest daily rainfall value was extracted for each year within the analysis period. Frequency analysis aims to establish the relationship between the value of extreme events, which in this study is represented by the maximum daily rainfall, and their frequency of occurrence based on a probability distribution29). The maximum daily rainfall data were fitted to the Normal, Gumbel, Log Normal and Log Pearson III distributions, and their suitability was assessed using the Smirnov-Kolmogorov (S-K) test. This non-parametric test assesses horizontal deviations by measuring the maximum difference between the empirical distribution derived from the observed maximum daily rainfall data and the corresponding theoretical distribution30). The test procedure consists of ranking the rainfall data in ascending order and computing the empirical cumulative probability, which is then compared with the theoretical cumulative probability. The maximum deviation is calculated using the following Equation (1):
where:
Pe = empirical cumulative probability
Pt = theoretical cumulative probability
The suitability of thedistribution is determined by comparing Δmax with the critical value (Δcr) obtained from the S-K table for a given sample size (n) and significance level (α), where in this study the test was performed at a significance level (α) = 0.05 and sample size (n) = 20. If Δmax values less than Δcr, the difference between the empirical and theoretical distribution is considered statistically insignificant, and the probability distribution is therefore accepted. Otherwise, if the Δmax exceeds Δcr, the distribution is rejected. The accepted distribution was then used to estimate the design rainfall (R), which served as input for the IDF (Intensity-Duration-Frequency) curve construction. In this study, a 25-year return period was adopted as the basis for rainfall intensity and discharge estimation to comply with drainage planning requirements for flood prone areas20).
2.3.2. Concentration Time
The next step in the hydrological analysis is the estimation of the concentration time21,22). The time of concentration represents the duration required for precipitation falling at the hydraulically farthest point of a watershed to reach the outlet31,32). Although several methods are recommended in the guidelines used for this study, the Kirpich method was selected to ensure consistency with the type of data used. The Kirpich method calculates the travel time based on the length of the flow path and the slope of the drainage area, as presented in Equation (2)33):
where:
tc = concentration time (minutes)
L = flow path length (meters)
S = slope or elevation difference/L (meter/meter)
The flow path length (L) was defined as the hydraulic travel distance along the existing main drain alignment, extending from the hydraulic farthest contributing point to the outlet. Since this study focuses on improving the existing drainage system, the assumed flow path follows the planned main drain route rather than the natural overland drainage pathway of the catchment. The slope (S) was calculated as the elevation difference between the upstream point and the outlet divided by the corresponding flow path length, derived from the DEM data. The estimated tc was subsequently used to define the rainfall duration (t) for intensity estimation.
2.3.3. IDF Curve
Rainfall intensity estimation constitutes a fundamental step in the hydrological analysis prior to the calculation of the discharge. In accordance with the aforementioned regulations, rainfall intensity in this study was calculated using the Mononobe method. The Mononobe method is widely applied to estimate rainfall intensity from daily rainfall data34). Rainfall intensity is commonly represented through Intensity-Duration-Frequency (IDF) curves, which are widely applied in hydrological and hydraulic engineering to design rainfall and flood management infrastructure by expressing the relationship between rainfall intensity, duration and frequency for a given return period35-37). The IDF relationship was formulated based on the Mononobe equation, as expressed in Equation (3):
where:
I = rainfall intensity (mm/hour)
R24 = 24-hour design rainfall (mm)
t = rainfall duration (hours)
The rainfall duration (t) used for the IDF estimation was set equal to the concentration time (tc), consistent with the Rational Method assumption to calculate the peak discharge.
2.3.4. Discharge
Peak discharge was calculated using the design values derived from the IDF curve. The rational method was employed for this purpose, in accordance with the guidance used for this study, and was selected to ensure the consistency with the type of data used in this study. This method has been widely applied and shown to provide reliable results for storm drain design38). The formulation of peak discharge using the Rational Method is expressed in Equation (4):
where:
Qp = peak discharge (m³/s)
C = runoff coefficient
I = rainfall intensity (mm/hour)
A = catchment area (km2)
The catchment area (A) used in the Rational Method corresponds to the effective contributing catchment delineated in ArcGIS. The runoff value coefficient (C) was adopted based on dominant residential land use which is classified as residential area, with a value of 0.7539). The resulting peak discharge estimation provides essential information on the expected runoff under significant rainfall events, and it was subsequently used as the upstream boundary condition in the HEC-RAS flow simulation.
2.4. Hydraulic Simulation
Hydraulic simulation was conducted using HEC-RAS (Hydrologic Engineering Center River Analysis System) version 4.1.0 to evaluate the performance of the existing main drainage system under design flow conditions. HEC-RAS serves as an effective tool for flood inundation mapping, with a primary focus on hydraulic flow and floodplain analysis40-43). The geometric model represents the main drain configuration within the study area, following the actual channel alignment and cross-sectional characteristics, as illustrated in Figure 7.
3. Results and Discussions
3.1. Catchment Area
The catchment analysis shows that Anwa Residence is located at a relatively lower elevation than the surrounding areas, forming a flow convergence zone where surface runoff from higher upstream area accumulates. Catchment morphology and slope characteristics strongly control runoff direction and concentration44,45), which explains why external inflows from adjacent areas can enter the residential drainage area.
As illustrated in Figure 8, the effective contributing catchment area is substantially larger than that is assumed in the initial drainage design. While the residential development covers 10.10 ha, the contributing to the main

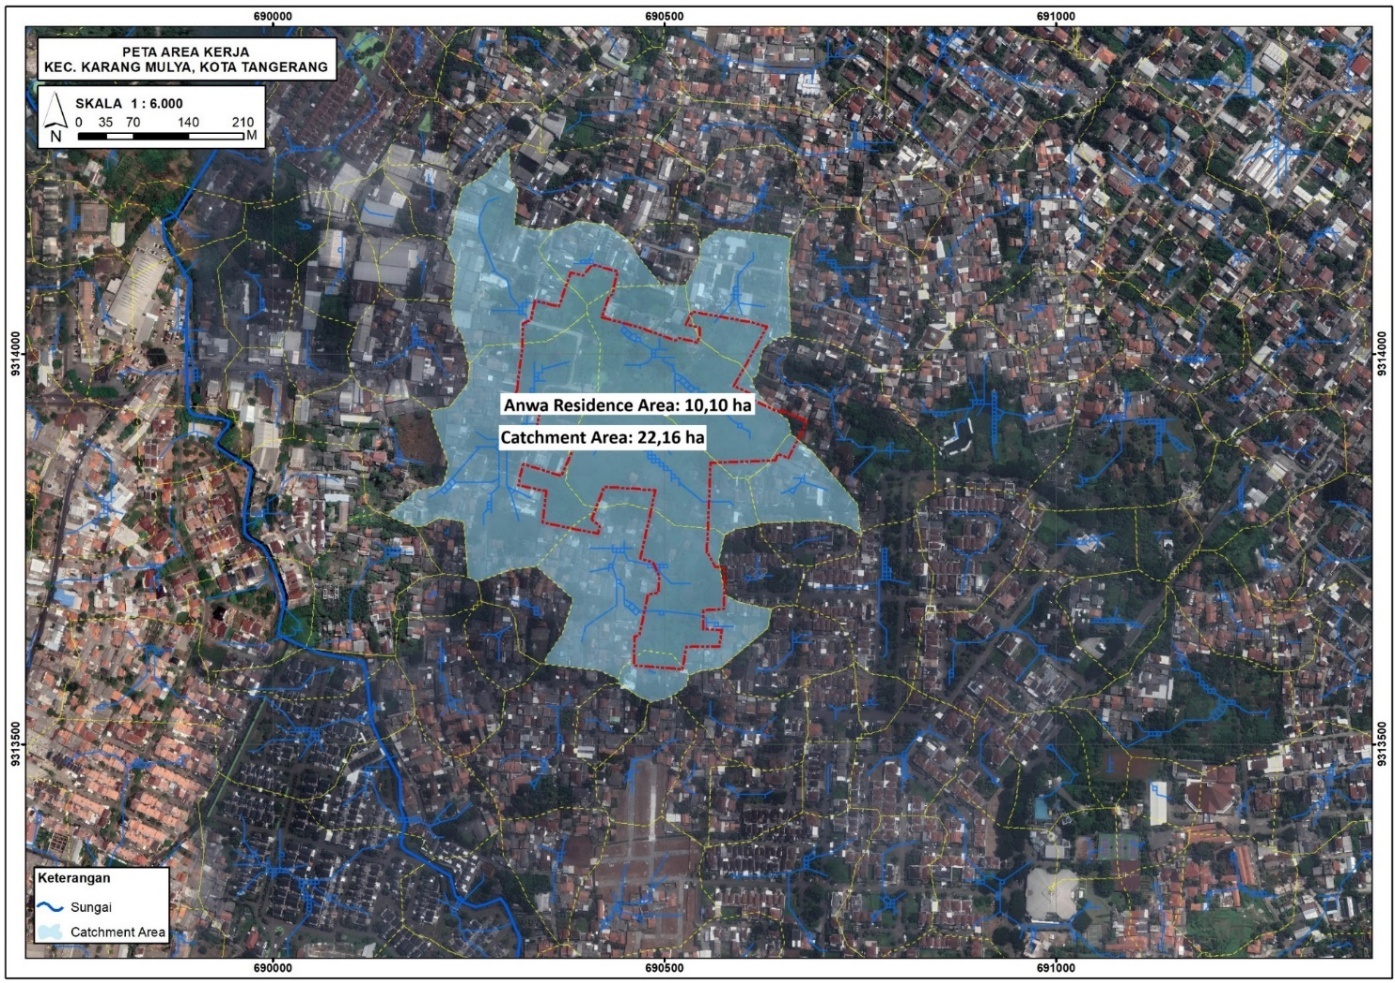
drain reaches 22.16 ha. This discrepancy indicates that the existing drainage system receives runoff from beyond the residential boundary and was therefore under designed relative to actual hydrological conditions. Such underestimation may lead to significant underprediction of peak discharge and frequent system surcharge during heavy rainfall events46).
These findings highlight the necessity of improving the existing drainage infrastructure to accommodate the actual contributing catchment conditions and reduce the inundation risk. Similar misrepresentation of catchment contribution has been widely reported in rapidly urbanizing areas where drainage designs often follow administrative boundaries rather than hydrological connectivity47,48).
3.2. Hydrology
a)Design Rainfall
The hydrological frequency analysis was conducted to determine the appropriate probability distribution for estimating design rainfall. The S-K test was applied to four commonly used distributions, namely: Normal, Log Normal, Gumbel, and Log Pearson III. The test results indicate that all tested distributions satisfy the acceptance criteria, as the maximum deviation (Δmax) for each distribution is smaller than the value of the critical value (Δcr) as summarized in Table 1.
Although all tested distributions satisfy the S-K acceptance criteria, the Log Pearson III distribution was selected for subsequent analysis because it exhibits the smallest maximum deviation among the evaluated distributions. The smaller Δmax indicates a closer agreement between the empirical rainfall data and the theoretical probability distribution49), suggesting that the Log Pearson III provides the best statistical to fit the observed rainfall series.
The calculation of design rainfall using the Log Pearson III distribution was performed by first transforming the
Table 1: Smirnov-Kolmogorov test results on each distribution
| Distribution | Δmax | Δcr | Decision |
|---|---|---|---|
| Normal | 0.126 | 0.290 | Accepted |
| Log Normal | 0.109 | 0.290 | Accepted |
| Gumbel | 0.102 | 0.290 | Accepted |
| Log Pearson III | 0.095 | 0.290 | Accepted |
Table 2: Design rainfall based on Log Pearson III distribution
| Return period (years) | Design rainfall (mm) |
|---|---|
| 5 | 139.26 |
| 10 | 161.50 |
| 25 | 190.81 |
annual maximum rainfall series into logarithmic form. The mean (x̅) and the standard deviation (Sd) of the logarithmic data were computed, and with the frequency factor (KT) obtained from standard Log Pearson III frequency tables, the design rainfall for a given return period was estimated using Equation (5)50):
where:
RT = design rainfall for return period T
x̅ = mean of the logarithmic rainfall data
KT = frequency factor
Sd = standard deviation
The design rainfall values derived from this method represent statistically robust estimates of extreme rainfall events and from the basis for subsequent intensity and peak discharge calculations used in hydraulic simulations. Based on the Log Pearson III analysis, the design rainfall values from return periods of 5, 10 and 25 years are presented in Table 2.
b)Concentration Time and IDF Curve
The Mononobe method was applied to develop IDF curves from design rainfall for each return period, thereby defining the relationship among rainfall intensity, duration and return period51). The derived IDF equations were then used to estimate the design rainfall intensity for the calculated time of concentration (tc) of 37.26 minutes. The resulting IDF equations, together with the corresponding design rainfall intensities for return periods of 5, 10, and 25 years, are summarized in Table 3. In the IDF equations presented in Table 3, y represents rainfall intensity (mm/hour), while x denotes rainfall duration (minutes).
Table 3: IDF curve equations for different return periods
| Return period (years) | IDF curve equation | Rainfall intensity (mm/hour) |
|---|---|---|
| 5 | y = 739.9 x−0.667 | 66.32 |
| 10 | y = 858.1 x−0.667 | 76.92 |
| 25 | y = 1013.8 x−0.667 | 90.88 |

Table 4: Peak discharge for different return periods
| Return Period (years) | Peak Discharge (m³/s) |
|---|---|
| 5 | 3.06 |
| 10 | 3.55 |
| 25 | 4.20 |
The IDF curves presented in Figure 9 illustrate that rainfall intensity increases markedly as rainfall duration decreases, a characteristic pattern commonly observed in urban catchments. This behavior highlights the susceptibility of the study area to high-intensity, short-duration rainfall events, which can rapidly generate surface runoff. Consequently, the existing drainage system faces a higher risk of being hydraulically overwhelmed during such events.
These results emphasize the importance of incorporating short-duration, high-intensity rainfall scenarios in the redesign of the drainage and ecodrainage systems to ensure adequate flood mitigation under current and future rainfall conditions.
c)Peak Discharge
The calculated peak discharges represent the expected runoff response of the effective contributing catchment under significant rainfall events for different return periods. These values provide essential input for evaluating the adequacy of the existing drainage system and for sizing the proposed ecodrainage components. The estimated peak discharges for return periods of 5, 10, and 25 years are summarized in Table 4.
The hydraulic simulation was performed using the design discharge corresponding to a 25-year return period. Although national guidelines issued by the Ministry of Public Works21) generally recommend a 5-year return period for drainage systems serving catchment areas smaller than 100 ha, the Local Regulation of Tangerang City20) requires a minimum design return period of 25 years for drainage systems located in flood prone areas. Given that Anwa Residence is classified as a flood prone zone, the use of 25-year return period peak discharge represents a more conservative and regulation-compliant design scenario.
3.3. Improvement Design
a)Channel Dimension
The hydraulic capacity of the drainage channel was evaluated using the Manning equation, which is widely applied in open channel flow analysis to estimate flow velocity and discharge under steady, uniform flow conditions. The Manning equation relates channel geometry, bed slope, and surface roughness to the conveyance capacity of a channel and is commonly adopted in the design and assessment of urban drainage systems52). The Manning equation is expressed in Equation (6).
where:
Qc = peak discharge (m³/s)
n = manning roughness coefficient
R = hydraulic radius (m)
Sc = channel bed slope (m/m)
Ac = cross sectional flow area (m2)
In this study, a Manning roughness coefficient of 0.015 was adopted to represent plastered concrete channels, with the channel slope maintained at 0.001 in accordance with the existing longitudinal profile of the main drain53). Based on the hydrological analysis, the 25-year design discharge was estimated at 4.20 m³/s, which serves as the basis for channel capacity evaluation.
The existing main drain consists of a rectangular U-ditch with a width and depth of 1.0 m located along both sides of the primary access road. Hydraulic analysis indicates that, under the existing slope and roughness conditions, the channel can convey approximately 2.03 m³/s, which is less than 50% of the required design discharge. This undercapacity reflects the original drainage design assumption, which considered runoff only from the residential area (10.10 ha) and did not account for the larger effective contributing catchment of 22.16 ha identified in this study.
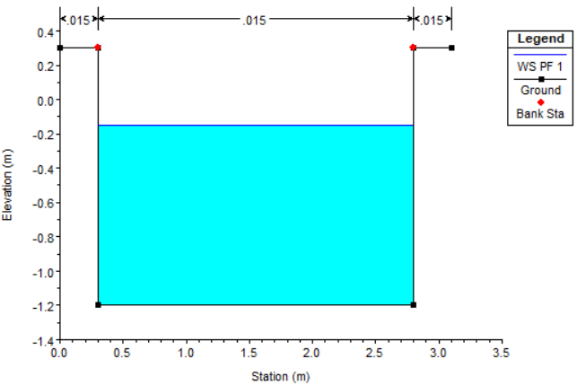
To accommodate the actual hydrological loading, the channel was redesigned using the same Manning-based approach. The analysis shows that a channel width of 2.5 m and a flow depth of 1.25 m is hydraulically sufficient to convey the 25-year discharge. In accordance with national drainage design guidelines, a minimum freeboard of 0.25 m was added for discharges between 1.5 and 5.0 m³/s21). Consequently, the recommended channel dimensions are 2.5 m in width and 1.5 m in total depth. This redesign significantly improves the conveyance capacity and aligns the drainage system with both the effective catchment conditions and applicable regulatory standards for flood-prone urban areas.
b)Flow Simulation
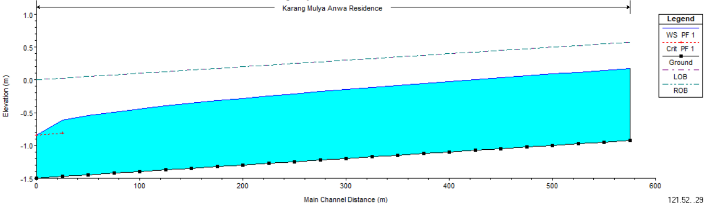
Flow simulation was conducted using the redesigned main drain geometry to evaluate the hydraulic performance of the system under peak flow conditions. The channel alignment in the model follows the existing main drain layout, while the cross-sectional dimensions were updated to the redesigned configuration of 2.5 m width and 1.5 m depth, as determined in the previous section. The simulated channel has a total length of approximately 575 m, with an existing longitudinal slope of 0.001. The channel surface was assumed to be smooth concrete, represented by a Manning roughness coefficient of 0.015. Flow conditions were simulated as steady flow using the peak discharge corresponding to the 25-year return period, 4.20 m³/s.
Boundary conditions were defined to reflect the actual hydraulic behavior of the system. At the upstream end, the inflow was specified as the 25-year peak discharge. At the downstream end, a critical depth boundary condition was applied to represent the free overfall condition where the main drain discharges into the retention pond. This setup allows the model to realistically capture the transition from channel flow to plunging flow at the outlet.
The simulation results, presented through longitudinal water surface profiles and cross-sectional views (Figure 10 to Figure 14), provide insight into the spatial variation of water surface elevation and flow depth along the channel. Based on the longitudinal and cross-sectional simulation results, the redesigned channel demonstrates adequate capacity to convey the design discharge, with water surface elevations remaining below the channel crest along the entire reach.



c)Ecodrainage Capacity
The inflow to the retention pond was determined based on the assumption that the effective rainfall duration is equal to the time of concentration, which was calculated to be 37.26 minutes. Under this condition, the entire catchment contributes simultaneously to runoff generation, resulting in the peak discharge. Using the 25-year return period design discharge of 4.2 m³/s, the total runoff volume generated during the design storm event was estimated at 9,387 m³.
The Regional Regulation of Tangerang City mandates the implementation of a zero runoff policy for all new developments, requiring on-site infiltration or storage facilities to ensure that no additional runoff is discharged into receiving water bodies as a consequence of land development20). While the regulation allows flexibility in the type of infiltration or retention infrastructure employed, it explicitly requires that such facilities be capable of managing 100% of the runoff generated within the developed area.
The existing retention pond has a surface area of 1,386 m² and a storage capacity of 2,079 m³, corresponding to an average water depth of 1.5 m. Under current conditions, the pond is only capable of accommodating approximately 22.15% of the total runoff volume generated for the 25-year design storm.
To address this deficiency and to comply with the zero runoff policy mandated by the local regulation, two improvement scenarios were proposed: increasing the depth of the existing retention pond or enlarging the retention pond area. Hydraulic storage calculations indicate that deepening the pond to a minimum depth of 6.77 m while maintaining the existing surface area, or alternatively expanding the retention pond area to 6,258 m² without increasing its depth, would provide sufficient storage capacity to fully accommodate the total runoff volume of 9,387 m³. Effective stormwater management is essential to reduce the volume of surface runoff entering drainage networks and recieving water bodies, thereby mitigating localized flooding54). This has become increasingly important as conventional drainage systems are often unable to accomodate the greater runoff volumes generated by rapid urbanization55). Implementing these improvements will make the retention pond crucial for managing stormwater runoff, promoting groundwater recharge, and improving overall water quality in the area56,57).
Water is fundamental to societal well-being, economic prosperity, and overall environmental vitality58). Consequently, urban water infrastructure can no longer be designed solely to convey runoff and reduce flood risk, but must also support broader ecological and sustainability objectives. Smart design and management interventions, including nature-based elements such as native vegetation and multifunctional landscapes, have been shown to enhance the ecological value of urban areas while improving hydrological performance area59).
In line with this paradigm shift, urban drainage management has evolved from conventional flood control strategies toward more integrated and sustainable approaches that consider the entire urban water cycle rather than focusing solely on the rapid conveyance of runoff57,60). These approaches recognize that stormwater should be managed not only to reduce flood risk but also to enhance groundwater recharge and improve water quality through infiltration, retention and treatment process61-64). Furthermore, contemporary drainage frameworks increasingly incorporate ecological considerations, promoting green infrastructure and multifunctional urban landscapes that provide environmental and hydrological benefits while strengthening urban resilience to flooding60,61).
Within this context, the application of an ecodrainage approach, as demonstrated in this study, not only addresses immediate flooding issues but also contributes to long-term sustainable urban water management by aligning hydraulic performance with environmental resilience and regulatory requirements13,65,66).
4. Conclusions
This study investigated the flooding challenges of Anwa Residence, Tangerang, caused by rapid urbanization, inadequate drainage infrastructure, and underestimated contributing catchment areas. Through integrated hydrological, hydraulic and spatial analysis, several key findings and design improvements were identified.
Catchment delineation using ArcGIS revealed that the effective contributing main drain (22.16 ha) is substantially larger than the 10.10 ha assumed in the original drainage design. This underestimation led to a significant underprediction of peak discharge and rendered the existing system hydraulically insufficient, and particularly during heavy rainfall events.
Hydrological frequency analysis using 20 years of GPM rainfall data confirmed that the Log Pearson III distribution best fits the observed annual maximum rainfall data series. The 25-year return period design rainfall of 190.81 mm, combined with Rational Method, yielded a peak discharge of 4.20 m³/s. This is more than double the conveyance capacity of the existing drainage channel.
To address these deficiencies, the main drain was redesigned with a width of 2.5 m and a total depth 1.5 m, including a 0.25 freeboard. HEC-RAS flow simulations confirmed that the redesigned channel adequately conveys the 25-year design discharge while maintaining water surface elevations below the channel crest throughout its entire length.
Regarding the ecodrainage component, the existing retention pond (1,386 m², 2,079 m³ capacity) was found to accommodate only approximately 22% of the total runoff volume generated during the design storm event of 9,387 m³. To comply with Tangerang City’s zero runoff policy, two improvement scenarios were proposed: deepening the pond to a minimum of 6.77 m, or expanding its surface area to 6,258 m². Either approach would bring the system into full regulatory compliance and meaningfully enhance flood mitigation, ground water recharge, and water quality outcomes.
References
- M. A. Kuisi, N. A. Azzam, T. Hyarat and I. Farhan, "Flood Hazard and Risk Assessment of Flash Floods for Petra Catchment Area Using Hydrological and Analytical Hierarchy (AHP) Modeling," Water, 16 (16), (2024). doi:10.3390/w16162283.
- BPS, Central Statistics Agency, Tangerang, (2024).
- L. Özdamar and M. A. Ertem, "Models, solutions and enabling technologies in humanitarian logistics," European Journal of Operational Research, 244 (1), pp. 55-65 (2015). doi:10.1016/j.ejor.2014.11.030
- N. Nisrina, Komarudin and M. M. I. Turner, "Optimization of Medical Relief Shelter Location in Disaster Condition: A Case Study in Jakarta, Indonesia," Evergreen, 11 (4), pp. 3410-3420 (2024). doi:10.5109/7326977
- H. Kausarian, J. T. S. Sumantyo, Batara, A. Suryadi and T. Pangestu, "SAR Sentinel Data Analysis: Hydrological Dynamics and Rainfall Patterns in the Kampar River Basin (2018-2023)," Evergreen, 11 (3), pp. 1558-1567 (2024). doi:10.5109/7236811
- H. Hamidifar, F. Yaghoubi and P. Rowinski, "Using Multi-criteria Decision-making Methods in Prioritizing Structural flood Control Solutions: A Case Study from Iran," Journal of Flood Risk Management, 17 (3), (2024). doi:10.1111/jfr3.12991.
- BNPB, "Indonesian Disaster Data," BNPB, (2024).
- H. Azmi, "Banjir Kota Tangerang," 23 April 2018. [Online]. Available: https://www.atmago.com/berita-warga/banjir-di-kota-tangerang_dce3a90e-0830-47b5-ae87-9b70eca79588.
- C. Kusumastuti, H. Pintardi, K. Wibisono and A. C. Hartono, "Eco Drainage System for Surface Runoff Reduction in Indonesia," Civil Engineering Dimension, 21 (1), pp. 29-35, (2019). doi:10.9744/ced.21.1.29-35.
- G. Fernandes, S. Di Prima, G. L. Kouyi, T. D. Fletcher, D. Donze, R. James, S.-M. Saint-Louis, M. Martini, C. Nicklason and L. Lassabater, "A Novel Method to Assess the Infiltration and Filtration Functions of Urban Soil," Vadose Zone Journal, 24 (6), (2025). doi:10.1002/vzj2.70050.
- J. Park, D. Lee and C. Won, "Study on Flood Control Facility Design Linking Retention Pond and Rainwater Pumping Station," Korean Society of Hazard Mitigation, 24 (6), pp. 391-397 (2024). doi:10.9798/KOSHAM.2024.24.6.391.
- S. Suprayogi, S. Budiman and H. K. Setiacahyandari, "Indicating Water Purification Ecosystem Service through Water Quality Assessment in Jetis Suruh Artificial Retention Pond, Sleman Regency," in 6th International Conference on Environmental Resources Management in Global Region 2024: "Landscape Management and Development for Sustainable Livelihood" (ICERM 2024), Yogyakarta (2024). doi:10.1088/1755-1315/1443/1/012011.
- E. Harmani and M. Soemantoro, "Retention Ponds as an Alternative for Flood Control," UNITOMO Civil Engineering Journal, 1 (1), pp. 71-80 (2017).
- M. Starzec and J. Dziopak, "A Case Study of the Retention Efficiency of a Traditional and Innovative Drainage System," Resources, 9 (108), (2020). doi:10.3390/resources9090108
- A. R. Suleman, S. Badaruddin, M. Mustamin, Z. Saingcan and M. R. Mustamin, "Flood Mitigation of Bila River in Sidrap Regency Indonesia based on Eco-Drainage Retention Pond," Water Practice & Technology, (2023). doi:10.2166/wpt.2023.051
- F. Guinensa, B. D. Putra and M. S. Rani, "Design of Retention Pond Kacang Pedang Area as a Water Tourism Recreation Using Water Sensitive Urban Design," in The 6th Plano Cosmo International Conference, (2024). doi:10.1088/1755-1315/1318/1/012011.
- N. A. Musakkir, N. Sunusi and S. A. Thamrin, "Stochastic Model of the Annual Maximum Rainfall Series Using Probability Distributions," Malaysian Journal of Fundamental and Applied Sciences, 19 (5), (2023). doi:10.11113/mjfas.v19n5.2945.
- I. M. Kamiana, Teknik Perhitungan Debit Rencana Bangunan Air, Yogyakarta: Graha Ilmu, (2012).
- NASA, "Giovanni," NASA, (2023) [Online]. Available: https://urs.earthdata.nasa.gov/. [Accessed 2023].
- Tangerang City Local Government, "Tangerang City Government Regulation No. 9 of 2023 on Urban Drainage System Implementation," (2023).
- KEMEN PU, "Regulation of Minister of Public Works, Republic of Indonesia No. 12/PRT/M/2014," Ministry of Public Works, (2014).
- BSN, "Indonesian National Standards 2415:2016 regarding Flood Discharge Estimation," National Standardization Agency, (2016).
- L. Zhang and L. Shi, "Application of Arcgis Software in the Production of Standard Subdivision Map in Land Engineering," Scientific Journal of Technology, 7 (3), pp. 190-192 (2025) doi:10.54691/j64gr462.
- O. C. Ukachukwu, B. U. Dike, K. C. Nganya and T. E. Eberechukwu, "Watershed Modelling Using the Geographical Information System (GIS) Approach (Federal University of Technology Owerri, Imo State Nigeria as Case Study)," Saudi Journal of Civil Engineering, 8 (7) pp. 159–167, (2024) doi:10.36348/sjce.2024.v08i07.003.
- Y. F. Dikatanaya, H. Sulistiyono and I. W. Yasa, "Analysis of Hydrological Station Rationalization in Dompu Regency," Journal of Mechanical Civil and Industrial Engineering, 6 (5), (2025) doi:10.32996/jmcie.2025.6.5.1.
- D. Rahayu, Risdiamon and I. Chumaedi, "Utilization of HEC DSS and HEC SSP Software for Rainfall Frequency Analysis in Drainage System Design for City’s Industrial Area," Jurnal Teknik Sipil dan Lingkungan, 10 (1), pp. 179-192 (2025). doi:10.29244/jsil.10.1.179-192.
- N. Bhagat, "Flood Frequency Analysis Using Gumbel's Distribution Method: A Case Study of Lower Mahi Basin, India," Journal of Water Resources and Ocean Science, 6 (4), pp. 51-54 (2017). doi:10.11648/j.wros.20170604.11.
- M. Yamin and B. W. Dharma, "Analisis Hujan Maksimum pada Daerah Aliran Sungai Babak Kabupaten Lombok Barat," Ganec Swara, 18 (3), (2024). doi:10.35327/gara.v18i3.1015.
- C. Ilinca and C. G. Anghel, "Frequency Analysis of Extreme Events Using the Univariate Beta Family Probability Distributions," Applied Sciences, 13 (7), pp. 122-124 (2023). doi:10.3390/app13074640
- F. Soehardi and M. Dinata, "Recent Analysis of Maximum Rain Period," International Journal of Engineering & Technology, 7 (2.3), pp. 63-67 (2018). doi:10.14419/ijet.v7i2.3.12323.
- M. A. Islam and H. Hasan, "Generation of IDF Equation from Catchment Delineation Using GIS," Civil Engineering Journal, 6 (3), pp. 540-547, (2020).
- V. T. Chow, D. R. Maidment and M. L. W., Applied Hydrology, McGraw-Hill, (1988).
- Z. P. Kirpich, "Time of Concentration of Small Agricultural Watersheds," Civil Engineering, 10 (6), (1940).
- Faradiba, "Analysis of Intensity, Duration, and Frequency Rain Daily of Java Island Using Mononobe Method," Journal of Physics Conference Series, 1783 (1), (2021). doi:10.1088/1742-6596/1783/1/012107.
- S. H. Br, Hidrologi: Teori, Masalah dan Penyelesaian., Yogyakarta: Nafiri Offset, (2000).
- A. Abbate, M. Papini and L. Longoni, "IDF Curve Modification Under Climate Change: A Case Study in the Lombardy Region Using EURO-CORDEX Ensemble," Atmosphere, 17 (1), (2025).
- M. Rosli, M. K. I. Muhammad and Z. Sa'ad, "Best Fit Distribution for Annual Maximum Rainfall Events: IDF Curve Construction for Sibu, Sarawak," in IOP Conference Series Earth and Environmental Science, (2024). doi:10.1088/1755-1315/1505/1/012016.
- M. Zaheer, H. Akhtar, L. Khalid, F. F. Rizvi, A. Nasir and F. Khan, "An assessment of the rational method's limitations for calculating runoff in Islamabad's urban areas: A Case Study EMAAR Housing Society," International Journal of Advanced Natural Sciences and Engineering Researches, 8 (8), pp. 99-106, (2024).
- S. Arsyad, Media Pembelajaran, Jakarta: Raja Grafindo Persada, (2006).
- S. B. Kafle, S. R. Karki, S. Puri, T. Chaudhary, S. Adhikari and S. Sharma, "Flood Inundation and Hazard Mapping of Seti Khola using ArcGIS and HEC-RAS," (2025). doi:10.13140/RG.2.2.12743.82081.
- A. U.-S. Siddique, M. R. Islam, S. M. Khan, S. Akter, M. S. Ashraf and A. M. Shad, "Flood Inundation Prediction for Bangali River Basin using HEC-HMS and HEC-RAS," in 7th International Conference on Advances in Civil Engineering, (2024).
- H. F. Abd-Elhamid, L. A. Franzetti, M. Zeleňáková and Y. Z. Kaya, "Development of Integrated Hydrologic and Hydrodynamic Models for Flood Modeling in Radiša Catchment at Western Slovakia using HEC-HMS and HEC-RAS," Natural Hazards, 121, pp. 22183-22209 (2025). doi:10.1007/s11069-025-07683-5.
- N. N. Zainal, S. Abu Talib, M. S. Abustan and M. A. Rashid, "Review Paper on Applications of the HEC-RAS Model for Flooding, Agriculture, and Water Quality Simulation," Water Practice & Technology, 19 (7), pp. 2883-2900 (2024). doi:10.2166/wpt.2024.173.
- G. Janicki, J. Rodzik and W. Kociuba, "Relationship Between Runoff and Sediment Transfer in a Slope–Gully Cascade System During Extreme Hydrological Events in the Lublin Upland, East Poland," Water, 17 (19), (2025). doi:10.3390/w17192875.
- P. Pelgay, J. Koci, B. Jarihani, S. Smithers and L. F. Buono, "Rainfall and Runoff Characteristics of Alluvial Gullies in the Upper Burdekin Catchment," Water, 17 (21), (2025). doi:10.3390/w17213071.
- K. Ly, G. Metternicht and L. Marshall, "Transboundary River Catchment Areas of Developing Countries: Potential and Limitations of Watershed Models for the Simulation of Sediment and Nutrient Loads. A Review," Journal of Hydrology: Regional Studies, 24, (2019). doi:10.1016/j.ejrh.2019.100605.
- H. Schmelzing and B. Schmalz, "Simulating Effectiveness of Low Impact Development (LID) for Different Building Densities in the Face of Climate Change Using a Hydrologic-Hydraulic Model (SWMM5)," Hydrology, 12 (8), (2025). doi:10.3390/hydrology12080200.
- S. Elga, B. Jan and B. Okke, "Hydrological Modelling of Urbanized Catchments: A Review and Future Directions," Journal of Hydrology, 529 (12), pp. 62-81 (2015). doi:10.1016/j.jhydrol.2015.06.028.
- D. Harisuseno, Prasetyorini, J. Sidqi and Chandrasasi, "An Empirical Model of Rainfall Intensity as a Function of Rainfall Duration and Probability of Occurrence," Journal of Water and Land Development, 56 (I-III), pp. 182-193 (2023). doi:10.24425/jwld.2023.143759.
- J. A. Raynal-Villasenor, "Log-Pearson Type III Distribution," in Frequency Analyses of Natural Extreme Events, A Spreadsheets Approach, (2021). doi:10.1007/978-3-030-86390-6.
- A. Jamel, "Generation Rainfall Intensity Equations for Intensity Duration Frequency (IDF) Curves (Case Study: Salah Al-Din, Iraq)," Instrumentation Mesure Métrologie, 23 (4), pp. 265-275 (2024). doi:10.18280/i2m.230402.
- J. Wang, D. Jia, X. Jiang, J. Qing, Z. Chen, J. Yang, M. Chena and T. Zeng, "Rapid Calculation Method for Minimum Navigable Fow Discharge in Backwater Zones of Small to Medium Rivers Based on Slope Correction," Water Science & Technology, 92 (12), pp. 1709-1726 (2025). doi:10.2166/wst.2025.179.
- I. W. Suparta, "Combining Hydraulic Roughness Measurement Results with Manning's Roughness Coefficient in Drainage Channels: A Case Study of Drainage Channels in Denpasar City, Bali Province," International Research Journal of Engineering IT & Scientific Research, 11 (5), pp. 130-140 (2025). doi:10.21744/irjeis.v11n5.2551.
- O. J. Aladesote, "Cost-Benefit Analysis of Green Infrastructure for Sustainable Stormwater Management of the Built Environment," International Journal of Research Publications, 97 (1), pp. 314-326 (2022). doi:10.47119/IJRP100971320222992.
- L.-W. Lu, M. F. Johnson, F. Zhu, Y. Xu, T. Ruan and F. K. S. C. Chan, "Harnessing the Runoff Reduction Potential of Urban Bioswales as an Adaptation Response to Climate Change," Scientific Reports, 14 (1), (2024). doi:10.1038/s41598-024-61878-7.
- A. A. Rachmayanie, S. R. Sari and M. D. Rizani, "Optimizing the Utilization of Retention Ponds as Sustainable Landscape Elements in Urban Educational Areas," Space Journal of the Built Environment, 8 (2), pp. 151-169 (2021). doi:10.24843/JRS.2021.v08.i02.p06.
- T. H. F. Wong, "Water Sensitive Urban Design - The Journey Thus Far," Australasian Journal of Water Resources, 10 (3), (2007). doi:10.1080/13241583.2006.11465296.
- L. Makhmudova, M. Moldakhmetov, A. Mussina, E. Kurmangazy, G. Kambarbekov, A. Zharylkassyn and M. Zhulkainarova, "Study of Water Stress in Plains Rivers: Climate and Human Influence," Evergreen, 11 (3), pp. 1530-1543 (2024). doi:10.5109/7236809.
- D. Hipparkar, Y. Keskar and S. Waghmare, "Revitalizing Urban Landscapes: A Case Study of Urban Green Spaces and Urban Greenways in Pune, India," Evergreen, 11 (3), pp. 1625-1640 (2024). doi:10.5109/7236817.
- T. D. Fletcher, W. Shuster, W. F. Hunt, R. Ashley, D. Butler, S. Arthur, S. Trowsdale, S. Barraud, A. Semadeni-Davies, J.-L. Bertrand-Krajewski, P. S. Mikkelsen, G. Rivard, M. Uhl, D. Dagenais and M. Viklander, "SUDS, LID, BMPs, WSUD and More - The Evolution and Application of Terminology Surrounding Urban Drainage," Urban Water Journal, 12 (7), pp. 525-542 (2014). doi:10.1080/1573062X.2014.916314.
- B. Chocat, P. Krebs, J. Marsalek, W. Rauch and W. Schilling, "Urban Drainage Redefined: From Stormwater Removal to Integrated Management," Water Science & Technology, 43 (5), (2001).
- C. F. Fratini, G. D. Geldof, J. Kluck and P. S. Mikkelsen, "Three Points Approach (3PA) for Urban Flood Risk Management: A Tool to Support Climate Change," Urban Water Journal, 1 (15), (2012). doi:10.1080/1573062X.2012.668913.
- J. Marsalek and B. Chocat, "International Report: Stormwater management," Water Science & Technology, 46 (6-7), pp. 1-17 (2002). doi:10.2166/wst.2002.0657.
- M. B. A. Amin, F. Alia and A. Dyharanisha, " Evaluation of the Feasibility of Retention Pond Infrastructure in Palembang City," HATHI, Medan, (2018). url: http://repository.unsri.ac.id/id/eprint/8481.
- B. A. Baskoro, “Planning a Retention Pond as an Effort to Reduce Flooding in the Upper Citarum River, Bandung Regency,” Malang: Universitas Brawijaya, (2018). url: https://repository.ub.ac.id/id/eprint/11796/.
- F. Chrétien, P. Gagnon, G. Thériault and M. Guillou, "Performance Analysis of a Wet-Retention Pond in a Small Agricultural Catchment," Journal of Environmental Engineering, 142 (4), (2016). doi:10.1061/(ASCE)EE.1943-7870.0001081.