
Abstract
The development of renewable energy is a key approach to reducing fossil fuel dependence. This study examines the effect of modifying duct geometry into a convergent nozzle shape in an Oscillating Water Column (OWC) system. Experiments were conducted in a laboratory wave flume using sensors to measure wave height and pressure across nine wave period variations. Results show that reducing the cross-sectional area increases pressure by 57% and velocity by 44%, consistent with Bernoulli’s principle. The maximum potential power in the laboratory-scale model was obtained at a wave height of 0.175 m and a wave period of 2.69 s. Using Froude scaling, this corresponds to a prototype wave height of approximately 1.75 m, generating 51.75 W.
Keywords: cross-sectional, duct, nozzle, OWC
Outline
1. Introduction
The escalation of Gross Domestic Product (GDP) and population growth in Indonesia continues to drive increasing energy demands1). Fossil fuels, which have long served as the primary energy source, are becoming increasingly scarce, with daily consumption in Indonesia reaching approximately 1.6 million barrels2). According to the Ministry of Energy and Mineral Resources, the country’s fossil fuel reserves are projected to be depleted within the next fifteen years if current consumption rates persist3). Consequently, developing renewable energy sources is essential to mitigate negative impacts of fossil fuel dependency. Ocean waves offer a high energy density and abundant availability among various renewable sources, promising clean energy alternative4).
Ocean waves originate from the oscillatory motion of fluid particles in a sinusoidal pattern, resulting in mass air movement in the form of waves. Global wave energy potential is estimated to reach approximately 32,000 TWh annually along offshore regions and about 2 TWh annually in coastal areas—values nearly equivalent to the world’s annual energy consumption5,6). This highlights the considerable potential of wave energy to replace fossil fuels and support a transition to cleaner, more sustainable energy systems. Among various types of Wave Energy Converters (WECs) developed over the past four decades, the Oscillating Water Column (OWC) has emerged as one of the most widely implemented technologies7). OWC systems convert ocean wave energy through a compress–decompress mechanism of fluid motion that generates pneumatic pressure using a Power Take-Off (PTO) mechanism. This process involves interaction between the ocean’s free surface and the air within a chamber8). The OWC consists of a chamber that converts wave energy into pneumatic energy, which is subsequently transformed into mechanical energy by a turbine and then converted into electrical energy via a generator8,9). OWC devices also exhibit a superior peak-to-average power ratio compared to other WECs, making them an efficient solution for wave energy extraction10).
This study addresses a research gap by investigating the effect of duct cross-sectional reduction using a convergent nozzle geometry. Theoretically, a nozzle is a conduit with a decreasing cross-sectional area that accelerates and directs fluid flow11). The Continuity Equation and Bernoulli’s Principle govern the acceleration process, where increased fluid velocity is associated with greater extractable power12). An experimental approach is employed using a laboratory-scale wave flume to analyze the influence of a convergent nozzle on airflow velocity, pressure distribution, and power potential. This study used regular waves with a fixed wave height of 0.175 m and nine wave period variations ranging from 2.06 s to 4.59 s. The wave height was intentionally maintained constant to isolate the effect of duct cross-sectional area reduction on OWC performance.
2. Literature Review
Several studies have explored the application of Oscillating Water Column (OWC) systems in wave energy conversion, focusing on key parameters such as wave height, wave period, and system geometry to optimize performance. A study by Adafiah13) investigated the potential of OWC systems to generate electricity from wave energy, specifically analyzing the influence of water height on current and voltage generation. The results indicated that optimal electrical output did not occur at the highest wave height. Instead, the system performed most efficiently under resonant wave conditions aligned with the OWC system's design parameters, highlighting the importance of matching wave characteristics with system resonance. Further, Supriyanto14) evaluated the hydrodynamic performance of two OWC configurations—L-shaped and U-shaped chambers—under varying wave heights and periods. The study found that chamber geometry redesign significantly affected the internal water oscillation behaviour, improving airflow velocity and pressure differentials within the chamber and duct sections. This finding emphasized the role of wave input variation in enhancing air movement and overall energy conversion efficiency. Marta15) supported these findings through an experimental study using a 1:10 scale wave flume model based on the Froude Scaling Law. Their study investigated the effects of wave conditions, tidal variations, and water depth on OWC performance. The results demonstrated that changes in wave height and period increased airflow velocity and chamber pressure differences, leading to higher RPM values of the turbine and, thus, greater power output potential.
Regarding nozzle design, Budiyanto16) compared the performance efficiency between convergent nozzles and convergent-divergent (CD) nozzles used in duct design. The study revealed that the convergent nozzle exhibited 8–12% higher efficiency than the CD nozzle configuration. The reduction in cross-sectional area effectively accelerated airflow, contributing to increased kinetic energy within the system. This finding was corroborated by Venkatesan17), who tested convergent nozzle performance at low wind speeds. Their results showed a velocity increase from 5 m/s to 8.86 m/s due to the Venturi effect, significantly enhancing energy conversion efficiency. Chada18) also demonstrated that fluid velocity consistently increased across the nozzle length with rising Mach numbers, maintaining a stable and predictable flow pattern.
Oscillating Water Column (OWC) technology has been extensively studied as one of the most mature and adaptable wave energy conversion systems. Comprehensive reviews have detailed the hydrodynamic principles governing OWC operation, including chamber resonance, air compressibility, and turbine coupling mechanisms19,20). Foundational theoretical analyses established the linear wave interaction theory and energy absorption mechanisms that determine OWC efficiency21-24). Subsequent experimental and numerical investigations validated hydrodynamic models under regular and irregular wave conditions, emphasizing the importance of resonance tuning between chamber geometry and incident wave period25-28). These studies collectively confirm that optimal performance is achieved when the natural frequency of the OWC chamber matches the dominant wave frequency.
Geometric optimization has been identified as a critical parameter affecting pneumatic power generation. Research on chamber configurations, breakwater-integrated OWCs, and offshore-mounted systems demonstrated that internal geometry significantly influences pressure oscillation amplitude and airflow velocity29-32). Advanced computational fluid dynamics (CFD) analyses further clarified airflow behavior, turbulence effects, and nonlinear wave–air interactions inside the chamber and duct system33-36). In particular, modifications to duct cross-sectional area and nozzle configurations have been shown to enhance airflow acceleration and pressure amplification in accordance with Bernoulli’s principle and the continuity equation37-40). Optimization approaches, including constructed design and multi-objective techniques, highlight that convergent duct geometries can significantly improve energy capture when properly tuned to wave conditions41-44).
Beyond hydrodynamic performance, turbine characteristics and power take-off (PTO) control strategies strongly influence overall system efficiency. Studies on Wells turbines and impulse turbines indicate that airflow rate and pressure fluctuations directly affect torque generation and electrical output45-48). Investigations into scale effects, wave climate variability, and irregular sea states emphasize the necessity of matching chamber
geometry and damping parameters to site-specific wave spectra49-52). More recent research has focused on hybrid offshore concepts, structural integration, and performance enhancement under varying wave periods53-56).
Despite substantial advancements in chamber and turbine optimization57-61), limited experimental studies have specifically examined the influence of convergent nozzle duct modifications under controlled wave period variations62-67).
Therefore, further investigation into duct cross-sectional reduction and its interaction with wave characteristics remains essential to improving OWC performance68-71). These studies collectively support the potential benefits of employing a convergent nozzle in OWC systems72-74), particularly in optimizing internal air dynamics and improving the overall efficiency of wave energy conversion75-76).
3. Methods
3.1. Experimental Setup
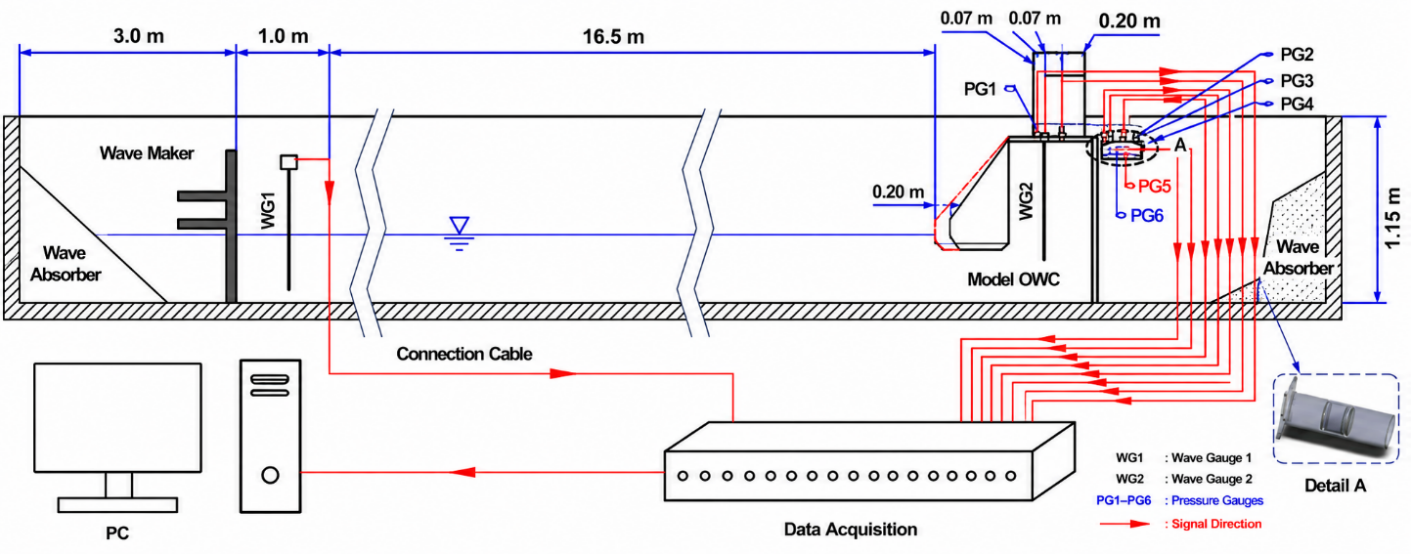
The experimental investigation was conducted using a two-dimensional wave flume with a width of 1 meter, a length of 36 meters, and a height of 1.5 meters. The maximum operational water depth was set at 0.8 meters, and the wave flume could generate wave periods ranging from 0.4 to 5 seconds. All tests were conducted at the Coastal Engineering Laboratory of the National Research and Innovation Agency (BRIN), certified under ISO 1702515). Wave generation was performed using a piston-type wave maker with a horizontally oscillating paddle manufactured by HR Wallingford. The configuration and spacing of the paddle followed the guidelines provided by Hydralab III16). The experiments employed two types of sensors: wave height gauge sensors (WG) and pressure gauge sensors (PG). The WG sensors used were resistive-type with an accuracy of ±0.5 mm, while the PG sensors were flush face pressure transducers with a diameter of 17 mm and an accuracy of 0.5% of the full-scale range14). Two WG sensors were used in total. WG1 was placed near the wave maker to measure the generated wave height, while WG2 was installed inside the OWC chamber to measure internal wave elevation. A total of six pressure gauge (PG) sensors were deployed. PG1 was installed inside the chamber, 70 mm from the chamber edge. PG2, PG3, and PG4 were positioned along the duct with a spacing of 60 mm between adjacent sensors. PG2 measured the static pressure, while PG3 and PG4 were used to evaluate the pressure distribution within the duct. PG5 and PG6 were installed below the duct, also separated by 60 mm, to measure the total pressure during the compression and decompression phases, respectively. An illustration of the wave flume setup and sensor placements is presented in Figure 1.
This study used regular waves with three variations in wave height and nine variations in wave period. Experiments were conducted using two duct configurations: a standard cylindrical duct with a diameter of 160 mm and a modified duct with a reduced cross-sectional area, forming a convergent nozzle. The reduction was achieved using a reducer, resulting in a duct outlet diameter of 120 mm with a 4:3 contraction ratio. The wave generation parameters and configurations for each test group are presented in Table 1.
Table 1: Experimental testing matrix
| Parameter | Variable | Variation Code | |
|---|---|---|---|
| H (m) | T (s) | ||
| Wave Generation (Scenario Test) | 0.175 | 2.06 | A4 |
| 2.37 | B4 | ||
| 2.69 | C4 | ||
| 3.00 | D4 | ||
| 3.32 | E4 | ||
| 3.64 | F4 | ||
| 3.95 | G4 | ||
| 4.27 | H4 | ||
| 4.59 | I4 | ||
| Model | Reduction in cross-sectional Without reduction in cross-sectional | ||
| Wave Conditions | Depth Water (d) = 0.75 m Regular Wave | ||
The procedure began with wave generation produced by a wave maker, based on the predefined variations in wave height and period set through the computer controller. During the wave generation process, the computer controller recorded WG and PG sensors. The generated waves moved from the wave maker along the wave flume until they entered the chamber, producing pressure that compressed the air above the water column and forced it into the duct. Pressure data acquisition was performed using the average of the peak sensor readings and the wave height difference once the wave generation reached a stable period upon entering the duct. The resulting pressure values were then converted into velocity using Bernoulli’s principle. The parameters and variables were scaled in a 1:10 model using the Froude Scaling Law, with consideration for full-scale marine environments. This principle in fluid flow modeling is based on the Froude number (Fr), which represents the ratio between inertial forces and gravitational forces in fluid flow. The scale model applied was 1:10, meaning that model size corresponds to one-tenth of the actual field dimensions.
3.2. Geometric Design
This study investigates the effect of cross-sectional area reduction in the duct section, which typically serves as the turbine installation location in an Oscillating Water Column (OWC) system.
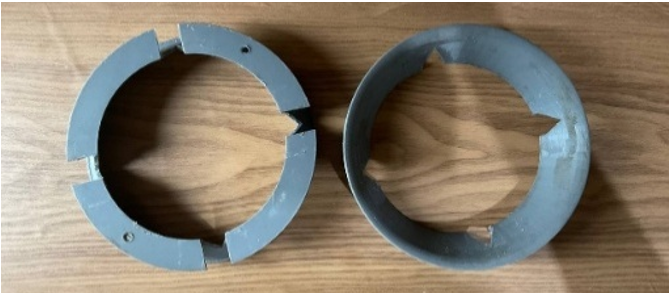
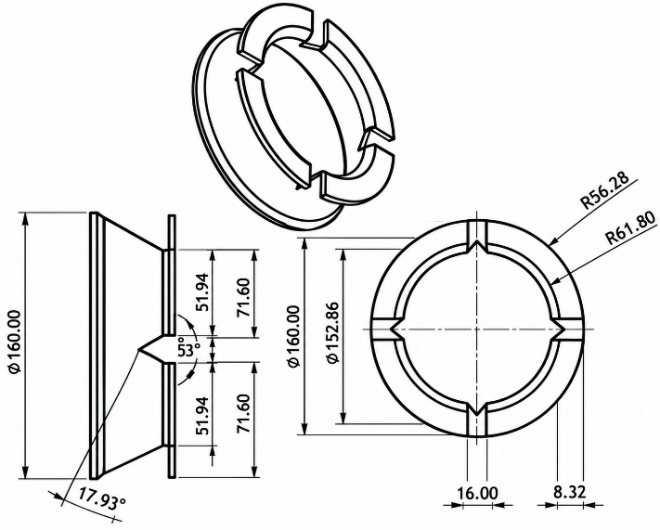
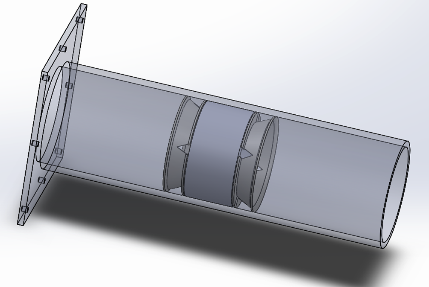
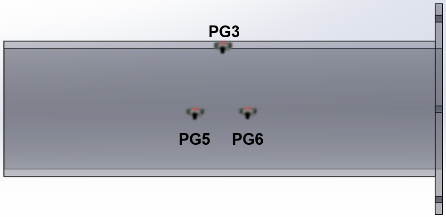
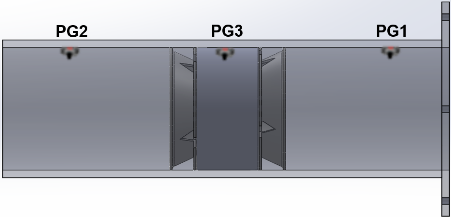
The reduction in cross-sectional area is modeled as a convergent nozzle geometry, which concentrates fluid flow and increases air velocity77). A nozzle is a component with a tapered structure designed to accelerate fluid by reducing the flow's cross-sectional area78). The convergent nozzle design was implemented by installing two reducers along the duct, with dimensions shown in Figure 2 and the installation scenario of reducers and sensors illustrated in Figure 3. The reducers were fabricated using 3D printing with PLA+ material, which offers easy manufacturing with smoother surfaces, minimizing disturbances to the fluid flow's aerodynamic behaviour79-81). The sensor placement in the wave flume follows the configuration scenario used by Marta15).
3.3. Data Collection and Analysis
The Oscillating Water Column (OWC) system utilizes the vertical motion of ocean waves to generate air pressure, which can then be converted into power potential82). The airflow inside an OWC chamber is inherently oscillatory and weakly compressible. However, the maximum measured airflow velocity in the present study remained below 20 m/s (Mach number < 0.06), indicating that compressibility effects are relatively small. Therefore, the airflow velocity was estimated using a quasi-steady Bernoulli-based approach, where the measured pressure difference was converted into an equivalent velocity during each compression and decompression phase. This formulation provides a first-order engineering estimate of airflow behaviour and is intended for comparative evaluation between duct configurations rather than for rigorous modelling of unsteady compressible flow81). For the duct configuration with a reduced cross-sectional area, the velocity equation is derived from Bernoulli's principle and adapted to the form of a venturi meter equation, as the geometry resembles that of a convergent nozzle82). The formulation is based on the wave height measurements obtained from the wave gauge (WG) sensors.
Meanwhile, for the duct configuration without cross-sectional reduction, the velocity model is simplified using Bernoulli’s Equation in the form typically applied to a pitot tube83), as expressed in the following equation, where P1 represents the pressure difference, and P2 denotes the static pressure.
The potential power generated in the duct section of the OWC system is influenced by the airflow rate entering the duct84), which the following equation can express.
4. Results
4.1. Effect of Duct Cross-Sectional Area Reduction on Pressure Compression and Decompression
Figure 4 demonstrates the effect of using a reducer the
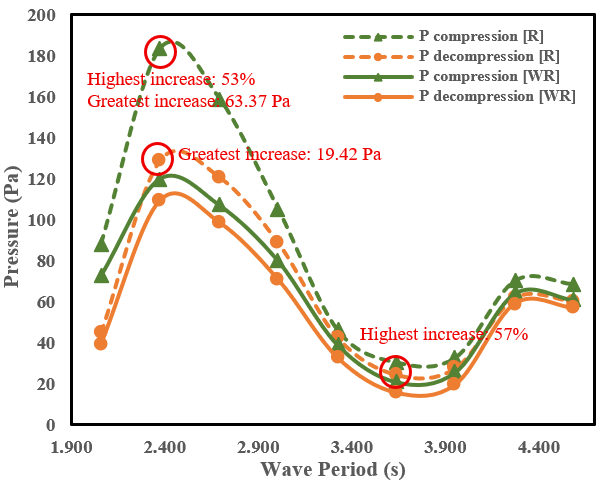
standard cylindrical duct configuration configured as a convergent nozzle, which effectively increases both the compression pressure (green line) and decompression pressure (orange line). During the compression phase, the highest percentage increase occurred in variation 2.37S wave period, reaching 53%, with the highest pressure increase also observed in 2.37S wave period at 63.37 Pa compared to the non-reduced duct configuration the convergent nozzle configuration. In the decompression phase, the highest percentage increase was recorded in variation 3.64S WAVE PERIOD at 57%, while the highest absolute pressure increase was again found in 2.37S WAVE PERIOD at 19.42 Pa. The graph shows that compression pressure values are consistently higher than decompression pressures. This is because, during the wave inflow, the water surface rises rapidly, significantly reducing the air volume above it and causing firm compression. Conversely, when the wave recedes and the water level drops, the decompression process is relatively slower and more gradual, resulting in lower pressure reduction than the compression phase85,86). When ocean waves interact with the OWC structure, the force distribution during compression tends to be more concentrated, whereas during decompression, it is more dispersed87). Based on the results of three repeated tests for each wave variation code, the obtained standard deviation ranged from 6% to 9%, indicating that the test results were obtained under stable testing conditions with a measuring instrument of sufficient accuracy. Moreover, it is evident that using a convergent nozzle to reduce the cross-sectional area effectively enhances pressures across various wave period variations.
4.2. Effect of Duct Cross-Sectional Area Reduction on Velocity Compression and Decompression
Figure 5 presents the effect of applying a reducer the standard cylindrical duct configuration in the form of a convergent nozzle, which enhances both the compression
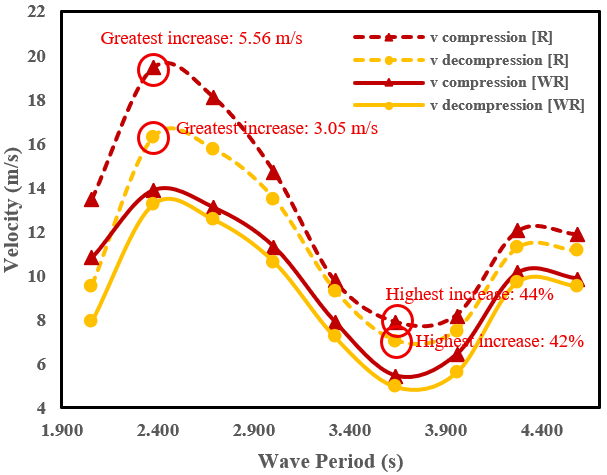
(red line) and decompression (blue line) velocity. The highest percentage increase was recorded in variation 3.64S wave period at 44% during the compression phase. In contrast, the highest absolute increase in compression velocity was observed in variation 2.37S wave period at 5.56 m/s compared to the configuration without cross-sectional area reduction the convergent nozzle configuration. In the decompression phase, the highest percentage increase was also found in variation 3.64S wave period at 42%, with the most significant velocity increase occurring in variation 2.37S wave period at 3.05 m/s. Similar to the phenomena in Figure 3, the reduction in cross-sectional area contributes to the increase in flow velocity, which aligns with the principle of the Continuity Law. This law states that the mass flow rate must remain constant throughout a streamline; therefore, when the cross-sectional area is reduced, the fluid velocity must increase accordingly to conserve the mass flow rate88,89). Three repetitions were conducted for each wave variation code, yielding a standard deviation between 5% and 12%. This range reflects stable experimental conditions and the use of a measuring instrument with adequate accuracy.
4.3. Effect of Duct Cross-Sectional Area Reduction on Potential Power
OWC system generates at a constant wave height of 0.175 m across various wave period configurations. Figure 6 demonstrates the influence of using a convergent nozzle the convergent nozzle configuration compared to a duct without cross-sectional area reduction the standard cylindrical duct configuration.
The highest percentage increase in potential power was observed in variation 3.64S wave period at 70%. In contrast, the most significant absolute power increase occurred in variation 2.37S wave period at 18.35 Watts compared to the configuration without area reduction. The using of a convergent nozzle does not consistently lead to power enhancement across all wave period variations. A decrease in power output was observed in variation D4 by 6% and in variation G4 by 2%. This reduction is attributed
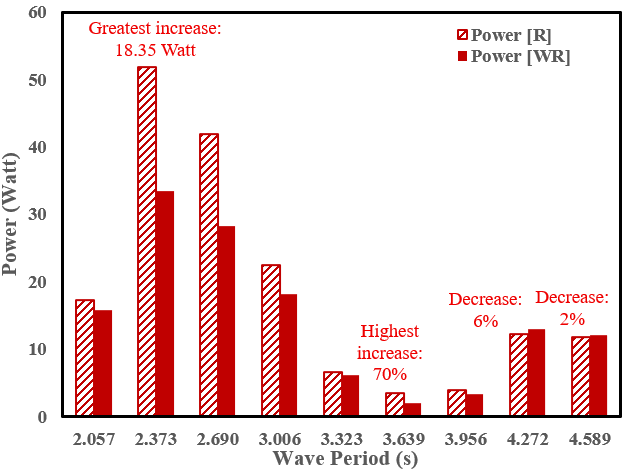
to the relatively insignificant velocity increase when the cross-sectional area is reduced, considering that fluid power is proportional to the cube of the velocity90). For each wave variation code, three test repetitions were performed, resulting in a standard deviation of 8-12% indicates that the measurements in stable conditions using a sufficiently accurate measuring device. Since the reduced area is smaller (with a 4:3 ratio), the observed velocity gains were insufficient to compensate for the reduction in area, as indicated by Equation 5.
5. Discussion
5.1. Correlation Between Free Surface Elevation (FSE) and Pressure
Figure 7 shows that water surface elevation (blue line) is directly proportional to the pressure value (green line); as the water surface rises—indicated by an increase in elevation—the air chamber volume decreases, leading to air compression and a subsequent increase in air pressure. Conversely, when the free surface elevation decreases, the pressure drops due to the expansion of the air volume. This behaviour aligns with Boyle’s Law, where the compressibility of air in the OWC chamber follows the principle that a decrease in volume
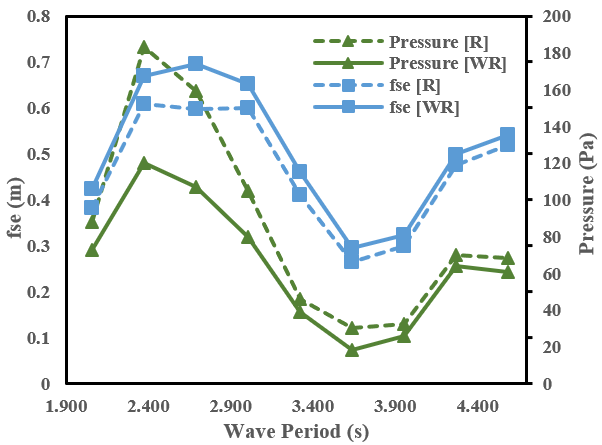
due to water displacement results in an increase in pressure90). The effect of cross-sectional area reduction the convergent nozzle configuration on water surface elevation shows a decrease in elevation values, as the convergent nozzle restricts the flow area, generating resistance to water movement within the chamber. This restriction limits the airflow entering the duct, causing more wave energy to be converted into air pressure rather than kinetic energy used to raise the water column. As a result, the elevation of the water surface is lower91). On the other hand, the pressure graph indicates that the reduced cross-sectional area hinders the airflow, and using a convergent nozzle accelerates pressure buildup due to the narrower air volume, thereby increasing pressure more effectively92).
5.2. Correlation Between Pressure and Velocity
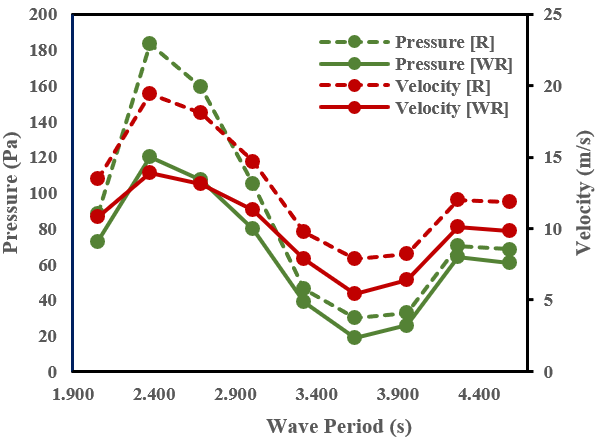
Figure 8 shows pressure vs. velocity which are calculated using Equation 2 for the test condition with cross-sectional reduction the convergent nozzle configuration and Equation 4 for the test condition without cross-sectional reduction the standard cylindrical duct configuration. The pattern across each variation is similar for both pressure and velocity. As the pressure increases, the velocity also increases. When pressure builds up within the chamber, the air expelled from the chamber undergoes a pressure-to-kinetic energy conversion, resulting in higher airflow velocity93). Similarly, in test conditions involving cross-sectional reduction, the velocity increases due to the narrowed outlet area, which accelerates fluid flow—transforming pressure into velocity following the Continuity Law94). When the wave rises, the water compresses the air within the chamber and forces the concentrated airflow through the convergent nozzle-shaped duct, leading to higher pressure and velocity. From both aspects shown in the graph, it can be concluded that there is a positive correlation between pressure and fluid velocity, with cross-sectional area reduction significantly enhancing both pressure and velocity.
5.3. Correlation Between Velocity and Potential Power
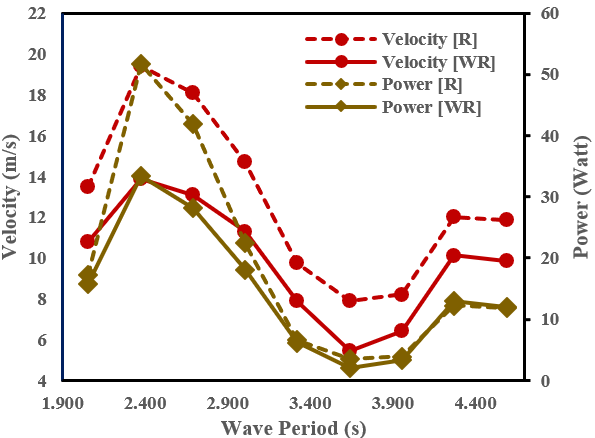
Figure 9 illustrates the correlation between airflow velocity and the potential power generated in the duct section of the OWC system. The potential power is calculated using Equation 5. The graph shows that velocity directly influences the power output generated by the OWC system. Although velocity increases across all test variations with cross-sectional reduction the convergent nozzle configuration, the resulting power output does not increase significantly. There are two test variations where the potential power is lower than the duct without cross-sectional reduction the standard cylindrical duct configuration. Despite the velocity increase due to the cross-sectional reduction, the gain is insufficient to compensate for the smaller cross-sectional area. As a result, the potential power produced under reduced cross-sectional area conditions is lower than that of the unreduced duct. From the comparison based on the substitution into Equation 5, where the duct radius is 60 mm with reduction and 80 mm without, it is found that—to achieve equivalent power output—the velocity in the reduced cross-sectional duct must be approximately 21.67% higher than that in the unreduced duct under the same wave height and period conditions.
Using the pressure transducer accuracy and the dimensional tolerance of the reducer geometry, the propagated uncertainty in the calculated power was estimated to be approximately ±2.2%. For the maximum power condition (51.75 W), the corresponding uncertainty was ±1.14 W. This uncertainty is significantly smaller than the observed performance differences between the two duct configurations, indicating that the reported trends are experimentally meaningful.
The test results suggest that the convergent nozzle design is more effective for short-period waves, as higher wave periods tend to increase pressure losses due to friction and energy dissipation, which hinder airflow95). If the target output is to maximize power output, the most effective configuration occurs at a wave height of 0.175 m and a wave period of 2.37 s. However, suppose the goal is to achieve the highest percentage increase in power output using a convergent nozzle. In that case, the optimal configuration occurs at the same wave height with a period of 3.64 s. Overall, the OWC system configuration with a convergent nozzle is most effective for low to moderate wave periods (T < 4 s), as it significantly enhances airflow velocity. These experimental results are supported by the field-scale application of an OWC in Cetraro, Italy96), which operates in small wave conditions ranging from 0 to 1 meter yet is capable of generating electricity effectively. Furthermore, the results also corroborate the CFD testing conducted by Budiyanto16), which demonstrated that a reduction in cross-sectional area can effectively increase air velocity and kinetic energy in the system. However, the convergent nozzle design may decrease potential power output at more extended wave periods due to increased pressure loss that impedes airflow efficiency.
5.4. Froude Scaling Law for Actual Conditions
This study applied the Froude Scaling Law to estimate the corresponding values under full-scale marine environments. The scaling was performed using a 1:10 ratio between the model and the prototype (Scale factor = λ = 10). For variation code 2.37S WAVE PERIOD, which exhibited the highest velocity increase, the estimation under actual conditions can be calculated accordingly.
Based on the calculations using the Froude Scaling Law, an OWC installation with the same modeling setup can effectively enhance airflow velocity through the duct, which can then be converted into potential power generation, without accounting for turbulence and energy losses. Under an actual wave height of 1.75 meters and a wave period of 7.5 seconds, with a reducer geometry of 1.6 meters at the inlet and 1.2 meters at the outlet, the airflow velocity is estimated to reach approximately 61.414 m/s.
It should be noted that the Froude Scaling Law preserves gravity-dominated hydrodynamic behavior but does not fully reproduce viscous and aerodynamic effects. At full scale, airflow inside the chamber and convergent nozzle may experience additional losses associated with turbulence generation, wall friction, flow separation, pneumatic damping, and exit kinetic energy losses.
Table 2: Actual condition using froude scaling law
| Scale Factor | Model Condition | Actual Condition | |
|---|---|---|---|
| Wave height | 0.175 meter | 1.75 meter | |
| Wave periode | 2.37 second | 7.5 second | |
| Nozzle geometry (inlet diameter) | 0.16 meter | 1.6 meter | |
| Nozzle geometry (outlet diameter) | 0.12 meter | 1.2 meter | |
| Velocity | 19.42 m/s | 61.414 m/s |
These effects scale nonlinearly with Reynolds number and flow velocity and may reduce the actual airflow velocity and power available to the turbine. Therefore, the prototype-scale values presented in Table 2 should be regarded as theoretical estimates rather than exact performance predictions.
A limitation of the present study is the use of a quasi-steady Bernoulli formulation to estimate airflow velocity. Although the airflow inside an OWC is inherently unsteady and compressible, the relatively low Mach numbers observed in the experiments (<0.06) justify the use of an incompressible approximation for comparative analysis. Future work should employ transient CFD simulations or direct velocity measurements to capture the full unsteady compressible behaviour of the airflow.
6. Conclusion
Based on the results and discussion regarding the reduction of duct cross-sectional area using a convergent nozzle in the Oscillating Water Column (OWC) system, it was found that an increase in fluid flow velocity and pressure occurs as the flow passes through the convergent nozzle during both compression and decompression phases across various wave period variations. The reduction in duct cross-sectional area enables pressure enhancement of up to 57% and velocity increase of up to 44% compared to the duct without cross-sectional decrease due to the convergent nozzle’s ability to accelerate and concentrate fluid flow, following Bernoulli’s Equation and the Continuity Law.
Furthermore, the experimental results indicate that using a convergent nozzle effectively increases the potential power generated in the duct section of the OWC system, particularly under low to moderate wave periods (T < 4 s), as it significantly enhances airflow velocity. However, at higher wave periods, the convergent nozzle design reduces power output due to increased pressure losses caused by friction and energy dissipation within the nozzle, which hinder airflow and reduce the efficiency of wave energy conversion. This study's most effective parameter combination for wave energy capture occurred at a wave height of 0.175 m and period of 2.69 s, resulting in a maximum potential power output of 51.75 Watts.
Acknowledgements
This research received full support from the Republic of Indonesia Defense University (RIDU) and Renewable Energy Program House of The National Research and Innovation Agency (BRIN).
Nomenclature
| Symbol | Description |
|---|---|
| Cross-Sectional Area (m2) | |
| Inlet Cross-Sectional Area (m2) | |
| Outlet Cross-Sectional Area (m2) | |
| Gravitational Acceleration (m/s) | |
| Wave Height (m) | |
| OWC | Oscillating Water Column |
| Inlet Flow Pressure (N/m2) | |
| Outlet Flow Pressure (N/m2) | |
| PG | Pressure Gauge |
| Potential Power of the OWC System (Watt) | |
| R | Reduced Cross-Sectional Area Variation |
| Inlet Flow Velocity (m/s) | |
| Outlet Flow Velocity (m/s) | |
| WG | Wave Height Gauge |
| WR | Non-Reduced Cross-Sectional Area Variation |
| Air Density (kg/m3) |
References
- G. Mombekova, M. Nurgabylov, A. Baimbetova, B. Keneshbayev, and B. Izatullayeva, "The Relationship Between Energy Consumption, Population and Economic Growth in Developing Countries" International Journal of Energy Economics and Policy, 14 (3) 368-374 (2024). https://doi.org/10.32479/ijeep.15614. [DOI]
- N. A. Pamabudi, R. A. Firdaus, R. Rizkiana, D. K. Ulfa, M. S. Salsabila, Suharno, and Sukatiman, "Renewable Energy in Indonesia: Current Status, Potential, and Future Development", Sustainability, 15 (2342) (2023).https://doi.org/10.3390/su15032342. [DOI]
- A. E. Setyono, and B. F. T. Kiono, " From Fossil Energy to Renewable Energy: A Snapshot of Indonesia’s Oil and Gas Sector (2020–2050)", JEBT, 2 (3) 154-162 (2021). https://doi.org/10.14710/jebt.2021.11157. [DOI]
- H. H. Lee, G. F. Chen, and H. Y. Hsieh, "Study on an Oscillating Water Column Wave Power Converter Installed in an Offshore Jacket Foundation for Wind-Turbine System Part I: Open Sea Wave Energy Converting Efficiency", Journal of Marine Science and Engineering, 9 (133) (2021). https://doi.org/10.3390/jmse9020133. [DOI]
- E. A. P. Junior, S. S. Oliveira, P. H. Oleinik, B. N. Machado, L. A. O. Rocha, M. N. Gomez, E. D. Santos, J. M. P. Conde, and L. A. Isoldi, "Geometric Evaluation of the Hydro-Pneumatic Chamber of an Oscillating Water Column Wave Energy Converter Employing an Axisymmetric Computational Model Submitted to a Realistic Sea State Data", Journal of Marine Science and Engineering, 12 (1620) (2024). https://doi.org/10.3390/jmse12091620. [DOI]
- K. Gunn, and C. S. Williams, "Quantifying the global wave power resource", Renewable Energy, 44 296-304 (2012).https://doi.org/10.1016/j.renene.2012.01.101. [DOI]
- J. A. L. Leyza, C. B. Silva, L. F. S. Leyva, and M. F. G. Romero, "Simulation and Characteristics Analysis of On-Shore OWC System Proposal as Distributed Generation Resource Considering the Irregular Wave Interaction". Electronics, 10 (773) (2021). https://doi.org/10.3390/electronics10070773. [DOI]
- R. P. Maciel, P. H. Oleinik, E. D. D. Santos, L. A. O. Rocha, B. N. Machado, M. N. Gomes, and L. A. Isoldi, "Constructal Design Applied to an Oscillating Water Column Wave Energy Converter Device under Realistic Sea State Conditions" Journal of Marine Science and Engineering, 11 (2174) (2023). https://doi.org/10.3390/jmse11112174. [DOI]
- J. Lian, X. Wang, X. Wang X, and D. Wu, "Research on Wave Energy Converters", Energies. 17 (1577) (2021). https://doi.org/10.3390/en17071577. [DOI]
- R. Gayathri, J. Y. Chang, C. C. Tsai, and T. W. Hsu, "Wave Energy Conversion through Oscillating Water Columns: A Review", Journal of Marine Science and Engineering, 12 (342) (2024). https://doi.org/10.3390/jmse12020342. [DOI]
- O. Wilhelmsen, and A. Aasen, "Choked liquid flow in nozzles: Crossover from heterogeneous to homogeneous cavitation and insensitivity to depressurization rate", Chemical Engineering Science, 248 (117176) (2022). https://doi.org/10.1016/j.ces.2021.117176. [DOI]
- S. B. Hong, H. S. Yun, M. K. Cho, "Application of the Bernoulli Effect for Improving Smoke Exhaust Efficiency in Tunnel Fires", IEEE, (2023). https://doi.org/10.1109/ACCESS.2023.3318864. [DOI]
- E. Supriyanto, A.T. Rohman, A. I. Malakani, I. Y. Ikhsanudin, A. Wibowo, M. T. Suryantoro, A. Musthofa, R. T. Soewono, M. P. Helios, A. D. Nugraha, Deerdarlianto, and A. S. D. Marta, "Experimental study of flow characteristics in hydrodynamic and aerodynamic L-shaped and U-shaped oscillating water column chambers", Result in Engineering 25 (103762) (2025). https://doi.org/10.1016/j.rineng.2024.103762. [DOI]
- S. R. Adafiah, A. F. Pratiwi, and S. Rahmat, " Design and Construction of a Wave Power Plant Using an Oscillating Water Column System", Jurnal Infotekmesin, 12 (01) 42-49 (2021). https://doi.org/10.35970/infotekmesin.v12i1.412. [DOI]
- A. S. D. Marta, Deendarlianto, Indarto, Sarija, S. Kamal, and E. Winata, "Performance of OWC-Type Wave Power Plants in the Waters of Sumbawa Island, Indonesia" ICTPEP, (2024). https://doi.org/10.1109/ICT-PEP63827.2024.10733542. [DOI]
- M. A. Budiyanto, J. Novri, M. I. Alhamid, and Ardiyansyah, "Analysis of convergent and divergent-convergent nozzle of waterjet propulsion by CFD simulation", IMAT, (2018). https://doi.org/10.1063/1.5086613. [DOI]
- S. P. Venkatesan, J. K. Soni, and A. Burugpalli, "Increasing Efficiency of a Wind Turbine Using a Convergent Nozzle in Combination with a Flanged Diffuser", International Journal of Applied Engineering Research 10 (11) 10234-10240 (2015).
- J. S. R. Chada, S. R. D. Akella, S. C. Jalli, S. S. H. Challa, "Study of Flow Characteristics in a Convergent And Divergent Nozzle Using Computational Fluid Dynamics", International Journal of Scientific Research and Engineering Development, 4 (3) 1526-1533 (2021).
- A. Falcão and J. Henriques, “Oscillating-water-column wave energy converters and air turbines: A review,” Renewable Energy, vol.85, pp.1391-1424 (2016). https://doi.org/10.1016/j.renene.2015.07.086 [DOI]
- T. V. Heath, “A review of oscillating water columns,” Philos Trans A Math Phys Eng Sci, vol.370(1959), pp.235-245 (2012). https://doi.org/10.1098/rsta.2011.0164 [DOI]
- S. Sugianto, R. T. Lopa, R. Karamma and C. Paotonan, “Wave reflection in oscillating water column (OWC) type breakwater,” zonalaut, vol.4(3), pp.344-352 (2023). https://doi.org/10.62012/zl.v4i3.31730 [DOI]
- M. d. N. Gomes et al., “Constructal design applied to geometric shapes analysis of wave energy converters,” Defect Diffus. Forum, vol.407, pp.147-160 (2021). https://doi.org/10.4028/www.scientific.net/DDF.407.147 [DOI]
- E. Didier and P. R. F. Teixeira, “Performance of an oscillating water column wave energy converter integrated with three types of harbor protection structures,” Defect Diffus. Forum, vol.427, pp.63-73 (2023). https://doi.org/10.4028/p-BL5v8v [DOI]
- Ş. N. E. Bozkurtoğlu, “Experimental validation of power output and efficiency for an oscillating water column (OWC),” J. Nav. Archit. Mar. Technol., vol.225, pp.54-72 (2024). https://doi.org/10.54926/gdt.1405048 [DOI]
- H. Martins-Rivas and C. C. Mei, “Wave power extraction from an oscillating water column at the tip of a breakwater,” J. Fluid Mech., vol.624, pp.351-372 (2009). https://doi.org/10.1017/S0022112008005072 [DOI]
- A. Babarit, “Comparison of wave energy converter efficiency,” Renew. Sust. Energy Rev., vol.54, pp.1009-1027 (2016). https://doi.org/10.1016/j.rser.2015.10.107 [DOI]
- J. Cruz (Ed.), “Ocean Wave Energy: Current Status and Future Perspectives,” Springer, pp. 45-78 (2008). https://doi.org/10.1007/978-3-540-74895-3 [DOI]
- G. Iglesias and R. Carballo, “Design of OWC chambers for enhanced resonance,” Energy, vol. 147, pp. 128-137 (2018). https://doi.org/10.1016/j.energy.2018.01.033 [DOI]
- K. Budal, “Theory for efficiency of OWC devices,” Ocean Eng., vol. 10(1), pp. 1-12 (1983). https://doi.org/10.1016/0029-8018(83)90013-0 [DOI]
- D. Evans, “Power from ocean waves,” Annu. Rev. Fluid Mech., vol. 18, pp. 405-435 (1986). https://doi.org/10.1146/annurev.fl.18.010186.002201 [DOI]
- M. Zhao and D. Ning, “A review of numerical methods for studying hydrodynamic performance of oscillating water column (OWC) devices,” Renew. Energy, 233, 121177 (2024). https://doi.org/10.1016/j.renene.2024.121177. [DOI]
- J. Falnes, “Ocean Waves and Oscillating Systems,” Cambridge Univ. Press, pp. 212-238 (2002). https://doi.org/10.1017/CBO9780511546046 [DOI]
- S. Chakrabarti, “Hydrodynamics of wave energy systems,” Appl. Ocean Res., vol. 18, pp. 143-153 (1996). https://doi.org/10.1016/0141-1187(96)00015-3 [DOI]
- W. Zhang et al., “CFD study of airflow in OWC turbines,” Renew. Energy, vol. 103, pp. 102-111 (2017). https://doi.org/10.1016/j.renene.2016.11.025 [DOI]
- X. Luo and X. Gao, “Numerical simulation of OWC in irregular waves,” Ocean Eng., vol. 147, pp. 245-256 (2018). https://doi.org/10.1016/j.oceaneng.2017.10.035 [DOI]
- M. Hall and P. Veitch, “Performance evaluation of UWC devices,” Renew. Energy, vol. 29, pp. 1909-1921 (2004). https://doi.org/10.1016/j.renene.2004.02.010 [DOI]
- J. Orphin, J. Nader, and I. Penesis, “Size matters: Scale effects of an OWC wave energy converter,” Renew. Energy, 185, 111–122 (2022). https://doi.org/10.1016/j.renene.2021.11.121. [DOI]
- M. Rosati, J.C.C. Henriques, and J.V. Ringwood, “Oscillating-water-column wave energy converters: A critical review of numerical modelling and control,” Energy Convers. Manag.: X, 16, 100322 (2022). https://doi.org/10.1016/j.ecmx.2022.100322. [DOI]
- V. Venugopal and M. Kumar, “Dual OWC breakwater systems,” Ocean Eng., vol. 165, pp. 452-463 (2018). https://doi.org/10.1016/j.oceaneng.2018.07.039 [DOI]
- B. Dias and R. Cavaleri, “Air-sea interaction in OWC,” Quart. J. Mech. Appl. Math., vol. 67, pp. 201-224 (2014). https://doi.org/10.1093/qjmam/hbt027 [DOI]
- Y. Li and Z. Song, “Effect of duct shape on OWC performance,” Energy Convers. Manage., vol. 85, pp. 567-576 (2013). https://doi.org/10.1016/j.enconman.2014.04.053 [DOI]
- H. Young et al., “Breaking wave effects on OWC,” Coast. Eng., vol. 78, pp. 90-104 (2013). https://doi.org/10.1016/j.coastaleng.2013.03.007 [DOI]
- F. Johnson and G. Sharpe, “Wave climate influence on OWC,” Renew. Energy, vol. 41, pp. 298-307 (2012). https://doi.org/10.1016/j.renene.2011.10.033 [DOI]
- E. Carballo et al., “Optimization of OWC air turbines,” Energy, vol. 125, pp. 776-789 (2017). https://doi.org/10.1016/j.energy.2017.02.134 [DOI]
- J. Ellison, “OWC for island power,” IEEE Trans. Energy Convers., vol. 22(3), pp. 564-572 (2007). https://doi.org/10.1109/TEC.2007.895467 [DOI]
- M. Özkan and F. Aksoylu, “Experimental study on partial chamber OWC,” Exp. Therm. Fluid Sci., vol. 53, pp. 81-90 (2014). https://doi.org/10.1016/j.expthermflusci.2013.11.006 [DOI]
- S. Ferrer and A. Falcão, “Wave energy forecasting for OWC,” Renew. Energy, vol. 92, pp. 389-400 (2016). https://doi.org/10.1016/j.renene.2016.02.029 [DOI]
- P. Sutherland et al., “Air turbine control in OWC devices,” J. Sound Vib., vol. 332, pp. 2340-2354 (2013). https://doi.org/10.1016/j.jsv.2012.11.025 [DOI]
- J. Falnes et al., “OWC operating in random seas,” Ocean Eng., vol. 31(10), pp. 1263-1278 (2004). https://doi.org/10.1016/j.oceaneng.2003.11.002 [DOI]
- B. Bahaj et al., “Experimental validation of OWC devices,” Renew. Energy, vol. 33, pp. 1750-1759 (2008). https://doi.org/10.1016/j.renene.2007.09.023 [DOI]
- T. Babarit and O. Clément, “Optimal PTO damping,” Appl. Ocean Res., vol. 30, pp. 289-297 (2008). https://doi.org/10.1016/j.apor.2008.09.002 [DOI]
- G. Iglesias et al., “L-shaped OWC geometry comparison,” Energy, vol. 142, pp. 225-236 (2018). https://doi.org/10.1016/j.energy.2017.10.024 [DOI]
- A. Babarit, “A database of capture width ratio of wave energy converters,” Renew. Energy, 80, 610–628 (2015). https://doi.org/10.1016/j.renene.2015.02.049. [DOI]
- N. Hashimoto et al., “Scale model OWC tests,” Exp. Fluids, vol. 51, pp. 331-343 (2011). https://doi.org/10.1007/s00348-011-1052-y [DOI]
- H. Renzi and D. Dias, “Nonlinear wave effects in OWC,” Phys. Fluids, vol. 27, pp. 076601 (2015). https://doi.org/10.1063/1.4926487 [DOI]
- M. Thomas and K. Williamson, “Offshore OWC support structures,” Mar. Struct., vol. 49, pp. 215-229 (2016). https://doi.org/10.1016/j.marstruc.2016.06.002 [DOI]
- J. Clément et al., “OWC integration with coastal structures,” Renew. Sust. Energy Rev., vol. 18, pp. 237-245 (2013). https://doi.org/10.1016/j.rser.2012.10.022 [DOI]
- C. Guedes Soares, “Wave energy conversion fundamentals,” Ocean Eng., vol. 37(14), pp. 2560-2570 (2010). https://doi.org/10.1016/j.oceaneng.2010.02.008 [DOI]
- F. Dias et al., “Response amplitude operators for OWC,” J. Offshore Mech. Arct. Eng., vol. 136(1), pp. 011101 (2014). https://doi.org/10.1115/1.4024874 [DOI]
- S. Ahmed and L. Yu, “Pneumatic power analysis in OWC,” Energy Convers. Manage., vol. 89, pp. 112-121 (2015). https://doi.org/10.1016/j.enconman.2014.09.055 [DOI]
- A. Bahaj and L. Myers, “Wave energy resource assessment,” Renew. Energy, vol. 34, pp. 1602-1616 (2009). https://doi.org/10.1016/j.renene.2008.11.017 [DOI]
- R. Lopez et al., “Design selection and geometry in OWC wave energy converters for performance,” Energies, vol. 14(6), pp. 1707 (2021). https://doi.org/10.3390/en14061707 [DOI]
- H. Yamamoto et al., “Breakwater OWC prototype results,” Coast. Eng. J., vol. 62, pp. 307-320 (2020). https://doi.org/10.1080/21664250.2020.1751336 [DOI]
- A. Isaacs, “Wave power and OWC viability,” IEEE Power Eng. Rev., vol. 21, pp. 56-61 (2001). https://doi.org/10.1109/MPER.2001.956241 [DOI]
- O.M. Faltinsen, Sea Loads on Ships and Offshore Structures, Cambridge University Press (1990). https://doi.org/10.1017/CBO9780511628932. [DOI]
- D. McCabe, “Performance curves for Wells turbines,” J. Turbomach., vol. 131(4), pp. 041003 (2009). https://doi.org/10.1115/1.3072648 [DOI]
- S. Kim and Y. Jeong, “CFD investigation of resonance effects in OWC,” Ocean Eng., vol. 179, pp. 129-140 (2019). https://doi.org/10.1016/j.oceaneng.2019.03.024 [DOI]
- R. Saha and A. Chatterjee, “Multi-objective optimization in OWC,” Energy, vol. 129, pp. 434-445 (2017). https://doi.org/10.1016/j.energy.2017.04.089 [DOI]
- J. Lin and Z. Zhou, “Turbulence modeling for OWC airflow,” Comput. Fluids, vol. 193, pp. 104281 (2019). https://doi.org/10.1016/j.compfluid.2019.104281 [DOI]
- K. Yao and M. Guo, “Aerodynamic loads in OWC ducts,” Renew. Energy, vol. 134, pp. 1021-1033 (2019). https://doi.org/10.1016/j.renene.2018.11.092 [DOI]
- V. Sharma and P. Mishra, “Effects of wave steepness on OWC,” Ocean Eng., vol. 183, pp. 106-117 (2019). https://doi.org/10.1016/j.oceaneng.2019.04.102 [DOI]
- R. Masuda et al., “Experimental study of U-OWC devices,” J. Hydrodyn., vol. 28(3), pp. 414-426 (2016). https://doi.org/10.1016/S1001-6058(16)60647-9 [DOI]
- D. Rusu and G. Onea, “Performance of small scale OWC,” Renew. Energy, vol. 89, pp. 473-485 (2016). https://doi.org/10.1016/j.renene.2015.11.085 [DOI]
- H. Lee and G.-F. Chen, “Offshore wind and wave energy hybrid systems,” Renew. Sust. Energy Rev., vol. 96, pp. 293-305 (2018). https://doi.org/10.1016/j.rser.2018.08.010 [DOI]
- A. Mathiesen et al., “OWC energy capture under irregular waves,” Ocean Eng., vol. 188, pp. 106426 (2019). https://doi.org/10.1016/j.oceaneng.2019.106426 [DOI]
- P. Le Roux et al., “Turbine control strategies in OWC converters,” Appl. Energy, vol. 253, pp. 113568 (2019). https://doi.org/10.1016/j.apenergy.2019.113568. [DOI]
- Mellyanto, "Numerical Analysis of a Convergent-Divergent Nozzle in a Steam Turbine" Medan, UMSU, (2019).
- Y.A. Çengel and J.M. Cimbala, Fluid Mechanics: Fundamentals and Applications, 1st ed., McGraw-Hill Higher Education (2006). ISBN: 978-0-07-124934-8.
- M. S. Alsoufi, and A. E. Elsayed, "How Surface Roughness Performance of Printed Parts Manufactured by Desktop FDM 3D Printer with PLA+ is Influenced by Measuring Direction", American Journal of Mechanical Engineering, 5 (5) 211-222 (2017). https://doi.org/10.12691/ajme-5-5-4. [DOI]
- L. Cui, S. Zheng, Y. Zhang, J. Miles, and G. Iglesias, "Wave power extraction from a hybrid oscillating water column-oscillating buoy wave energy converter", Renewable and Sustainable Energy Reviews. 135 (10234) (2021). https://doi.org/10.1016/j.rser.2020.110234. [DOI]
- J.P. Holman, Heat Transfer, 10th ed., McGraw-Hill Higher Education (2010). ISBN: 978-0-07-352936-3.
- Akpan, and P. U. Obong, "A CFD Simulation of Water Flow Through a Variable Area Venturi Meter", International Journal of Current Research, 6 (03) 5425-5431 (2014).
- T. Chau, H. Nguyen, H. Ly, I. Ghazali, D. Nguyen, and T. Nguyen, "A low-cost pitot tube-based experimental model for active teaching-learning of applied fluid mechanics: A demonstration from NTTU", Engineering Science Letter, 2 (3) 84-91 (2023). https://doi.org/10.56741/esl.v2i03.432. [DOI]
- A. S. D. Marta, Deendarlianto, W. Kongko, and Aprijanto, "The Influence of Wave Characteristics, Tides, and Installation Conditions of L-Shaped OWC Wave Energy Converter on Energy Absorption Capability" Evergreen, 11 (03) 2607-2617 (2024). https://doi.org/10.5109/7236900. [DOI]
- K. Ram, M. Faizal, M. R. Ahmed, and Y. H. Lee. "Experimental studies on the flow characteristics in an oscillating water column device", Journal of Mechanical Science and Technology, 24 (10) 2043-2050 (2010). https://doi.org/10.1007/s12206-010-0621-z. [DOI]
- E. A. Pinto Jr., M. das N. Gomes, L. A. O. Rocha, E. D. dos Santos, and L. A. Isoldi, “Evaluation of Static Pressure Behavior in an Oscillating Water Column Wave Energy Converter,” Eng. Térmica, vol. 18, no. 1, pp. 36–42 (2019). doi:10.5380/reterm.v18i1.67045.
- D. Z. Ning, R. Q. Wang, Y. Gou, M. Zhao, and B. Teng, "Numerical and experimental investigation of wave dynamics on a land-fixed OWC device", Energy, 115 326-337 (2016). https://doi.org/10.1016/j.energy.2016.09.001. [DOI]
- Md. Towhiduzzaman, "Performance Analysis of Continuity Equation and Its Applications", EJERS. 1 (5) 40-43 (2016). https://doi.org/10.24018/ejeng.2016.1.5.201 [DOI]
- J. F. Manwell, J. G. McGowan, and A. L. Rogers. "Wind Energy Explained: Theory, Design, and Application", 2nd ed, Noida: Wiley: (2009). https://doi.org/10.1002/9781119994367. [DOI]
- D. Z. Ning, S. Ke, R. Mayon, and C. Zhang, "Numerical Investigation on Hydrodynamic Performance of an OWC Wave Energy Device in the Stepped Bottom", Frontiers in Energy Research, 7 (152) (2019). https://doi.org/10.3389/fenrg.2019.00152. [DOI]
- G. Xie, C. Hu, D. Li, Y. Ma, X. Zhang, and Y. Zhu, “Hydrodynamic Performance Investigations of OWC and Hybrid System: Geometry of OWC and Rectangular Submerged Breakwater,” J. Mar. Sci. Eng., 12 (12), 2191 (2024). https://doi.org/10.3390/jmse12122191. [DOI]
- M. Huang, Y. Kang, X. Wang, Y. Hu, D. Li, C. Cai, and F. Chen, "Effects of Nozzle Configuration on Rock Erosion Under a Supercritical Carbon Dioxide Jet at Various Pressures and Temperatures", Applied Sciences, 7 (606) (2017). https://doi.org/10.3390/app7060606. [DOI]
- A. F. Falcao, "Wave energy utilization: A review of the technologies", Renewable and Sustainable Energy Reviews 14 899-918 (2010). https://doi.org/10.1016/j.rser.2009.11.003. [DOI]
- T. Jiang, Z. Huang, J. Li, Y. Zhou, and C. Xiong, "Effect of Nozzle Geometry on the Flow Dynamics and Resistance Inside and Outside the Cone-Straight Nozzle", ACS Omega, 7 9652-9665 (2022). https://doi.org/10.1021/acsomega.1c07050. [DOI]
- C. P. Tsai, C. H. Ko, and Y. C. Chen, "Investigation on Performance of a Modified Breakwater-Integrated OWC Wave Energy Converter", Sustainability, 10 (643) (2018). https://doi.org/10.3390/su10030643. [DOI]
- G. Cannata, M. Simone, and F. Gallerano. Numerical "Investigation into the Performance of an OWC Device under Regular and Irregular Waves", Journal of Marine Science and Engineering 11 (735) (2023). https://doi.org/10.3390/jmse11040735. [DOI]