
Abstract
This study analyzes passenger characteristics of sleeper bus users on the Malang–Jakarta corridor to assess the potential for promoting low-carbon intercity mobility. Using quantitative methods with 215 respondents, we examined demographic profiles, travel patterns, and their relationships through chi-square analysis. Results indicate that young adults (21–30 years, 68.8%) with higher education levels dominate ridership, primarily traveling for recreation and family visits. The significant association between age and travel purpose suggests differentiated travel motivations across age groups, which may be relevant for understanding user segmentation in intercity public transport (χ² = 62.252, p = 0.001). The preference for quality-oriented operators such as Juragan 99 suggests that service attributes related to comfort and reliability are valued by sleeper bus users, without implying a direct causal effect on mode choice. These findings provide contextual insights that may inform discussions on the role of sleeper bus services within broader intercity transport planning, without implying direct sustainability impacts.
Keywords: Green Asia, Indonesia transportation, modal shift, passenger behavior, service quality, sleeper bus, sustainable intercity mobility
Outline
1. Introduction
Intercity bus transportation plays an important role in providing comfort-oriented public transport services for long-distance travel. However, its contribution to sustainable mobility depends on how such services align with user preferences and broader transport system conditions1). The Malang–Jakarta route has become one of the most in-demand corridors, driven by increasing travel needs in the business, education, and tourism sectors.
Sleeper bus services offer distinctive features such as fully reclining seats, private cabins, and personalized amenities, creating a premium travel experience. These facilities—rarely available in standard intercity buses—allow passengers to rest more comfortably, reduce fatigue, and achieve higher satisfaction during long trips1). Major operators, including Juragan 99 Trans, Rosalia Indah, and Sinar Jaya, actively compete to deliver superior service quality to attract and retain customers. Moreover, passenger perception of comfort is also influenced by factors such as punctuality, cleanliness, and the attentiveness of staff2).
To maintain a competitive edge, operators are increasingly integrating technology and service innovations into sleeper bus offerings. Features such as real-time travel updates, mobile ticketing, and app-based seat selection improve convenience and allow passengers to plan their journeys more efficiently3). In addition, attention to cabin ergonomics, including vibration reduction, adjustable lighting, and climate control, enhances overall comfort and supports longer, fatigue-free travel. Marketing strategies are also tailored according to passenger demographics, with younger travelers seeking affordable and flexible options, while professionals and older passengers often prioritize privacy, premium amenities, and a seamless travel experience4). In combining high-quality vehicle design with attentive service and personalized offerings, sleeper bus operators are able to foster customer satisfaction, loyalty, and long-term growth in an increasingly competitive intercity transport market5).
In the context of growing competition, passenger satisfaction is strongly linked to service quality, facility comfort, and pricing6). Elements such as seat spacing, cabin cleanliness, punctuality, and staff responsiveness significantly influence user satisfaction. The emergence of sleeper buses can thus be regarded as an adaptive response to rising passenger expectations for more personalized and comfortable intercity travel services7). As travelers increasingly prioritize comfort and convenience, operators are compelled to innovate and differentiate their offerings8). Features such as fully reclining seats, private cabins, and in-cabin entertainment systems help meet these demands, enhancing the overall travel experience. Consequently, the success of sleeper bus services depends not only on vehicle design but also on consistently high-quality service delivery9).
Moreover, analyzing passenger demographics and travel patterns provides critical insights for enhancing sleeper bus services. Research shows that the 21–30 age group primarily travels for recreation, family visits, and business trips, often seeking a balance between comfort and cost, whereas students aged 18–20 prioritize affordability and convenience for vacations or returning home10). Operators can use this data to design targeted services, such as offering fle xible pricing packages, premium seat options, or in-cabin entertainment tailored to specific age groups. Operational factors, including minimizing vibration through improved suspension systems, maintaining strict punctuality, and ensuring cabin cleanliness, also directly affect passenger comfort and satisfaction11). In combining data-driven service segmentation with high-quality vehicle design and attentive staff service, sleeper bus providers can more effectively meet passenger expectations, reduce travel fatigue, and secure customer loyalty in a competitive intercity transportation market12).
Despite their increasing popularity, limited research has explored the detailed characteristics and preferences of sleeper bus passengers. Understanding demographic factors, travel motivations, and comfort expectations is essential for optimizing service design. Previous studies indicate that service quality and facility comfort substantially affect passengers’ transportation choices13). Moreover, analyzing passengers’ age, occupation, and purpose of travel can provide valuable insights for tailoring services and marketing strategies14). Features such as seat ergonomics, in-cabin amenities, and punctuality play a critical role in shaping satisfaction and repeat usage. Therefore, a comprehensive understanding of passenger profiles is crucial for developing competitive and passenger-oriented sleeper bus services15).
The transportation sector remains one of the major contributors to greenhouse gas (GHG) emissions in Indonesia. According to a recent report by Institute for Essential Services Reform (IESR), the sector emitted approximately 202 million tonnes of CO₂ in 2024, with road transport accounting for about 90% of that total16). Consequently, road transport alone constitutes a substantial portion of national energy-related CO₂ emissions, underscoring the environmental impact of mobility patterns across the country. In this context, intercity public transportation particularly sleeper buses presents a promising opportunity to reduce carbon emissions compared to carbon-intensive alternatives such as private vehicles and short-haul flights. By offering comfort and viability for long-distance travel, sleeper buses may be associated with preferences for public transport options among certain traveler segments, although modal substitution and emission impacts cannot be inferred from the present data. Understanding who currently uses these services, and why, is thus essential for designing effective modal shift strategies that support Indonesia’s long-term sustainability goals. This framing underscores the environmental relevance, even though primary focus remains on user preferences and behavior.
Although numerous studies have examined service quality, passenger satisfaction, and operational performance in intercity bus transportation, limited attention has been given to understanding the demographic and behavioral characteristics of sleeper bus users from a sustainable mobility perspective. Identifying who uses sleeper bus services, how frequently they travel, and for what purposes is important because passenger characteristics may influence the acceptance and attractiveness of public transportation alternatives. Such information can contribute to broader discussions on sustainable intercity mobility by providing empirical evidence regarding the user groups most likely to adopt comfort-oriented public transport services.
Accordingly, this study aims to analyze the passenger characteristics and travel behaviors of sleeper bus users on the Malang–Jakarta route. The findings are expected to provide valuable insights for transportation service providers in formulating targeted marketing strategies and improving service quality to align with passenger preferences. Ultimately, this research supports the development of a more user-centered, comfortable, and sustainable intercity transportation system in Indonesia. This study does not propose a new theoretical framework of sustainable mobility. Instead, it provides empirical evidence on how demographic and behavioral characteristics of sleeper bus users may inform discussions on sustainable intercity mobility and targeted modal-shift strategies.
2. Conceptual Background
2.1. Factors Affecting the Selection of Intercity Buses
The research by Alfin et al (2022), customer perception and expectations of a service or product are also greatly influenced by several other aspects17), including:
a)The needs and desires of customers, where the greater the need during travel, the higher the expectations for service quality;
b)Past experiences, whether using services from the same company or other providers, can shape expectations for the current service;
c)The influence of the social environment, such as stories or recommendations from friends and relatives who have used similar services;
d)The influence of the social environment, such as stories or recommendations from friends and relatives who have used similar services.
Marketing and advertising communication, which also shapes customer perception through the image the Company presents.
2.2. Sleeper Class Bus
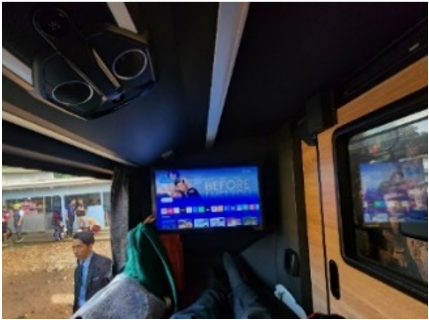
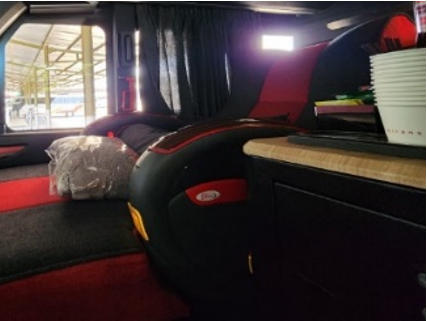
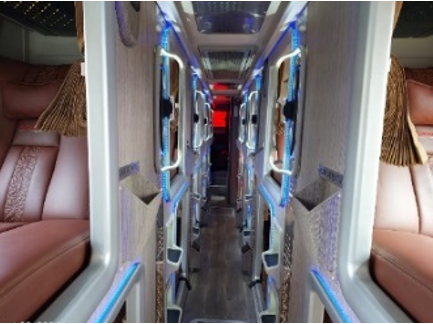
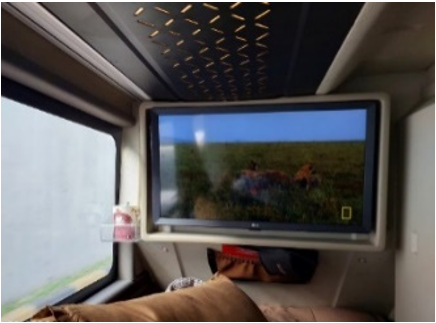
Sleeper buses are considered the highest class of service in intercity and interprovincial bus transportation, offering a 1–1 seat configuration that reclines up to 180 degrees, equipped with long footrests and personal entertainment systems. The private cabin resembles first-class airline seating, providing superior comfort and privacy that allows passengers to rest effectively during long journeys and reduces travel fatigue. In addition, sleeper buses are enhanced with ergonomic reclining seats, Wi-Fi, Audio Video on Demand (AVOD), USB charging ports, individual air-conditioning units, blankets, and pillows. The semi-double deck layout with limited capacity further ensures a comfortable environment, while privacy is improved through partitions and curtains. Some operators also provide value-added services such as meals, beverages, and bus attendants to assist passengers’ needs18).
Passenger satisfaction in sleeper bus services is not solely determined by the physical features of the vehicle but also by the overall quality of service and operational efficiency. Elements such as punctuality, staff responsiveness, cabin cleanliness, and safety measures play a critical role in shaping the travel experience. Technological innovations, including app-based ticketing, real-time travel updates, and customizable seat selection, further enhance convenience and user satisfaction. Research has shown that ergonomic design factors, such as posture adaptability, vibration minimization, and microclimate control, contribute significantly to reducing travel fatigue and improving comfort during long-distance trips19). Improving the quality of sustainable transportation services must involve technological innovation and operational efficiency to create a travel experience that is both environmentally friendly and satisfying for users20).
Moreover, the demographic profile of passengers influences service expectations, with younger travelers often prioritizing affordability and digital convenience, while adult professionals tend to value privacy, comfort, and premium amenities. As competition among intercity bus operators intensifies, companies offering sleeper buses increasingly adopt holistic approaches that combine vehicle design, service excellence, and customer-oriented innovations to differentiate themselves and foster loyalty21). Consequently, the success of sleeper bus services depends on an integrated strategy that addresses both the tangible aspects of travel comfort and the intangible elements of service quality, ultimately creating a more satisfying and competitive long-distance travel option22). The development of sustainable transportation needs to consider user comfort and safety as part of a green mobility strategy that promotes energy efficiency and customer satisfaction in intercity transportation modes23).
Research by Mai & Tai (2015) emphasized that the seat-bed cabin model in sleeper buses is ergonomically designed to accommodate physiological and psychological needs of passengers, especially for long-distance travel in Southeast Asia. This model incorporates comfort factors including aesthetics, vibration minimization, microclimate control, and posture adaptability, aiming to ensure a relaxing ride experience. The main features of the sleeper bus are shown in Figure 1.
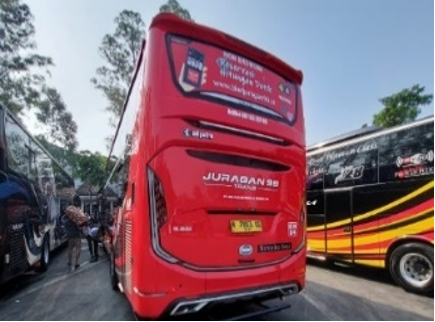
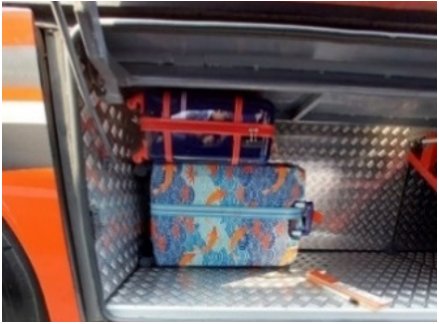
Ngoc and Van Tan (2022) analyzed the influence of road surface profiles on sleeper bus comfort and found that despite interior innovations, external factors such as vibration caused by uneven road surfaces significantly affect passenger comfort24). Using a seven degrees-of-freedom dynamic model and ISO 2631-1 standards, the study demonstrated that road classes and speed influence vibration exposure, with smoother roads (grade A–C) yielding higher comfort, while rough surfaces (grade D–E) lead to discomfort.
Moreover, passenger perception of comfort is also influenced by the overall service quality, including punctuality, cleanliness, and the professionalism of the staff. Technological advancements such as real-time travel updates and app-based seat selection further enhance the travel experience, making sleeper buses increasingly competitive with other modes of transport. Therefore, both vehicle design and operational factors must be considered holistically to optimize passenger satisfaction on long-distance journeys25).
2.3. Respondent Characteristics in Satisfaction Measurement
According to Juma et al (2019), four respondent characteristics influence perceptions of service satisfaction, namely:
1)Gender: male and female;
2)Age: 18 years, 18-20 years, 21-30 years, 31-40 years, 41-50 years, 51-60 years, and >60 years;
3)Last education: Elementary School, Middle School, High School, and Bachelor's/Master's/Doctorate;
4)Occupation: Student/University Student, Civil Servant/Military/Police, Private Sector, Entrepreneur, and Retired.
This research uses a quantitative approach to analyze the service quality of sleeper buses on the Malang–Jakarta route and its impact on customer satisfaction. The research location is situated at Arjosari Terminal, Malang City, serving as the primary departure point for sleeper buses.
Data collection was conducted through primary and secondary data. Primary data was obtained through observation, interviews, distribution via Google Forms, and the dissemination of questionnaires to passengers who have used the sleeper bus service. Observations included bus facilities and service processes, while interviews were conducted both directly at Terminal Arjosari and online. Secondary data were obtained from transportation statistics released by the Transport Office (BPTD) Region XI East Java in 2023, as well as from various related literature sources.
The sampling was conducted using a time-based cluster sampling method26), divided into two clusters: the first week and the last week of May 2025. Respondents were selected through random sampling from sleeper bus passengers aged between 18 and 60 years who had traveled from the starting point, the city of Malang, within the last six months.
3. Material and Methods
3.1. Research Design
This study employed a quantitative cross-sectional survey design to examine passenger characteristics and travel behavior among sleeper bus users on the Malang–Jakarta corridor, Indonesia. The study aimed to identify demographic profiles, travel patterns, operator preferences, and the relationships among these variables in order to provide empirical insights into intercity passenger mobility and the potential role of sleeper bus services in supporting sustainable transportation.
3.2. Study Area
The study was conducted on the Malang–Jakarta intercity corridor, one of the major long-distance passenger transport routes in Indonesia. Data collection was primarily carried out at Arjosari Terminal, Malang, which serves as one of the main departure points for sleeper bus services operating toward Jakarta. This corridor was selected because it represents a significant intercity travel route with increasing demand for comfort-oriented bus transportation services.
3.3. Population and Sampling
The target population consisted of passengers who had used sleeper bus services on the Malang–Jakarta route within the previous six months. Respondents were required to meet the following criteria: (1) aged 18 years or older, (2) had experience using a sleeper bus service on the Malang–Jakarta corridor within the last six months, and (3) voluntarily agreed to participate in the survey.
A time-based cluster sampling approach was applied by dividing the survey period into two clusters, namely the first week and the last week of May 2025. Respondents within each cluster were selected using random sampling techniques. A total of 215 valid questionnaires were collected and included in the final analysis.
3.4. Questionnaire Design
Data were collected using a structured questionnaire consisting of closed-ended questions. The questionnaire was designed to obtain information regarding respondents’ demographic characteristics, travel behavior, and operator preferences.
The demographic variables included gender, age, education level, occupation, and monthly income. Travel behavior variables consisted of travel frequency and travel purpose, while operator preference was measured based on the sleeper bus operator most frequently selected by respondents. The questionnaire was developed based on previous studies concerning passenger behavior, transportation service preferences, and public transportation usage.
3.5. Data Collection Procedure
Data collection was conducted through both direct and online survey methods during May 2025. Direct surveys were administered at Arjosari Terminal approximately one hour before bus departures to ensure that respondents had recent experience with sleeper bus services. In addition, online questionnaires were distributed through Google Forms to reach passengers who had recently travelled on the same corridor.
Before completing the questionnaire, respondents were informed about the purpose of the study and assured that their participation was voluntary and anonymous. Only completed questionnaires that met the respondent criteria were included in the analysis.
3.6. Statistical Analysis
The collected data were processed and analyzed using the Statistical Package for Social Sciences (SPSS). The analysis was conducted in three stages.
First, descriptive statistical analysis was employed to summarize respondent characteristics, travel behavior patterns, and operator preferences. Second, cross-tabulation analysis was used to explore relationships between demographic variables and travel-related characteristics. Third, Chi-square tests were performed to determine the statistical significance of associations between categorical variables, including age and travel purpose, income and travel frequency, as well as demographic factors and operator preference.
The significance level was set at α = 0.05. A p-value below 0.05 indicates a statistically significant association between the variables examined. Because this study adopted a cross-sectional design, the results indicate statistical associations rather than causal relationships.
3.7. Ethical Considerations
This study involved human participants who voluntarily participated in the survey. Prior to completing the questionnaire, respondents were informed about the objectives of the study and their rights as participants. Participation was entirely voluntary, and respondents could withdraw at any time without consequence.
No personally identifiable information was collected, and all responses were treated confidentially. The data were analyzed anonymously and reported only in aggregate form. The study adhered to ethical principles for social science research involving human participants.
4. Results and Discussion
Before discussing the research results, it is important to understand the characteristics of sleeper bus services as the object of study. Sleeper buses are an intercity transportation mode that offers higher comfort compared to regular buses, especially for long-distance journeys. This service is equipped with seats that can be fully reclined or converted into beds, as well as additional facilities such as private cabins, pillows and blankets, charging ports, entertainment screens, and toilets inside the bus. The presence of these facilities makes the sleeper bus a premium alternative favored by passengers who prioritize comfort, privacy, and travel efficiency. These characteristics serve as the basis for evaluating user perceptions and satisfaction levels with the provided service.
4.1. Overview of The Malang – Jakarta Sleeper Bus Route
The Malang–Jakarta sleeper bus route originates from the official PO agents at Soekarno–Hatta, Tlogomas (near most of the famous universities in Malang City), and Terminal Arjosari, which serves as the main terminal. This approximately 12-hour journey passes through major cities such as Surabaya, Semarang, and Cirebon, with stopovers in Ngawi and Subang. Sleeper buses, such as Juragan 99, offer reclining seat comfort, providing a pleasant travel experience for passengers. The description of this route becomes an important context for analyzing the impact of sleeper bus service quality on customer satisfaction.
4.2. Location and Time of Research
The research location focuses on the bus pools and Arjosari Terminal in Malang, which serves as the main terminal. This terminal was selected to collect data on sleeper bus users, including their demographic information and travel patterns. The research was conducted in two time clusters: the first week of May (May 5–11, 2024) and the last week of May (May 26–June 1, 2024), with all respondents who met the criteria being sampled. During the first week of May (May 5–11), there were relatively few passengers available for interview. In contrast, at the end of the month (May 26–June 1), there was a significant increase in the number of passengers, particularly on May 29, 30, 31, and June 1, due to the long weekend. This allowed researchers to collect more responses during this peak period.
4.3. Data Collection Stage
The equations are an exception to the prescribed The data collection stage was conducted systematically using direct observation methods at the Arjosari Terminal, as well as interviews with sleeper bus passengers who received questionnaires. Primary data included passengers' perceptions of comfort and safety, user profiles, and the results of facility and service observations. Secondary data included operational schedules, passenger numbers, and related transportation policies. Research instruments (observation sheets, interview guides, questionnaires) were tested for validity and reliability before data collection. The data obtained is then classified and sorted for further analysis.
4.4. Data Processing
Data collection was conducted through the distribution of questionnaires and structured interviews with users of the sleeper bus route from Malang to Jakarta, approximately 1 hour before departure at Terminal Arjosari. The interview technique used was individual interviews with uniform questions. The questionnaire was designed with service attributes based on the dimensions (Tangibles, Empathy, Assurance, Reliability, Responsiveness) and distributed using the simple random sampling technique. Data collection was conducted in two periods (early and late May, each lasting 7 days).
4.5. Respondent Characteristics
The analysis of the characteristics of Bus Sleeper users is based on several parameters proposed in the questionnaire, which was administered using Google Forms and direct interviews with 215 respondents. For the interview questionnaire, 16 were conducted at one research location, and 199 were completed via Google Forms.
4.5.1. Passenger Characteristics and Their Implications for Sustainable Intercity Mobility
Table 1 presents the demographic profile of sleeper bus passengers, including gender and age distribution of the 215 respondents surveyed on the Malang–Jakarta corridor.
The demographic profile of sleeper bus passengers on the Malang–Jakarta route reveals significant patterns that provide contextual insights into intercity passenger transportation characteristics. The dominance of passengers aged 21–30 years (68.8%) aligns with findings by Daneshvar et al. (2023), who identified similar age-group concentrations in rapid transit systems10). This demographic segment, characterized by higher education levels (63.7% holding at least a Bachelor's degree) and digital literacy, represents a critical target group for promoting sustainable mobility alternatives.
The near-equal gender distribution (51.6% male, 48.4% female) suggests that sleeper bus services have achieved broad market acceptance across gender groups. This finding contrasts with Vasanthi et al. (2023), who observed significant gender-based differences in satisfaction with public transportation cleanliness and service quality25).
Table 1: Passenger Characteristics
| Passenger Characteristics | n | % |
|---|---|---|
| Gender | ||
| Man | 111 | 51.6 |
| Woman | 104 | 48.4 |
| Age | ||
| 18 – 20 years old | 35 | 16.3 |
| 21 – 30 years old | 148 | 68.8 |
| 31 – 40 years old | 10 | 4.7 |
| 41 – 50 years old | 12 | 5.6 |
| 51 – 60 years | 10 | 4.7 |
| Total | 215 | 100 |
The balanced gender ratio in sleeper bus usage may indicate that premium service features like private cabins, enhanced security, and comfort amenities that effectively address traditional barriers to female ridership in public transportation.
Indonesia's transportation sector contributes approximately 25% of national energy-related emissions, with road transportation accounting for the largest share27). Within this context, understanding passenger preferences for intercity buses becomes relevant for discussions on intercity transport planning. The preference for sleeper buses among young, educated professionals suggests patterns of interest in comfort-oriented public transport options on major intercity corridors, although impacts on private vehicle use or broader sustainability objectives cannot be inferred from the present study.
4.6. Statistical Analysis of Passenger Characteristics and Travel Behavior.
Table 2 summarizes the chi-square test results examining relationships between passenger demographic variables and travel behavior characteristics.
Overall, the statistical analysis demonstrates that not all demographic variables significantly influence passenger behavior. While age and income show significant associations with travel characteristics, other variables such as gender, education, and occupation do not exhibit statistically significant relationships. This indicates that travel behavior is not solely determined by sociodemographic factors, but is also shaped by service-related attributes, perceived quality, and travel experience. This finding is consistent with previous studies emphasizing that behavioral and experiential factors often play a more dominant role than demographic characteristics in transport mode choice28,29).
Table 2: Chi-Square Test Results – Age Group × Travel Purpose
| Variable Relationship | Chi-Square (χ²) | df | p-value | Interpretation |
|---|---|---|---|---|
| Age × Travel Purpose | 62.252 | 16 | 0,001 | Significant |
| Age × Operator Preference | 44.429 | 44 | 0.454 | Not significant |
| Income × Travel Frequency | 37.969 | 20 | 0.009 | Significant |
| Education × Operator Preference | 47.933 | 44 | 0.316 | Not significant |
| Occupation × Operator Preference | 37.545 | 44 | 0.743 | Not significant |
| Gender x satisfacton level | 1.200 | 2 | 0.549 | Not significant |
4.6.1. Age and Travel Purpose
The chi-square analysis reveals a statistically significant relationship between age group and travel purpose (χ² = 62.252, p < 0.05). Passengers aged 21–30 years predominantly travel for recreation (39.2%) and family visits (23.6%), while the 18–20 age group shows higher proportions of educational travel. This finding extends the work of Sun and Wong (2022), who demonstrated that demographic factors significantly influence travel-based multitasking behavior and mode choice decisions14).
The significant association between age and travel purpose may inform considerations for service design. Operators targeting the dominant 21–30 age segment should emphasize leisure-oriented amenities (entertainment systems, comfortable sleeping arrangements) and flexible scheduling aligned with weekend and holiday travel patterns. This segmentation approach aligns with Meena et al. (2024), who advocated for data-driven service differentiation in public transportation11).
4.6.2. Age and Operator Preference
The chi-square test results showed no statistically significant relationship between age group and operator preference in this sample (χ² = 44.429, df = 44, p = 0.454), thus age does not appear to be a predictor that differentiates operator preferences among study respondents. Belgiawan, Joewono, and Irawan (2022) found similar results in the context of Indonesian ride-sourcing services, namely that the direct effect of sociodemographic variables on service usage can be weak or inconsistent across contexts30). This finding strengthens the interpretation that non-significance may reflect the independence of operator preferences on age alone.
The non-significant findings are also in line with the literature emphasizing that travel behavior and mode/service provider choices vary according to contextual conditions and psychosocial factors, such that age differences alone often do not adequately explain preference variability (post-pandemic behavioral changes and individual heterogeneity in responses to contextual factors). Panel studies and cross-temporal surveys indicate that the impact of sociodemographics on travel behavior is volatile and often moderated by other variables (attitudes toward risk, service experiences, and environmental conditions)31).
4.6.3. Income Level and Travel Frequency
Cross-tabulation analysis reveals an interesting pattern: both high-income earners (>Rp 5,000,000/month) and non-income earners (students) predominantly use sleeper buses only once annually (65.8% and 58.6%, respectively). The chi-square test indicates significant association between income level and travel frequency (χ² = 37.969, p = 0.009).
This finding challenges the assumption that higher income correlates with more frequent premium service usage. Instead, it suggests that sleeper buses are positioned as a "special occasion" transportation mode across income segments, primarily serving leisure and family-visit purposes rather than routine commuting. Zhou et al. (2024) similarly observed that travel behavior changes are influenced by trip purpose rather than solely by economic factors15).
The income polarization with 38.1% earning above Rp 5,000,000 and 27% having no income indicates a dual-market structure. Service providers should consider tiered pricing strategies: premium packages for professionals seeking maximum comfort, and student-friendly options maintaining core comfort features at accessible price points. Such differentiation supports inclusive mobility access while maintaining service sustainability.
4.6.4. Education and Operator Preference
Chi-square analysis of the relationship between education level and operator preference yields (χ² = 47.933, p = 0.316). The chi-square test results indicate that there is no significant relationship between education level and operator preference, so education cannot be considered a predictor that differentiates passenger choice. This finding is consistent with transportation studies showing that sociodemographic variables including education often have a weak or indirect influence on service preference when behavioral factors, service attributes, and travel experience are considered simultaneously30). This finding is also supported by evidence that the choice of mode or service provider is more influenced by functional attributes, perceived quality, and user experience than by differences in individual demographic characteristics28).
This study may reflect that preferences for bus operators are relatively universal across educational levels, as the preference formation process is driven more by brand image, service quality, and user experience. This finding is consistent with branding literature which asserts that preference differentiation tends to be mediated by perceived quality and experience, rather than by sociodemographic characteristics, so operator strategies are more effective when focused on improving service attributes and strengthening brand image that are relevant to all passenger segments32).
Previous research has shown that income levels influence how users prioritize travel experiences and service quality: high-income travelers often value premium service and convenience, while low-income or no-income travelers are more sensitive to affordability but still prioritize comfort and convenience for special trips33).
From a service quality perspective, operator consolidation around quality-focused brands like Juragan 99 may facilitate more consistent service standards across the intercity bus market. As dominant operators set higher service standards, competitive pressure may encourage operational improvements, although technological transitions such as fleet electrification are beyond the scope of this study. National transportation electrification goals highlight the importance of institutional readiness; however, the present study does not assess technological adoption pathways among operators27).
4.6.5. Occupation and Operator Preference
The chi-square analysis indicates that there is no statistically significant relationship between occupation category and operator preference among respondents (χ² = 37.545, p > 0.05). This finding suggests that occupational status does not substantially differentiate passengers’ choices of bus operator, implying that preferences toward Juragan 99, Bagong, or other operators tend to be relatively uniform across employment groups. Such non-significant effects of sociodemographic variables are consistent with Belgiawan et al. (2022), who found that demographic attributes often exhibit weak or inconsistent influence on transport-service selection when perceptual and experiential factors are considered30).
The absence of a significant association is further aligned with Evergreen-published evidence indicating that mobility behavior can remain stable across occupational groups when the perceived functional attributes of the service such as safety, comfort, and reliability are sufficiently dominant in shaping preferences. Pambudi et al. (2022) emphasize that user acceptance of transport or energy-related innovations is strongly driven by perceived quality and contextual experience, rather than demographic segmentation, reinforcing the idea that occupation may not be a decisive determinant in passenger decision-making.
From a managerial perspective, these findings imply that operators should avoid over-relying on occupation-based segmentation strategies. Instead, service enhancement strategies should focus on universal quality attributes including comfort, safety assurance, punctuality, and consistency of service delivery which have been shown to exert a more powerful influence on user satisfaction and modal preference29). Moreover, preference formation in modern transport markets is increasingly shaped by brand trust and service experience, which operate similarly across occupational classes32). Hence, the non-significant chi-square result indicates that operator preference is better explained by psychological and service-related factors rather than by occupational differences.
4.6.6. Gender x satisfacton level
The chi-square analysis yields χ² = 1.200 with df = 2 and p = 0.549, indicating no statistically significant relationship between passenger gender and their level of satisfaction with service. Thus, in this sample, user satisfaction levels do not appear to differ significantly between men and women meaning, gender is not a significant predictor of variations in perceived satisfaction.
This finding is consistent with studies of customer service management in modern retail, which show that gender differences do not always play a role in influencing customer satisfaction with service; in that study, gender did not significantly influence customer satisfaction levels34).
Furthermore, studies on public transportation in large cities show that while gender differences exist in perceptions of certain aspects such as safety, comfort, or specific service attributes, these differences are sometimes not reflected in significant differences in “overall satisfaction” when service quality is perceived as adequate and consistent35).
Therefore, our non-significant results suggest that service operators do not need to implement different strategies based solely on gender when it comes to satisfaction but rather focus on improving universal service quality (cleanliness, comfort, reliability, safety) for all passengers, regardless of gender.
4.7. Operator Preference and Brand Loyalty: The Case of Juragan 99 Trans.
Table 3 presents the distribution of operator preferences among sleeper bus passengers.
PO Juragan 99 Trans commands 38.1% market share, significantly exceeding its nearest competitor, PO Sinar Jaya (11.2%). This dominance warrants examination through the lens of service quality theory and brand management.
The preference concentration toward Juragan 99 confirms findings by Munawaroh et al. (2024), who identified service co-creation and excellent service delivery as key drivers of customer satisfaction in the Juragan 99 Trans context5). The present study extends this understanding by revealing demographic correlates of brand preference.
4.8. Travel Patterns and Implications for Sustainable Mobility
4.8.1. Trip Frequency and Seasonal Demand
Table 4 shows the travel frequency patterns of sleeper bus users on the Malang–Jakarta route.
Table 3: Bus Company Used
| Bus Company (PO) Used | n | % |
|---|---|---|
| PO Juragan 99 Trans | 82 | 38.1 |
| PO Rosalia Indah | 19 | 8.8 |
| PO Sinar Jaya | 24 | 11.2 |
| PO Gunung Harta | 13 | 6.0 |
| PO Handoyo | 7 | 3.3 |
| PT Damri | 18 | 8.4 |
| PO Lorena | 2 | .9 |
| PO Agra Mas | 13 | 6.0 |
| PO Harapan Jaya | 15 | 7.0 |
| PO Mtrans | 16 | 7.4 |
| PO 27 Trans | 5 | 2.3 |
| Total | 215 | 100 |
Table 4: Travel Frequency
| Travel Frequency | n | % |
|---|---|---|
| Once a week | 23 | 10.7 |
| Twice a week | 7 | 3.3 |
| 3 times a week | 4 | 1.9 |
| 1 time per month | 25 | 11.6 |
| 1 month 2 times | 14 | 6.5 |
| 1 time a year | 142 | 66 |
| Total | 215 | 100 |
The finding that 66% of respondents travel only once annually indicates seasonal demand concentration, likely around major holidays (Lebaran, year-end holidays) and academic calendar transitions. This pattern has implications for operational planning and demand management.
These findings indicate that sleeper bus use tends to be occasional and oriented towards specific purposes such as vacations or family visits rather than routine transportation needs, making service quality, comfort, and travel experience the primary drivers of usage decisions a pattern consistent with findings from regional mobility studies that emphasize the role of travel motivations and service factors in determining demand for transportation modes36).
Seasonal demand concentration creates challenges for fleet utilization and highlights the importance of efficient scheduling, although environmental impacts were not directly examined in this study. Chen et al. (2025) demonstrated that understanding passenger arrival patterns enables more efficient bus operations, reducing unnecessary vehicle-kilometers traveled12). For sleeper bus operators, accurate demand forecasting based on demographic and temporal patterns could improve operational efficiency and resource utilization.
4.8.2. Travel Purpose and Modal Competition
Table 5 illustrates the primary travel purposes reported by respondents.
Recreation (37.2%) and family visits (27.4%) dominate travel purposes, with business travel accounting for only 20.5%. This leisure-oriented pattern positions sleeper buses in competition with private vehicles and low-cost airlines rather than business-focused rail services.
The recreational travel dominance connects to broader sustainable tourism considerations. East Java, including Malang as an origin point, has been developing community-based ecotourism initiatives that emphasize
Table 5: Travel Purpose
| Travel Destination | n | % |
|---|---|---|
| Business trip/work | 44 | 20.5 |
| Business/trading | 14 | 6.5 |
| Recreation/vacation | 80 | 37.2 |
| School/college | 18 | 8.4 |
| Visiting family | 59 | 27.4 |
| Total | 215 | 100 |
environmental sustainability and local community benefits37). Sleeper buses serving tourism corridors may be positioned as comfort-oriented public transport options for leisure travel, although their sustainability performance requires further empirical validation.
Wicaksono et al. (2024) found reciprocal effects between physical activities and transportation choices on health outcomes23). The comfort-oriented features of sleeper buses reduced fatigue, improved sleep quality during travel may offer health co-benefits that differentiate them from more stressful travel alternatives, particularly for long-distance leisure travel.
4.8.3. Sustainable Mobility Perspective
From a sustainable mobility perspective, the findings suggest that sleeper bus services may serve as an attractive public transportation option for long-distance travel, particularly among young and educated passengers. The dominance of respondents aged 21–30 years indicates that younger generations demonstrate a willingness to utilize collective transportation modes when comfort, convenience, and service quality meet their expectations.
The preference for sleeper buses among leisure and family-related travelers also highlights the importance of service attributes in encouraging public transport use for non-routine trips. While this study does not directly measure modal shift from private vehicles or air transport, the findings indicate that comfort-oriented bus services have the potential to support broader efforts aimed at increasing the attractiveness of public transportation in intercity travel markets.
These findings should be interpreted cautiously because environmental impacts and emission reductions were not directly evaluated. Nevertheless, understanding passenger characteristics remains an important preliminary step in developing transportation policies that encourage greater adoption of public transport alternatives and support long-term sustainable mobility objectives.
4.9. Comparative Analysis with Prior Research
The present findings both confirm and extend previous research on intercity bus passenger behavior:
a)Confirmation of prior findings:
1)Young adult dominance in premium bus services aligns with Daneshvar et al. (2023)10)
2)Service quality as primary satisfaction driver confirms Etuk et al. (2021)2)
3)Brand reputation influence on operator choice supports Munawaroh et al. (2024)5)
b)Extension of prior research:
1)Unlike Ngoc and Van Tan (2022), who focused on physical comfort factors (vibration, ergonomics), this study reveals that demographic-behavioral linkages are equally important for service design24)
2)While Mai and Tai (2015) emphasized physiological needs in sleeper bus design, the current findings suggest that psychological factors (brand trust, social status) significantly influence mode choice among Indonesian passengers38)
3)The dual-market structure (students and professionals) extends understanding beyond Huda et al. (2024), who examined single-corridor urban transit users8)
c)Contrasts with prior research:
1)The once-annual travel frequency differs from urban transit studies showing daily/weekly usage patterns20)
2)The lack of significant income-frequency correlation challenges economic determinism assumptions in transportation choice literature
4.10. Implications for Sustainable Intercity Transportation Policy
The findings offer contextual insights that may inform discussions on sustainable intercity transportation policy in Indonesia. However, these implications should be interpreted cautiously, given the cross-sectional design and corridor-specific scope of the study:
a)Modal Shift Potential
The educated and relatively young demographic currently using sleeper buses represents a population segment that appears receptive to comfort-oriented public transport services. From a policy perspective, this pattern may inform discussions on how intercity public transport services are communicated and integrated within broader transport systems, although the effectiveness of specific sustainability-oriented interventions cannot be assessed within this study.
b)Service Quality Standards
The observed preference for quality-differentiated services highlights the importance of service attributes in shaping user satisfaction with sleeper bus services. In this context, discussions on minimum comfort and safety standards may be relevant for maintaining service consistency across operators, without implying competitive displacement of private vehicle use.
c)Demand Management
The observed seasonal concentration of demand indicates temporal variation in sleeper bus usage patterns. These patterns may be relevant for operational planning by service providers, although the impacts of pricing or promotional strategies were not examined in this study.
d)Regional Connectivity
The Malang–Jakarta corridor connects East Java's educational and tourism centers with the national capital. The Malang–Jakarta corridor connects educational, economic, and tourism activities between East Java and the national capital. Reliable sleeper bus services may play a role in facilitating this connectivity, although broader impacts on vehicle ownership patterns or aviation demand cannot be inferred from the present analysis.
However, these policy implications should be interpreted with caution. The study does not directly measure modal shift, emission reduction, or environmental performance. Instead, it provides behavioral insights that may inform broader discussions on sustainable intercity transportation. Further research is required to quantitatively assess the environmental benefits of sleeper bus services compared to alternative transport modes.
The results suggest that improving comfort, reliability, and service quality may increase the attractiveness of sleeper bus services among potential intercity travelers. In the context of sustainable transportation planning, enhancing the competitiveness of public transport services can contribute to reducing dependence on individual motorized travel. Therefore, investments in passenger-centered service improvements may represent an important complementary strategy for supporting sustainable intercity mobility in Indonesia.
5. Conclusions
This study provides empirical insights into the characteristics and travel behavior of sleeper bus passengers on the Malang–Jakarta corridor, with implications for intercity transport service development.
The findings indicate that demographic factors partially influence travel behavior. Age is significantly associated with travel purpose, suggesting that different age groups exhibit distinct mobility patterns, particularly in leisure and family-related travel. Income level also shows a significant relationship with travel frequency, although sleeper bus usage remains largely occasional across all income groups.
In contrast, variables such as gender, education, and occupation do not demonstrate significant relationships with operator preference or satisfaction. This suggests that passenger decisions are more strongly influenced by service-related attributes such as comfort, reliability, and overall travel experience rather than by sociodemographic differences alone.
The study also identifies a concentration of preference toward specific operators, particularly Juragan 99 Trans, indicating the importance of service quality consistency and brand reputation in shaping passenger choice.
From a broader perspective, the dominance of young and educated passengers reflects a segment that shows interest in comfort-oriented public transportation. While this may suggest potential relevance for intercity mobility planning, the study does not establish direct evidence of modal shift or environmental impact.
From a sustainable mobility perspective, the findings indicate that sleeper bus services may contribute to strengthening the attractiveness of public transportation for long-distance travel, particularly among younger and educated passenger segments. Although this study does not directly evaluate environmental performance or modal shift effects, it provides empirical evidence that can support future research and policy discussions regarding the role of comfort-oriented public transport services in sustainable intercity mobility systems.
This research is limited by its cross-sectional design and focus on a single corridor. Therefore, the findings should be interpreted as context-specific and exploratory. Future research is recommended to apply longitudinal approaches and advanced modeling techniques, such as Multinomial Logit models, to better understand transport mode choice behavior and its implications for sustainable mobility.
References
- K. Arifin, A. Widarko, and A.R. Slamet, “The influence of price, word of mouth (wom), and brand trust on the ticket purchase decision for juragan 99 bus (a study on juragan 99 bus passengers on the malang–jakarta route),” E-Jurnal Ris. Manaj., 13 (1) 1297–1306 (2024).
- A. Etuk, J.A. Anyadighibe, E.E. James, and R. Mbaka, “Service quality and passengers’ loyalty of public transportation companies,” Br. J. Manag. Mark. Stud., 4 (4) 82–98 (2021). doi:10.52589/BJMMS-LRQ7JAVX.
- N.R. Kusumawati, and N. Widyaningsih, “City bus inter-city and inter-provincial traveller safety analysis in jakarta until solo province,” Int. J. Eng. Res. Adv. Technol., 9 (10) 1–8 (2023). doi:10.31695/IJERAT.2023.9.10.1.
- A. Wicaksono, L.E. Dharmowijoyo, Dimas B. E.Tanjung, and Y.O. Susilo, “The reciprocal effects of physical activities and ride-sourcing on health,” Int. J. Sustain. Transp., 18 (1) 15–33 (2024). doi:10.1080/15568318.2023.2180787.
- S. Munawaroh, S. Bintarti, T. Rachman, J. Heruwanto, and M.A. Maskuri, “Quality experience: co-creation and excellent service juragan 99 trans bus land transportation services with currency moderation,” J. Res. Soc. Sci. Econ. Manag., 3 (11) 1975–1995 (2024). doi:10.59141/jrssem.v3i11.666.
- M.W. Fadhilah, and S. Amalia, “The influence damri city bus service quality on customer satisfaction (a study of damri city bus passengers in bandung),” J. Bus. Invest. Res., 7 150–162 (2022). doi:10.35313/jrbi.v7i2.3254.
- R.S. Prianto, “The Influence of Service Quality, Facilities, and Price on Customer Satisfaction with PO. Rosalia Indah Busses,” Universitas Semarang, 2023.
- S. Huda, S. Handayani, A. Setyawati, L. Arifiani, and Z. Abidin, “The influence of commitment, service quality and bus feasibility on passenger satisfaction in corridor i transjakarta block m-city,” J. Manage., 3 (1) 176–184 (2024).
- S. Ali, A. Handayani, M. Sobirin, and M.E. Audifikria, “Analysis of transjakarta bus rapid transit infrastructure services on customer satisfaction performance with large-scale social restrictions in dki jakarta,” IJTI Int. J. Transp. Infrastruct., 5 (1) 1-11 (2021). doi:10.29138/ijti.v5i01.1506.
- A. Daneshvar, F. Salahi, M. Ebrahimi, and B. Nahavandi, “Analyzing behavioral patterns of bus passengers using data mining methods (case study: rapid transportation systems),” J. Appl. Res. Ind. Eng., 10 (1) 11–24 (2023). doi:10.22105/jarie.2021.302560.1373.
- K.K. Meena, D. Bairwa, and A. Agarwal, “A machine learning approach for unraveling the influence of air quality awareness on travel behavior,” Decis. Anal. J., 11 1–14 (2024). doi:10.1016/j.dajour.2024.100459.
- D. Chen, J. He, S. Lin, and Z. Yang, “Passenger arrival patterns and its implications for bus operation: the impact of schedule reading behavior on average waiting times at bus stops,” Transp. Policy, 163 310–322 (2025). doi:10.1016/j.tranpol.2025.01.021.
- A.P. Basowa, and J. Setiawan, “The influence of service and facility quality on consumer satisfaction (a case study of trans batam bus public transportation users),” Sci. J., 1 (2) 1–11 (2019).
- S. Sun, and Y.D. Wong, “Travel-based multitasking behaviour in singapore: determinants and impacts on money-time-seat trade-offs,” Travel Behav. Soc., 26 84–95 (2022). doi:10.1016/j.tbs.2021.09.005.
- S. Zhou, S. Zhou, F. Jing, L. Qi, and J. Li, “Exploring the changes of individuals’ travel behavior in response to covid-19 and their influencing factors based on mobile phone data,” J. Transp. Heal., 36 1–11 (2024). doi:10.1016/j.jth.2024.101788.
- Institute for Essential Services Reform (IESR), “Indonesia Sustainable Mobility Outlook 2025,” IESR, Jakarta Selatan, 2025.
- Alfin, S. Widodo, and Said, “Analysis of factors influencing the choice of public transportation modes: taxis and AKDP buses (case study: Sambas–Pontianak route),” JeLAST, 9 (4) 1–11 (2022). doi:10.26418/jelast.v9i4.60309.
- R. Firmansyah, and H. Bahalwan, “Sleeper class double-decker bus interior design,” Creat. J. Ind. Prod. Des. Archit., 9 (2) 109–115 (2021). doi:10.46964/jkdpia.v9i2.180.
- M.F. Apriansyah, A.I. Rifai, and S. Handayani, “The comparative analysis of mudik mode transportation: a case of pt adirona nirmana lestari employer, indonesia,” Indones. J. Multidiscip. Sci., 1 (1) 140–152 (2022). doi:10.55324/ijoms.v1i1.378.
- A. Bakhtiar, L.P. Ningtyas, and H. Suliantoro, “Transjakarta Corridor I service improvement design using Customer Satisfaction Index (CSI) and Importance Performance Analysis (IPA) methods,” in: IEEETechnology Eng. Manag. Conf. Pacific, 2024: pp. 1–6. doi:10.1109/TEMSCON-ASPAC62480.2024.11024868.
- M. Ali, E. Macioszek, and D.B.E. Dharmowijoyo, “Influence of activity-travel participation, travel mode choice, and multitasking activities on subjective well-being using r,” Sustainability, 15 (23) 1–22 (2023). doi:10.3390/su152316338.
- M. Fatkhurrozi, D.K. Sudarsana, D. Yuniar, and A. Suraji, “Travel time behavior study of malang-denpasar intercity bus considering sailing time of ketapang gilimanuk,” J. Sci. Appl. Eng., 4 (2) 21–26 (2021). doi:10.31328/jsae.v4i2.3084.
- A.D. Wicaksono, D. Agustina, and V.Y.R. Ningtyas, “Sustainable urban mobility: level of people mobilization in surabaya,” Evergreen, 11 (2) 1116–1124 (2024). doi:10.5109/7183413.
- X.N. Nguyen, N. Van Tran, V. Van Tan, and P.T. Dang, “Analyze the influence of road profiles on the comfort of passengers in sleeper bus,” in: Int. Symp. Precis. Mach. Adv. Technol. (ISPMAR 2022), 2022: pp. 95–101.
- M.G. Vasanthi, V. Soundrarajan, N. Nawaz, V. Gajendran, and S. Parayitam, “Passenger satisfaction with cleanliness and other service quality dimensions and gender as a moderator: evidence from indian railways,” Cogent Bus. Manag., 10 (1) 1–21 (2023). doi:10.1080/23311975.2023.2183568.
- S. Notoatmodjo, “Health Research Methodology,” Rineka Cipta, Jakarta, 2018.
- Institute for Essential Services Reform (IESR), “Indonesia Energy Transition Outlook (IETO) 2024,” IESR, Jakarta Selatan, 2023.
- C. O’Driscoll, F. Crowley, J. Doran, and N. McCarthy, “How the relationship between socio-demographics, residential environments and travel influence commuter choices,” Reg. Stud., 58 (3) 636–653 (2022). doi:10.1080/00343404.2023.2199779.
- H.-W. Chau, M. Chan, E. Jamei, and K. Lättman, “The impacts of perceived safety and service quality on perceived accessibility by public transport in melbourne,” Land, 13 (11) 1–18 (2024). doi:10.3390/land13111928.
- P.F. Belgiawan, T.B. Joewono, and M.Z. Irawan, “Determinant factors of ride-sourcing usage: a case study of ride-sourcing in bandung, indonesia,” Case Stud. Transp. Policy, 10 (2) 831–840 (2022). doi:10.1016/j.cstp.2022.02.010.
- A. Rostami, E. Kamjoo, A. Bamney, N. Gupta, P.T. Savolainen, and A. Zockaie, “Investigating changes in travel behavior over time in response to the covid-19 pandemic,” Transp. Res. Part F Traffic Psychol. Behav., 96 135–154 (2023). doi:10.1016/j.trf.2023.06.001.
- X. Zhang, and C. Guo, “Influencing factors and formation mechanism of brand preference in community e-commerce,” Sustainability, 16 (23) 1–25 (2024). doi:10.3390/su162310638.
- B.S. Waloejo, I. widyawati Agustin, U. of Brawijaya, S. Hariyani, and D.F. Al Himah, “The effect of land use on the road’s level of service at sultan agung road, malang regency,” Evergreen, 11 (2) 1136–1147 (2024). doi:10.5109/7183416.
- S. Maryanti, F.H. Sukmana, Suharti, and Faezal, “The effect of gender on consumer satisfaction and loyalty in modern retail stores,” Sentralisasi, 11 (2) 118–131 (2022). doi:10.33506/sl.v11i2.1657.
- J. de Oña, E. Estévez, and R. de Oña, “Public transport users versus private vehicle users: differences about quality of service, satisfaction and attitudes toward public transport in madrid,” Travel Behav. Soc., 23 16–85 (2021). doi:10.1016/j.tbs.2020.11.003.
- M.A. Salsabilla, L. Meiyanne, Y.N.R. Hendra, and A.Y. Nurhidayat, “Potential demand for n219a seaplane passengers in east java, indonesia,” Evergreen, 11 (3) 2590–2606 (2024). doi:10.5109/7236899.
- A. Efani, R. Tiarantika, A. Manzilati, A.B. Sambah, M.F. Riza, Soemarno, and Koderi, “Key variables for successful community-based ecotourism management in east java, indonesia,” Evergreen, 11 (4), 2831–2847 (2024). doi:10.5109/7326927.
- P.X. Mai, and P. Van Tai, “Seat-bed cabin model – an orientation suitable for the sleeper bus in vietnam’s traffic exploitation conditions,” J. Sci. Technol., 6 (91) 29–33 (2015).