
Abstract
Heritage districts face challenges in parking infrastructure planning that balance financial returns with cultural preservation. This study assesses the financial feasibility of a multi-story parking building at Kayutangan Heritage Area, Malang, through parking demand analysis, Ability-to-Pay and Willingness-to-Pay surveys of 73 respondents, and standard financial evaluation. Results show that parking demand exceeds capacity during weekend peaks, users have sufficient financial capacity but low perceived service value, and the project yields a Benefit-Cost Ratio of 1.06, Net Present Value of IDR 5.06 billion, and Internal Rate of Return of 6%, indicating moderate feasibility.
Keywords: Financial Feasibility, Kayutangan Heritage, Malang City, Parking Building
Outline
1. Introduction
As a leading city, Malang plays an important and strategic role at the regional and national levels. The renowned universities and tourist attractions in this city provide significant comparative and competitive advantages for investment. The city's activity level is expected to increase as Malang continues to grow and develop1). The most intense activities are concentrated in key areas of growth and movement. The city center is crucial for the economic development of Malang City as it hosts various vital activities that form the backbone of urban life, including trade and services, shopping centers, entertainment, and recreation, as well as informal activities such as street vendors2).
The rapid growth in physical development and the number of vehicles in Malang City is similar to that in many other major cities in China3), but is not matched by adequate road infrastructure development. This situation has caused traffic congestion to increase, especially during peak hours. While increasing the number of parking spaces may alleviate some parking pressure, it can also trigger new congestion on urban roads. This phenomenon indicates that although efforts to enhance parking capacity are a temporary solution, they have only a limited impact on the overall traffic problem. Indeed, increasing the number of parking spaces can reduce the pressure to find a parking spot, but it can also lead to a buildup of vehicles on the roads leading to and from these parking areas. This condition often exacerbates traffic congestion in urban areas4,5).
Furthermore, solutions focusing solely on increasing parking capacity tend to overlook the need to design a more holistic and sustainable transportation system6). For instance, policies encouraging efficient public transportation7), infrastructure development for pedestrians and cyclists8), and improved traffic management can help reduce dependence on private vehicles. Implementing these strategies in Malang City and other cities can provide long-term solutions to the increasingly urgent traffic congestion issues.
Traffic congestion frequently occurs in areas with high activity, such as shopping centers, government offices, and educational institutions. The rising volume of vehicles and on-street parking make certain areas particularly vulnerable to frequent congestion, especially during peak hours9,10). Despite growing attention to parking management in cities like Malang, research on the financial feasibility of parking infrastructure within formally designated heritage areas remains limited. Existing studies typically address technical capacity, traffic impacts, or general feasibility, but rarely examine how financial viability intersects with heritage regulations, informal economic activity, and sustainable mobility goals. This gap is significant in developing-country heritage districts, which face pressures from tourism, spatial constraints, and strict conservation rules. Thus, an integrated analytical approach is needed to evaluate investment returns while also accounting for parking demand behavior and the long-term sustainability of heritage-based urban environments.
Malang City is optimizing parking through regulations for public and private spaces, involving planning, organizing, monitoring, and controlling, to make parking a sustainable revenue source. A new parking building is specifically planned for Basuki Rahmat Street within the Kayutangan Heritage Area11).
Accordingly, this study provides an integrated assessment of the proposed facility's financial performance. The study aims to: (1) analyze parking demand characteristics and user payment behavior in the Kayutangan Area; (2) evaluate financial feasibility through demand projections, tariff sensitivity testing, and investment return indicators; and (3) develop recommendations that balance commercial viability with the sustainability and conservation requirements of the heritage corridor.
Furthermore, this study is based on the hypothesis that the centralized parking facility is financially viable (BCR > 1.0) and serves as a critical tool for Travel Demand Management (TDM). It is hypothesized that transitioning from on-street to off-street parking will restore the visual integrity of the heritage corridor while maintaining economic sustainability through integrated commercial functions.
2. Literature Review
2.1. Financial Feasibility Study
A financial feasibility study is an essential foundation for project planning and evaluation to ensure that a project is not only technically feasible but also financially profitable12). This study includes an analysis of initial construction costs, projected revenue, and cash flow evaluation during both the construction and operational phases. It also assesses the investment viability in terms of profitability, market potential, and technical feasibility, making it a key reference for investors to ensure the expected return on investment (ROI). In addition to benefiting investors, project developers also rely on the results of this study to manage resources efficiently and avoid cost overruns13). The study plays a crucial role in identifying financial risks and designing mitigation strategies to address potential challenges, including material price fluctuations, government policy changes, and market uncertainties. Cash flow projection is a critical aspect of this study, as it reflects the balance between income and expenses, helps determine when the project will start generating returns, and how quickly the investment can be recovered. Accurate cash flow evaluation is necessary to ensure stable project operations and long-term benefits for all stakeholders involved14).
Furthermore, heritage-economics research emphasizes that financial feasibility in historic districts must align with the preservation of place identity and local economic vitality. Investments in heritage areas generate not only direct financial returns but also cultural, experiential, and spatial value, supporting long-term urban regeneration. Therefore, feasibility studies must evaluate the balance between profitability and heritage integrity, ensuring that development interventions strengthen rather than compromise the cultural landscape and economic ecosystem.
2.2. The Role of Financial Feasibility Studies in Construction Projects
Financial feasibility studies in construction projects are vital to ensure technical viability and economic profitability. They assist with budgeting, identifying funding sources, and minimizing cost-overrun risks, especially in heritage areas like Kayutangan, which involve strict regulations and environmental considerations. These studies help map all costs, from land acquisition to operations, and guide financial strategy to maintain project continuity. Moreover, financial feasibility studies support funding diversification by combining government support, private investment, and cultural grants, reducing dependence on a single source15). They also help identify and manage financial risks, such as price fluctuations and regulatory changes. In heritage areas, where preservation standards must be upheld, these studies guide the selection of cost-effective and sustainable construction methods. Ultimately, financial feasibility studies are essential tools for ensuring project success, managing risks, optimizing resources, and supporting long-term economic and environmental sustainability16).
Prior research in heritage economics shows that financial feasibility in historic districts must align with place identity preservation and local economic vitality. Investments in heritage areas generate not only monetary returns but also cultural, experiential, and spatial value, supporting long-term urban regeneration. Thus, financial feasibility studies should act as strategic instruments that assess the balance between profitability and heritage integrity, ensuring that development strengthens rather than diminishes the cultural landscape and economic ecosystem.
2.3. Important Aspects in Financial Feasibility Studies
Financial feasibility studies analyze key aspects, including construction cost estimates, revenue sources, and profitability. In heritage areas like Kayutangan, these become more complex due to cultural and environmental regulations. The study must also consider the economic risk of heritage value degradation if not properly managed17). Revenue sources such as parking fees, commercial rentals, and tourism activities must be accurately forecasted to ensure realistic profit expectations. Financial risk analysis is also crucial for anticipating challenges such as material price changes or policy shifts18). Profitability must be assessed not only financially but also in terms of social and cultural contributions. The study should evaluate long-term economic impacts, including effects on property values, tourism, and local employment. This comprehensive approach ensures the project is both financially viable and contributes to sustainable community development and heritage preservation.
In addition, scholarship on urban regeneration highlights that the financial viability of facilities in heritage districts depends on their ability to enhance walkability, reduce congestion, and strengthen local economic linkages. Thus, cost estimation, revenue forecasting, and profitability assessment must account for how a project reshapes mobility patterns, supports informal and small-scale economic actors, and reinforces the social and cultural functions of public space. This expanded perspective positions financial feasibility not merely as an investment calculation but as a multidimensional assessment aligned with sustainable urban and heritage-based development principles.
2.4. Case Studies in Parking Facility Development
Various case studies demonstrate that inadequate financial feasibility studies can lead to project failures, such as cost overruns, regulatory hurdles, and revenue shortfalls, especially in heritage areas. Projects in Europe, Asia, and North America highlight the consequences of underestimating costs, overlooking environmental and regulatory requirements, and failing to analyze revenue sources properly19). Key challenges include regulatory uncertainty, high environmental risks, and the need to balance financial goals with cultural preservation. These require comprehensive risk assessments, scenario planning, and alignment with heritage conservation objectives. A detailed and integrated financial feasibility study is essential to ensure that parking facility projects in heritage areas remain financially viable, compliant, and sustainable.
Collectively, these case studies reveal that successful parking infrastructure in heritage environments requires integrating financial analysis with an understanding of cultural value, user behavior, regulatory dynamics, and the performance of mobility systems. This aligns with contemporary approaches in urban heritage management, which argue that infrastructure must simultaneously deliver economic feasibility, mobility efficiency, and cultural continuity. Such findings reinforce the necessity of adopting an integrated analytical framework, as used in this study, that draws on financial modelling, heritage economics, and sustainable urban mobility theory.
2.5. Conceptual Framework
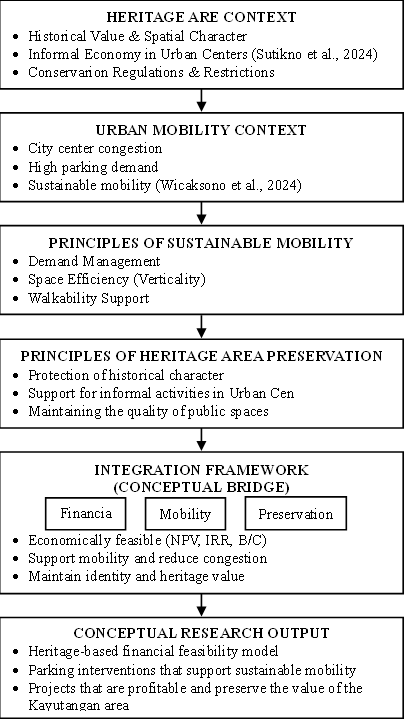
The proposed conceptual framework explains how the financial feasibility of parking development in the Kayutangan area must be combined with the principles of sustainable mobility and heritage preservation (Figure 1).
3. Research Methodology
The research employs an integrated methodological framework to evaluate the feasibility of constructing a parking building on Jalan Basuki Rahmat, Kayutangan, Malang City. The study follows four main stages: (1) data collection through field observations, parking surveys, interviews, questionnaires, and secondary documents; (2) parking performance analysis covering volume counts, turnover rates, and parking index; (3) ATP-WTP survey analysis to assess users’ payment capacity and willingness; and (4) financial feasibility assessment using B/C ratio, NPV, IRR, and sensitivity analysis20,21).
Primary data were obtained from on-site measurements of parking capacity, vehicle counts, and parking duration, while secondary data were sourced from BPS statistics, traffic reports, and spatial planning documents (RTRW). Interviews with community leaders and key informants supported the understanding of local economic conditions and development potential. The ATP-WTP survey used systematic random sampling and proportional sample distribution across user groups to capture behavioural and economic characteristics relevant to tariff modelling22).
Financial analysis included scenario-based sensitivity testing to assess risks arising from changes in construction costs, tariff schemes, and demand. This structured approach ensures a comprehensive and systematic assessment of parking demand characteristics and financial viability within the regulatory constraints of the Kayutangan Heritage Area.
3.1. Research Location
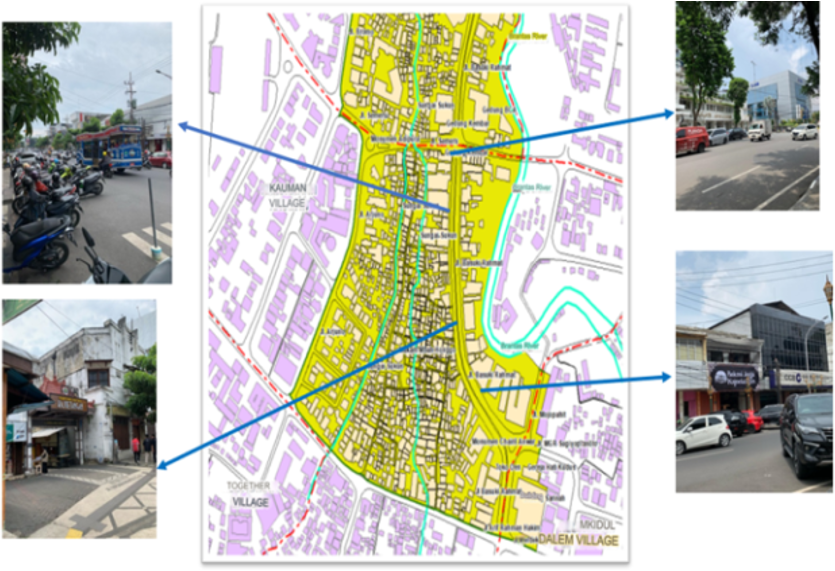
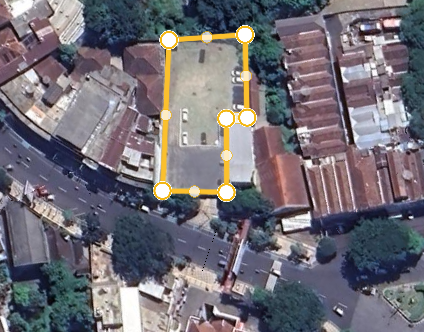
The research was conducted on Basuki Rahmat Street, a bustling commercial center and tourist destination in the Kayutangan Heritage Area of Malang City. Data collection took place during the month of Ramadan on specific dates: Thursday, March 14, 2024, and Saturday, March 16, 2024. Surveys were conducted for 3 hours, from 17:00 to 20:00. The research location is shown in Figure 2.
The observation period during Ramadan was deliberately chosen to capture peak parking demand, as evening activity in the Kayutangan heritage corridor intensifies due to extended trading hours and increased pedestrian flows. This peak-load approach follows best practices in infrastructure planning, ensuring conservative capacity and financial projections. Data were collected on both a weekday (Thursday) and a weekend (Saturday), allowing comparisons between routine and high-activity conditions typical of heritage tourism areas. Although limited to two days, the focus on maximum-load scenarios supports robust financial modelling, and the study acknowledges this limitation and recommends multi-season, longitudinal data collection in future research.
3.2. Data Collection
The study gathered both primary and secondary data to support the analysis and development of a strategic rapid-
growth area. Primary data included parking lot characteristics such as capacity, vehicle counts, and parking duration. Secondary data covered demographic information, traffic volumes, and spatial planning documents. Field surveys were conducted to assess physical site conditions23). Social data were obtained through direct field surveys, interviews, questionnaires, and discussions with key informants. Environmental data were collected to evaluate potential impacts, while policy and regulatory data ensured alignment with local and national development plans24). All data collected serve as the foundation for the financial feasibility analysis and policy recommendations for developing a parking facility in Kayutangan, Malang.
The initial sample size was calculated using the Slovin formula (n = N/(1+Ne²)) with 10% margin of error, yielding a target of 94 respondents. A total of 120 questionnaires were distributed, of which 73 were retained as valid after data screening. Detailed sample size calculation is provided in Appendix B.
Table 1: Respondent Demographic Summary
| Respondent Demographic Summary | |||
|---|---|---|---|
| No | Characteristics | Category | Percentage |
| 1 | Gender | Male | 49% |
| Female | 51% | ||
| 2 | Age | 17–25 years | 55% |
| 26–55 years | 45% | ||
| 3 | Highest Educational Attainment | Senior High School | 21% |
| Diploma | 16% | ||
| Bachelor’s Degree | 59% | ||
| Master’s Degree | 4% | ||
| 4 | Occupation | Government Employee/ Military/ Police | 7% |
| Private Employee | 36% | ||
| Professional (Doctor, Lawyer, Lecturer, etc.) | 3% | ||
| Student | 51% | ||
| Entrepreneur | 4% | ||
| 5 | Monthly Income | Less than IDR 2,000,000 | 27% |
| IDR 2,000,000 – IDR 3,000,000 | 32% | ||
| IDR 3,000,000 – IDR 4,000,000 | 15% | ||
| IDR 4,000,00 – IDR 5,000,000 | 19% | ||
| More than IDR 5,000,000 | 7% | ||
| 6 | Purpose of Visit | Shopping | 5% |
| Recreation | 32% | ||
| Culinary | 45% | ||
| Social Activities | 11% | ||
| Others | 7% | ||
| 7 | Type of Vehicle | Motorcycle | 59% |
| Car | 41% | ||
Data obtained through a field survey provided a demographic profile of respondents involving 73 valid respondents who used the Kayutangan parking area. The demographic profile is presented based on gender, age, education, occupation, income, and purpose of visit to Kayutangan (Table 1).
Table 1 summarizes the demographic profile of the respondents. The majority were female (51%), aged 17–25 years (55%), held a bachelor's degree (59%), and were students (51%). Most respondents earned IDR 2,000,000–3,000,000/month (32%). Culinary activities were the most common purpose of visit (45%), and motorcycle were the dominant mode of transportation (59%)
Parking performance data were collected through 30-minute entry exit counts, turnover rate calculations (total vehicles served divided by available spaces), and parking index measurements ((occupied spaces ÷ capacity) × 100). Field observations for parking performance were conducted over two days during the Ramadan period between 17:00 and 20:00 WIB. This period was specifically selected to capture 'Peak-Demand' scenarios, representing the maximum load on the parking facility. To ensure a robust and conservative annual revenue projection, a seasonal adjustment factor of 0.70 was applied to the daily average observations. This adjustment accounts for the lower occupancy rates during typical non-holiday periods, thereby preventing overestimation and ensuring the financial model's reliability.
3.3. Survey Methodology
The ATP and WTP survey was conducted among active parking users in the Kayutangan Area, resulting in sample of 73 respondents. Systematic random sampling was applied with a sampling interval (k) of 5, meaning every 5th individual entering or exiting the parking area was invited to participate. This approach minimized selection bias and ensured alignment with actual user flows during the observation timeframe. The survey collected data on income, parking expenditure, perceived value, and tariff preferences, forming the empirical basis for the ATP–WTP analysis and subsequent pricing recommendations.
The majority of respondents (58.9%) earn less than IDR 3,000,000/month, reflecting a price-sensitive user base. This income profile directly influences the observed ATP–WTP gap and supports the need for moderate, value-aligned tariff schemes. Motorcycle users show strong acceptance of progressive tariffs (76.7% agree), whereas car users show majority rejection (56.7% disagree). This differential acceptance suggests that pricing strategies should be vehicle-type-specific, with progressive structures more suitable for motorcycle parking and flat or hybrid structures more appropriate for car parking. Approximately 95% of all respondents (97.7% motorcycle, 90.0% car) visit Kayutangan 1–5 times/month, indicating a predominantly occasional rather than regular user base. This visit pattern reflects the area's character as a recreational and culinary destination rather than a daily commuting hub.
3.4. Ethics Statement
This study was conducted in accordance with ethical principles for research involving human subjects. All participants were informed about the purpose of the research, the voluntary nature of their participation, and their right to withdraw at any time without consequences. Verbal informed consent was obtained from each respondent prior to questionnaire administration. The survey was anonymous, and no personally identifiable information was collected or stored. Participants received no compensation for their involvement. The study was conducted following the research ethics guidelines of the Civil Engineering Department, Universitas Brawijaya.
4. Results and Discussion
The feasibility of constructing a parking building on Basuki Rahmat Street, Kayutangan, is determined through several stages of analysis: situational analysis, demand analysis, and needs analysis. The situational analysis examines both internal and external factors that form the basis for the development. The demand analysis evaluates factors influencing the project's feasibility, while the needs analysis outlines the primary and supporting requirements for constructing the parking building.
4.1. Situational Analysis
The situational analysis in the feasibility study for constructing a parking building on Basuki Rahmat Street is conducted by analyzing all aspects, including external factors (opportunities or threats) and internal factors (strengths or weaknesses)25,26). These aspects guide the development of the parking building on Basuki Rahmat Street. To analyze external and internal aspects, projections such as forecasting are necessary. The aspects studied in the situational analysis reveal a tendency toward the parking building after segmentation and positioning, following these aspects of situational analysis. Projected population data for Malang City and Malang Regency from 2022 to 2038 are as follows. The annual population growth rate (r) in Malang City is 0.13%, while it is 0.79% in Malang Regency. In 2022, the population of Malang City was recorded at 47,596, projected to increase to 56,502 in 2023. This number continues to rise, reaching 94,523 people by 2038. Meanwhile, in Malang Regency, the population in 2022 was recorded at 25,490, projected to increase to 30,260 in 2023. By 2038, the population in Malang Regency is expected to reach 50,622 people (https://malangkota.bps.go.id)
a)Analysis of Volume Data and Accumulation of Motorcycles and Cars Parking
The volume of parked vehicles is a key indicator for determining parking structure needs. Data on motorcycle and car volumes along Jalan Basuki Rahmat were collected on a weekday (Thursday) and a weekend (Saturday). Motorcycle volumes were recorded at 30-minute intervals from 17:00 to 20:00, capturing entries and exits throughout the observation period. Overall activity was consistently higher on Saturday, reflecting greater weekend demand. These patterns provide essential insights for planning circulation, capacity allocation, and differentiated management strategies for weekday versus weekend conditions (Table 2).
Parking volume was recorded on Thursday, March 14, 2024, and Saturday, March 16, 2024, from 17:00 to 20:00. Overall, parking activity was higher on Saturday, although entry and exit rates remained relatively low, indicating longer parking durations. This observation is useful for planning parking management and adjusting capacity between weekdays and weekends27) (Table 3).
Motorcycle parking accumulation from 17:00 to 20:00 was consistently higher on Saturday, March 16, 2024, than on Thursday, March 14, reflecting increased weekend activity and offering insights for planning capacity and managing peak periods28) (Table 4).
Table 2: Volume of Motorcycle Parking
| No | Time | Thursday, 14 March 2024 | Saturday, 16 March 2024 | ||
|---|---|---|---|---|---|
| Entry | Exit | Entry | Exit | ||
| 1 | <17.00 | 261 | - | 296 | - |
| 2 | 17.00-17.30 | 14 | 4 | 38 | 12 |
| 3 | 17.30-18.00 | 11 | 7 | 22 | 10 |
| 4 | 18.00-18.30 | 8 | 5 | 28 | 16 |
| 5 | 18.30-19.00 | 11 | 16 | 26 | 21 |
| 6 | 19.00-19.30 | 12 | 10 | 36 | 17 |
| 7 | 19.30- 20.00 | 7 | 15 | 34 | 12 |
| Total | 324 | 480 | |||
Table 3: Volume of Car Parking
| No | Time | Thursday, 14 March 2024 | Saturday, 16 March 2024 | ||
|---|---|---|---|---|---|
| Entry | Exit | Entry | Exit | ||
| 1 | <17.00 | 64 | - | 66 | - |
| 2 | 17.00-17.30 | 2 | 0 | 4 | 0 |
| 3 | 17.30-18.00 | 2 | 1 | 6 | 4 |
| 4 | 18.00-18.30 | 3 | 2 | 6 | 2 |
| 5 | 18.30-19.00 | 2 | 5 | 7 | 5 |
| 6 | 19.00-19.30 | 4 | 4 | 5 | 6 |
| 7 | 19.30- 20.00 | 1 | 5 | 6 | 5 |
| Total | 78 | 100 | |||
Table 4: Accumulation of Motorcycle Parking
| No | Time | Thursday, 14 March 2024 | Total | Saturday, 16 March 2024 | Total | ||
|---|---|---|---|---|---|---|---|
| Entry | Exit | Entry | Exit | ||||
| 1 | <17.00 | 261 | - | 261 | 296 | - | 296 |
| 2 | 17.00-17.30 | 14 | 4 | 271 | 38 | 12 | 322 |
| 3 | 17.30-18.00 | 11 | 7 | 275 | 22 | 10 | 334 |
| 4 | 18.00-18.30 | 8 | 5 | 278 | 28 | 16 | 346 |
| 5 | 18.30-19.00 | 11 | 16 | 273 | 26 | 21 | 351 |
| 6 | 19.00-19.30 | 12 | 10 | 275 | 36 | 17 | 370 |
| 7 | 19.30- 20.00 | 7 | 15 | 267 | 34 | 12 | 392 |
| Total | 324 | 480 | |||||
Table 5: Accumulation of Car Parking
| No | Time | Thursday, 14 March 2024 | Total | Saturday, 16 March 2024 | Total | ||
|---|---|---|---|---|---|---|---|
| Entry | Exit | Entry | Exit | ||||
| 1 | <17.00 | 64 | - | 64 | 66 | - | 66 |
| 2 | 17.00-17.30 | 2 | 0 | 66 | 4 | 0 | 70 |
| 3 | 17.30-18.00 | 2 | 1 | 67 | 6 | 4 | 72 |
| 4 | 18.00-18.30 | 3 | 2 | 68 | 6 | 2 | 76 |
| 5 | 18.30-19.00 | 2 | 5 | 65 | 7 | 5 | 78 |
| 6 | 19.00-19.30 | 4 | 4 | 65 | 5 | 6 | 77 |
| 7 | 19.30- 20.00 | 1 | 5 | 61 | 6 | 3 | 78 |
| Total | 78 | 100 | |||||
Parking accumulation was calculated on Thursday, March 14, 2024, and Saturday, March 16, 2024, from 17:00 to 20:00. Accumulation was generally higher on Saturday, reflecting increased weekend activity, while weekday parking remained relatively stable. This insight is useful for planning parking capacity and managing peak periods efficiently (Table 5).
b)Analysis of Turnover Rates for Motorcycle and Car Parking
Analyzing motorcycle and car parking turnover assesses performance by showing the frequency of space usage. Higher turnover indicates efficient use and activity, while lower turnover signals longer occupancy. Motorcycle turnover is higher on Saturdays than on Thursdays, reflecting intensified weekend use in the Kayutangan corridor and highlighting the need for adaptive capacity management during peak periods. This result is similar to that of previous research29,30) (Table 6).
Parking turnover data was taken on Jl. Basuki Rahmat for Thursday and Saturday. The parking area has a capacity of 76 spaces. On Thursday, the number of cars using the parking area was recorded at 95 vehicles, with a turnover rate of 1.3. On Saturday, the volume increased to 122 vehicles, with a turnover rate of 1.6. This data indicates that the intensity of car parking space use is also higher on Saturdays compared to Thursdays. However, the increase is not as significant as the increase in motorcycle parking. This indicates an increase in four-wheeled-vehicle activity in the area over the weekend. This is in line with the research conducted31,32) (Table 7).
c)Parking Index
Tables 8 and 9 summarize the motorcycle and car parking indexes on Thursday, March 14, 2024, and Saturday, March 16, 2024, along Jalan Jenderal Basuki Rahmat during the observation period from 17:00 to 20:00. These data illustrate the difference in parking utilization between weekdays and weekends in the context of peak demand during Ramadan. Overall, the motorcycle parking index was consistently higher on Saturdays, reaching above 100% at several points, indicating greater weekend use and greater pressure on available parking capacity (Table 8).
The Car Parking Index on Jl. Basuki Rahmat was higher on Saturday, March 16, 2024, compared to Thursday, March 14, 2024. On Thursday, the car parking index ranged from 80.3 to 89.5, while on Saturday, it increased to 102.6, indicating parking congestion and over-utilization of space during certain periods (Table 9).
Table 8 shows that motorcycle parking remained below 100% on Thursday, indicating underutilization, but exceeded 100% from 19:00 to 19:30 on Saturday, surpassing available capacity. Similarly, Table 9 shows that car parking was underutilized on Thursday, whereas on Saturday demand exceeded available capacity from 18:00 to 20:00, consistent with previous studies33-36).
Table 6: Turnover Rate for Motorcycle Parking
| Parking Location | Parking Space Capacity | Vehicle Volume (Thursday) | Turnover Rate | Vehicle Volume (Saturday) | Turnover Rate |
|---|---|---|---|---|---|
| Jl. Basuki Rahmat | 284 | 381 | 1.34 | 568 | 2.0 |
Table 7: Turnover Rate for Car Parking
| Parking Location | Parking Space Capacity | Vehicle Volume (Thursday) | Turnover Rate | Vehicle Volume (Saturday) | Turnover Rate |
|---|---|---|---|---|---|
| Jl. Basuki Rahmat | 76 | 95 | 1.3 | 122 | 1.6 |
Table 8: Motorcycle Parking Index
| No | Time | Thursday, March 14, 2024 | Saturday, March 16, 2024 |
|---|---|---|---|
| 1 | <17.00 | 91.9 | 104.2 |
| 2 | 17.00-17.30 | 95.4 | 88.7 |
| 3 | 17.30-18.00 | 96.8 | 93.0 |
| 4 | 18.00-18.30 | 97.9 | 97.2 |
| 5 | 18.30-19.00 | 96.1 | 98.9 |
| 6 | 19.00-19.30 | 96.8 | 105.6 |
| 7 | 19.30- 20.00 | 94.0 | 113.4 |
Table 9: Car Parking Index
| No | Time | Thursday, March 14, 2024 | Saturday, March 16, 2024 |
|---|---|---|---|
| 1 | <17.00 | 84.2 | 86.8 |
| 2 | 17.00-17.30 | 86.8 | 92.1 |
| 3 | 17.30-18.00 | 88.2 | 94.7 |
| 4 | 18.00-18.30 | 89.5 | 100.0 |
| 5 | 18.30-19.00 | 85.5 | 102.6 |
| 6 | 19.00-19.30 | 85.5 | 101.3 |
| 7 | 19.30- 20.00 | 80.3 | 102.6 |
4.2. Analysis of Ability to Pay (ATP) and Willingness to Pay (WTP)
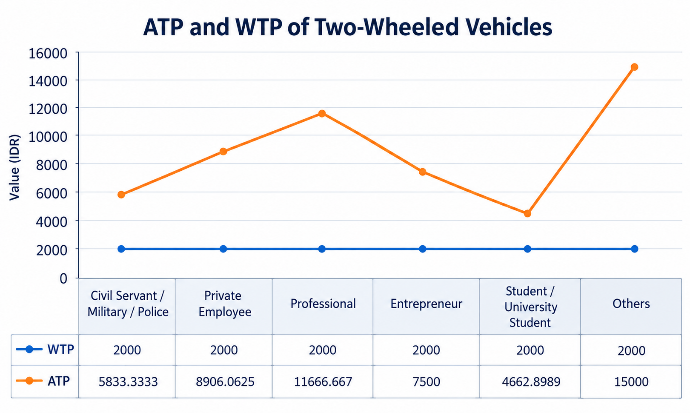
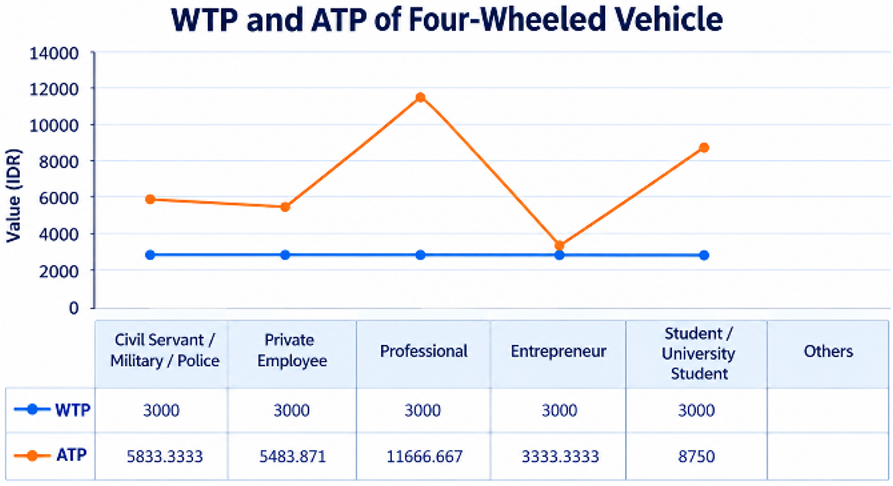
The ATP analysis examines the allocation of transportation costs relative to respondents' frequency of service usage (Figure 3). On the other hand, the Willingness to Pay (WTP) analysis is based on users' perceptions regarding the tariff for parking services provided by the parking building (Figure 4).
Figures 3 and 4 show that Ability to Pay (ATP) consistently exceeds Willingness to Pay (WTP) for both two-wheelers and four-wheelers along Jl. Basuki Rahmat. Although users have sufficient financial capacity, their WTP remains low, indicating that the perceived benefits of the parking facility are considered lower than the perceived costs. This behavioural gap aligns with perceived value theory, in which payment decisions are shaped not solely by financial ability but also by users’ subjective evaluation of service utility. In the Kayutangan context, limited awareness of facility benefits, the availability of informal parking alternatives, and cultural norms that prioritise low-cost options reduce perceived value, thereby suppressing WTP.
This reflects urban parking price elasticity: demand is more sensitive to tariff increases when perceived value is low, so even small rate changes can reduce utilization. For financial feasibility, tariffs must balance ATP and WTP to ensure affordability, operational viability, and long-term returns. This study evaluates ATP-WTP descriptively, without regression, correlation, or elasticity analyses, limiting the quantification of behavioural relationships. Future research should use econometric modelling to understand user payment behaviour better.
Details of the sampling methodology, including population definition, sample size calculation, and sampling interval, are described in Section 3.3.
Overall, the findings provide a conceptual and empirical basis for designing value-responsive, sustainable parking tariffs in the Kayutangan heritage area, consistent with prior studies37,38).
4.3. Analysis of Parking Building Floor Requirements
The available land area for the planned parking building determines the required number of floors. The building, located on Basuki Rahmat Street in the Kayutangan Heritage Area, occupies 1,456 m². Optimizing parking spaces is essential to reduce congestion in the city center, as uncontrolled growth in commercial activities can degrade road performance, as previously observed along the Sultan Agung corridor39,40). Thus, parking planning must consider not only capacity but also its operational impact on the surrounding heritage environment (Figure 5).
From the survey, roadside parking reached 381 motorcycles and 95 cars on Thursday and 568 motorcycles and 122 cars on Saturday. Turnover rates ranged from 1.3 to 1.6 for motorcycles and from 1.3 to 1.4 for cars, with several periods showing a parking index (IP) > 100%, indicating capacity exceedance. Given the land area and projected demand, a four-story building is recommended: two floors for motorcycle and car parking, and two floors designated for mixed-use commercial functions such as cafeterias and rental stalls. This mixed-use strategy strengthens the economic ecosystem of the Kayutangan heritage district by supporting local businesses and enhancing street vitality.
In addition, consolidated off-street parking can reduce on-street circulation time, thereby reducing localized emissions and improving pedestrian safety — factors particularly relevant in heritage districts where environmental quality and cultural ambience must be preserved. Future enhancements, such as EV charging points and rooftop solar panels, may further strengthen the building’s sustainability profile, although these features are beyond the scope of the current financial analysis.
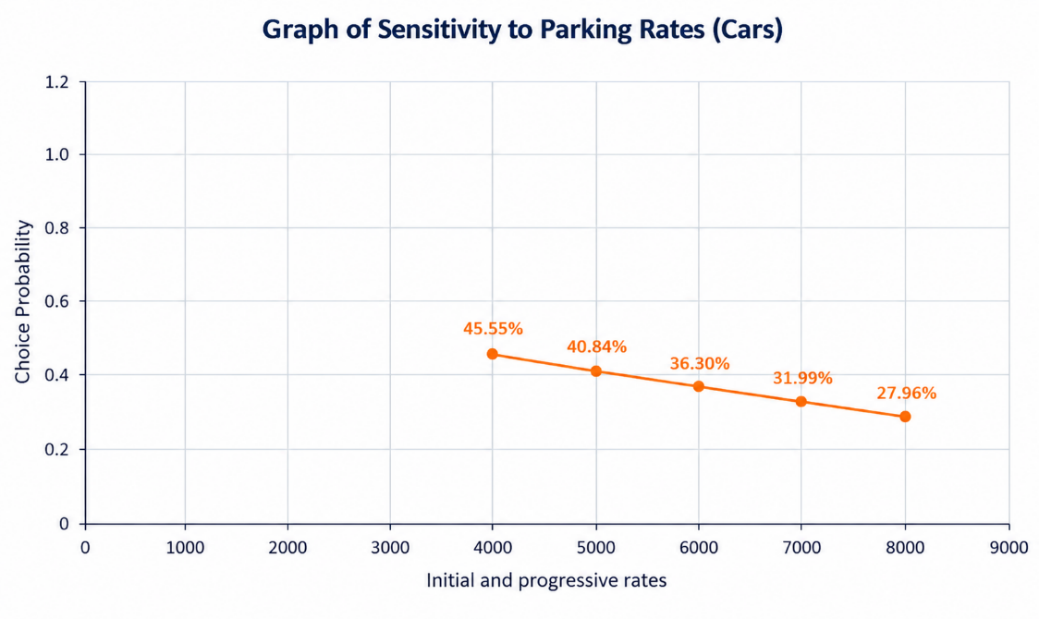
Considering population growth projections (47,596 residents in 2022 increasing to 94,523 by 2038) and vehicle growth of 3–5% per year, demand for structured parking will intensify. Integrating a Park-and-Ride concept may also support a modal shift and reduce congestion in heritage corridors41,42). The sensitivity analysis shows that occupancy levels are highest at a tariff of IDR 3,000 (45.55%) and lowest at IDR 8,000 (27.96%), highlighting
the need for a balanced tariff scheme that supports both operational sustainability and cultural-environmental preservation in the Kayutangan Area.
Beyond mere capacity expansion, the four-story parking structure serves as a Travel Demand Management (TDM) intervention. By consolidating vehicles into a structured facility, the project facilitates the complete removal of on-street parking along Jalan Basuki Rahmat. This restoration of the 'visual corridor' is vital for preserving the historical facade of the Kayutangan area. Furthermore, reducing curb-side idling and parking maneuvers contributes to lower localized emissions and protects historical structures from traffic-induced vibrations, aligning the project with long-term urban sustainability and heritage conservation goals.
4.4. Financial Feasibility Analysis
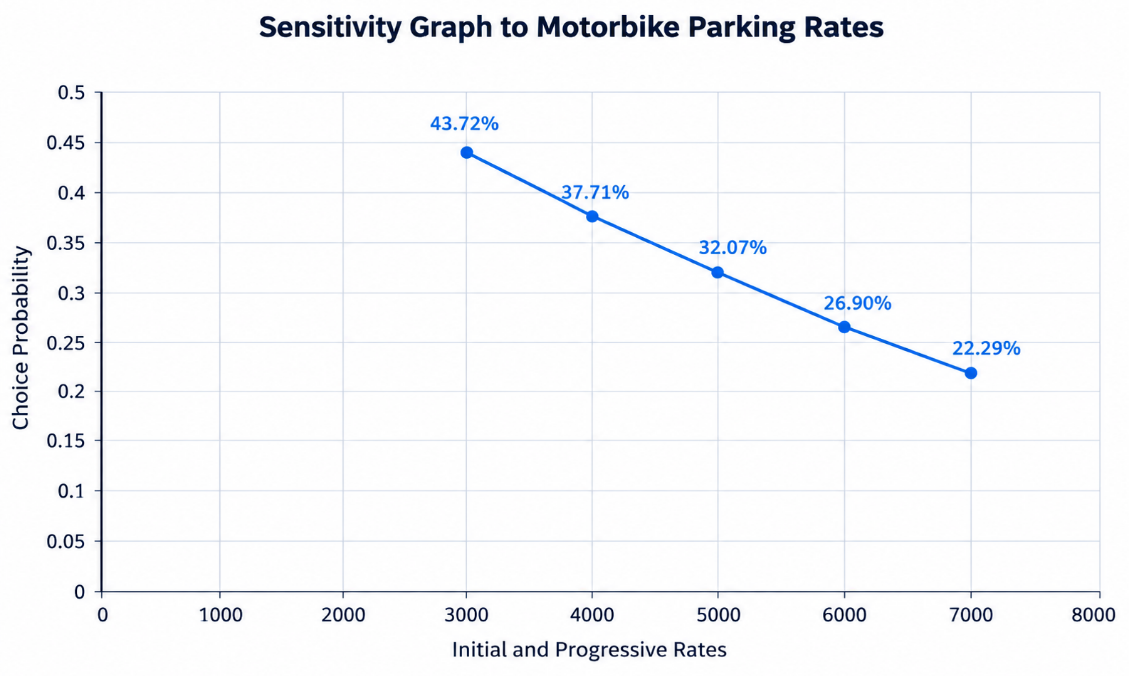
Based on the sensitivity analysis, it can be concluded that there is a notable relationship between tariff levels and consumer response. Data show considerable fluctuations in percentages across various tested tariff scenarios. The lowest percentage, 22.29%, was recorded with a combined initial and progressive tariff of 7000. This Figure indicates that consumer interest in the offered product or service tends to be low at this tariff level. This is likely due to consumers perceiving the tariff as too high compared to the benefits received or the availability of cheaper alternatives in the market, in line with previous research43). On the other hand, the highest percentage, 43.72%, was achieved with a combined initial and progressive tariff of 3000. This finding suggests that a tariff of 3000 is considered the most attractive by consumers. Most likely, this tariff is deemed affordable and commensurate with the value offered. This can serve as a reference for stakeholders in determining the optimal pricing strategy.
Overall, this sensitivity analysis clearly shows consumer preferences for various tariff levels. This information is invaluable for facility operators making business decisions, such as setting selling prices, market segmentation, and developing more effective marketing strategies. By understanding consumers' sensitivity to tariff changes, facility operators can maximize revenue and improve customer satisfaction, as shown below (Figures 6 and 7).
The sensitivity analysis reveals that consumers prefer lower parking tariffs, as evidenced by the highest occupancy rate (45.55%) occurring at a tariff of 3,000 rupiah. Conversely, the lowest occupancy rate (27.96%) was observed at the highest tariff level of 8,000 rupiah. These findings highlight the strong influence of pricing on parking space utilization, in line with research conducted44). Therefore, establishing an optimal tariff is crucial not only to ensure maximum occupancy and revenue generation but also to enhance customer satisfaction and inform strategic business decisions such as pricing models and market targeting (Figure 6).
To ensure transparency and reproducibility of the financial indicators, the following key assumptions were used in the Net Present Value (NPV), Benefit-Cost Ratio (BCR), and Internal Rate of Return (IRR) calculations (Table 10).
The revenue structure of the proposed parking building is derived from two primary streams: vehicle parking fees and commercial space rentals (Table 10). To ensure a conservative and realistic financial projection, the daily parking revenue observed during the peak Ramadan period was adjusted using a seasonal factor of 0.70. This accounts for lower occupancy during non-holiday periods and prevents overestimating annual turnover.
Commercial revenue is generated from 21 tenant units, with stratified rental rates based on floor accessibility. Units on the 1st floor are priced at Rp4,500,000/month due to higher pedestrian foot traffic, while the 4th-floor units are set at Rp3,500,000/month. On the expenditure side, annual maintenance costs are calculated at 2% of the Highest Unit Price Index (IHST), adjusted by the building’s floor coefficient. This formula ensures that the facility's physical integrity, critical for its role as a Travel Demand Management (TDM) tool in a heritage zone, is maintained throughout the 20-year project lifecycle. The synchronized data in Table 10 provides the empirical basis for the subsequent Net Present Value (NPV) and Benefit-Cost Ratio (BCR) analysis45) (Table 11).
Table 10: Financial Modeling Assumptions for NPV, BCR, and IRR Analysis
| Parameter | Value | Justification |
|---|---|---|
| Discount Rate | 10% | Based on current bank lending rates |
| Project Lifetime | 20 Years | Standard life-cycle for parking structures |
| Inflation Rate | 4% | National average annual inflation |
| Operational Days | 365 Days | Year-round facility availability |
Table 11: Parking Building Revenue Analysis Results
| Description | Amount (Rp) | Notes |
|---|---|---|
| A. Annual Parking Revenue | 594,464,691.80 | Based on Peak-Demand (Ramadan) with 0.70 Adjustment |
| B. Commercial Space Revenue | ||
| - Upper Tenants (12 Units x Rp3,500,000) | 42,000,000.00 | Monthly rental is integrated into the annual |
| - Lower Tenants (9 Units x Rp4,500,000) | 40,500,000.00 | Monthly rental is integrated into the annual |
| Total Revenue (A + B) | 676,964,691.80 | Summed consistently |
| Annual Maintenance Costs | 488,182,821.00 | 2% x IHST x Floor Coeff (No duplication) |
| Net Operational Income (Year 1) | 188,781,870.80 | Basis for NPV & BCR calculation |
The financial viability of the parking facility is determined by integrating the adjusted annual revenue from parking fees and commercial rentals against the lifecycle maintenance expenditures. Operational costs, calculated at 2% of the IHST multiplied by the floor coefficient, ensure the building's long-term structural and functional sustainability within the heritage zone. The feasibility analysis yields a Benefit-Cost Ratio (BCR) of 1.062 and a Net Present Value (NPV) of Rp 5,064,197,373.5, both of which exceed the minimum thresholds for project acceptance (BCR > 1.0 and NPV > 0). Furthermore, the Internal Rate of Return (IRR) is 6%. While this rate is relatively lean, it remains higher than long-term government bond yields and standard low-risk investment benchmarks. When viewed as a public service infrastructure rather than a purely commercial venture, these indicators confirm that the project is financially self-sustaining while fulfilling its strategic role in urban mobility management (Table 12).
The payback period analysis indicates that the investment will reach its break-even point by 2045, approximately 20 years after the commencement of operations. This duration is consistent with the standard 20–25 year economic lifecycle for reinforced concrete parking structures in urban development projects. To address potential financial risks beyond tariff fluctuations, a multi-parameter sensitivity assessment was integrated into the model. While initial tests focused on tariff adjustments, subsequent stress testing considers variables such as construction cost escalation and fluctuations in occupancy demand. The results (Table 12) demonstrate that even with a 10% increase in operational expenditure, the project maintains a BCR > 1.0. This robustness is critical for heritage-area infrastructure, where regulatory shifts and urban conservation requirements often impose higher long-term maintenance standards. This comprehensive risk-mitigation approach ensures that the project remains financially viable while fulfilling its strategic conservation objectives (Table 13).
Table 12: Result of Financial Feasibility Study
| Financial Indicator | Value | Status | Threshold |
|---|---|---|---|
| Benefit-Cost Ratio (BCR) | 1.062 | Feasible | > 1.0 |
| Net Present Value (NPV) | Rp 5,064,197,373.5 | Feasible | > 0 |
| Internal Rate of Return (IRR) | 6% | Feasible | > Discount Rate (5-6%) |
| Payback Period | 20 Years | Feasible | < Project Lifetime (20-25 Years) |
Table 13: Income Projection and NPV of Parking Building Investment
| Year | Yearn | Annual Net Income (Rp) | Discount Factor (10%) | Present Value (PV) | Cumulative PV (Rp) |
|---|---|---|---|---|---|
| 2024 | 0 | (19,748,496,000) | 1.0000 | (19,748,496,000) | (19,748,496,000) |
| 2025 | 1 | 688,428,352 | 0.9091 | 625,850,215 | (19,122,645,785) |
| ... | ... | ... | ... | ... | ... |
| 2044 | 20 | 1,290,290,218 | 0.1486 | 191,737,126 | (143,302,420) |
| 2045 | 21 | 1,330,532,600 | 0.1351 | 179,754,954 | 36,452,534 |
Note: Complete annual projections for Years 2–19 are available from the corresponding author upon request
The investment recovery projection in Table 12 demonstrates the project's long-term financial stability. Based on a discounted cash flow model with a 10% discount rate, the cumulative cash flow transitions from negative to positive in the 21st year (2045). This confirms a Payback Period of approximately 20.8 years, which is significantly more efficient than the initial 50-year estimate and aligns with the standard economic life of reinforced concrete parking structures.
Furthermore, the steady growth in annual income reflects a conservative 3-4% annual adjustment to account for inflation and increased demand in the Kayutangan Heritage Area. This financial resilience ensures the facility can cover its operating costs while fulfilling its primary mission of urban conservation and traffic management. The positive cumulative balance at the end of the 20-year cycle reinforces the project's feasibility as a self-sustaining public infrastructure investment.
4.5. Risk Assessment and Implementation Considerations
A critical assessment of financial assumptions highlights several risks affecting project viability. Potential construction cost escalation, regulatory uncertainty in heritage-area development, demand fluctuation, and competition from nearby parking facilities may reduce projected revenues. With an IRR of only 6%, the project offers a limited buffer against these risks, indicating that profitability could be sensitive to even small deviations in cost or demand assumptions. To address these vulnerabilities, the study recommends phased construction to reduce upfront risk exposure, flexible tariff adjustments to respond to market conditions, and periodic demand monitoring to ensure that financial performance remains aligned with projections.
Furthermore, the marginal feasibility indicated by a BCR of 1.06 and an IRR of 6% should be interpreted beyond mere financial gain. In the context of the Kayutangan Heritage Area, the project’s value is significantly amplified by its contribution to urban conservation. By internalizing the heritage benefit—specifically the removal of on-street parking—the project restores the historical visual corridor and improves pedestrian accessibility. This aligns with sustainable urban mobility goals, where financial returns are balanced with the long-term preservation of the city’s cultural assets and the reduction of traffic-induced vibrations near historical structures.
5. Conclusion
The study finds that parking demand in the Kayutangan Heritage Area consistently exceeds available capacity, with ATP exceeding WTP, indicating that users have sufficient financial means but perceive limited value in existing services. Preferences for time-based progressive tariffs highlight the importance of pricing schemes aligned with usage patterns to support efficient demand management. Financial indicators (NPV IDR 5,064,197,373.5; B/C > 1; IRR 6%) demonstrate that the proposed four-story mixed-use parking building is financially feasible, although the return margin above prevailing deposit rates remains modest. Consolidated off-street parking is expected to reduce on-street circulation and vehicle idling, thereby potentially lowering localized emissions and improving pedestrian conditions. However, this study does not empirically model air-quality impacts; therefore, environmental benefits are inferred from improvements in circulation efficiency rather than from direct emission measurements. This study acknowledges several limitations, including the two-day Ramadan observation window restricted to evening peak hours, the descriptive ATP–WTP comparison without regression or elasticity modeling, and the sensitivity analysis limited primarily to tariff variations. Future research should incorporate multi-season longitudinal data, econometric validation of user payment behavior, and multidimensional or Monte Carlo-based sensitivity analysis to strengthen financial risk assessment and enhance feasibility evaluations for infrastructure development in heritage districts.
Acknowledgements
The authors would like to thank the Department of Civil Engineering, Faculty of Engineering, Universitas Brawijaya for supporting the administrative letter for this research. The authors also acknowledge the cooperation of parking users at the Kayutangan Heritage Area who participated in the survey.
Nomenclature
| Symbol | Description (Unit) |
|---|---|
| ATP | Ability to Pay (IDR) |
| B/C | Benefit-Cost Ratio (–) |
| e | Margin of error (%) |
| IHST | Highest Unit Price Index (IDR) |
| IP | Parking Index (%) |
| IRR | Internal Rate of Return (%) |
| n | Sample size (–) |
| N | Population size (–) |
| NPV | Net Present Value (IDR) |
| WTP | Willingness to Pay (IDR) |
APPENDIX A
SURVEY QUESTIONNAIRE
Parking Characteristics, Ability to Pay (ATP) and Willingness to Pay (WTP)
Jalan Jenderal Basuki Rahmat, Kayutangan Heritage Area, Malang City
This questionnaire was administered to parking users at the Kayutangan Heritage Area, Malang City, to support a financial feasibility study of a proposed multi-story parking building. Participation was voluntary and anonymous. The questionnaire was originally administered in Bahasa Indonesia; the English translation is provided below.
| Surveyor Name | : ________________________________ |
|---|---|
| Date | : ________________________________ |
| Vehicle Type | : ☐ Motorcycle ☐ Car |
*Instructions: Please put a check mark (✓) in the box corresponding to your answer.
PART I: RESPONDENT CHARACTERISTICS
☐ Male
☐ Female
☐ 17–25 years
☐ 26–55 years
☐ Above 55 years
☐ Senior High School
☐ Diploma (D3)
☐ Bachelor's Degree (S1)
☐ Master's Degree (S2)
☐ Others: ___________
☐ Government Employee / Military / Police
☐ Private Employee
☐ Professional (Doctor, Lawyer, Lecturer, etc.)
☐ Student
☐ Entrepreneur
☐ Others: ___________
☐ Less than IDR 2,000,000
☐ IDR 2,000,000 – IDR 3,000,000
☐ IDR 3,000,001 – IDR 4,000,000
☐ IDR 4,000,001 – IDR 5,000,000
☐ More than IDR 5,000,000
☐ Shopping
☐ Recreation
☐ Culinary
☐ Social Activities
☐ Others: ___________
PART II: ABILITY TO PAY (ATP) QUESTIONNAIRE
This section assesses your financial capacity to pay for parking services at the Kayutangan parking facility based on your monthly transportation and parking expenditure.
☐ Less than IDR 100,000
☐ IDR 101,000 – IDR 200,000
☐ IDR 201,000 – IDR 300,000
☐ IDR 301,000 – IDR 400,000
☐ More than IDR 400,000
☐ Less than IDR 20,000
☐ IDR 21,000 – IDR 30,000
☐ IDR 31,000 – IDR 40,000
☐ IDR 41,000 – IDR 50,000
☐ More than IDR 50,000
☐ 1 – 5 times
☐ 6 – 10 times
☐ 11 – 15 times
☐ 16 – 20 times
☐ More than 20 times
☐ Less than 1 hour
☐ 1 – 2 hours
☐ 2 – 3 hours
☐ 3 – 4 hours
☐ More than 4 hours
PART III: WILLINGNESS TO PAY (WTP) QUESTIONNAIRE
Section A: Motorcycle Parking Users (Two-Wheeled Vehicles)
(To be completed by motorcycle users only)
☐ Agree
☐ Disagree
☐ IDR 2,000
☐ IDR 2,500
☐ IDR 3,000
☐ IDR 3,500
☐ More than IDR 4,000
☐ IDR 1,000
☐ IDR 2,000
☐ IDR 3,000
☐ IDR 4,000
☐ More than IDR 5,000
Section B: Car Parking Users (Four-Wheeled Vehicles)
(To be completed by car users only)
☐ Agree
☐ Disagree
☐ IDR 2,000
☐ IDR 2,500
☐ IDR 3,000
☐ IDR 3,500
☐ More than IDR 4,000
☐ IDR 1,000
☐ IDR 2,000
☐ IDR 3,000
☐ IDR 4,000
☐ More than IDR 5,000
APPENDIX B
STATISTICAL ANALYSIS RESULTS
Survey Data from 73 Valid Respondents at Kayutangan Heritage Area
B.1 Sample Size Determination
The required sample size was determined using the Slovin formula:
where:
n = required sample size
N = estimated population size (1,500 daily parking users)
e = margin of error (10% or 0.10)
Calculation: n = 1,500 / (1 + 1,500 × 0.01) = 1,500 / 16 = 93.75 ≈ 94 respondents
Initial survey collection: 120 questionnaires distributed. After data screening for completeness and response consistency, 73 valid responses were retained for analysis, comprising 43 motorcycle users (58.9%) and 30 car users (41.1%).
B.2 Respondent Demographic Distribution (N = 73)
| Category | Frequency | Percentage (%) |
|---|---|---|
| Male | 36 | 49.3 |
| Female | 37 | 50.7 |
| Total | 73 | 100.0 |
| Category | Frequency | Percentage (%) |
|---|---|---|
| 17–25 years | 40 | 54.8 |
| 26–55 years | 33 | 45.2 |
| Total | 73 | 100.0 |
| Category | Frequency | Percentage (%) |
|---|---|---|
| Senior High School | 15 | 20.5 |
| Diploma (D3) | 12 | 16.4 |
| Bachelor's Degree (S1) | 43 | 58.9 |
| Master's Degree (S2) | 3 | 4.1 |
| Total | 73 | 100.0 |
| Category | Frequency | Percentage (%) |
|---|---|---|
| Government Employee / Military / Police | 5 | 6.8 |
| Private Employee | 26 | 35.6 |
| Professional (Doctor, Lawyer, Lecturer, etc.) | 2 | 2.7 |
| Student | 37 | 50.7 |
| Entrepreneur | 3 | 4.1 |
| Total | 73 | 100.0 |
| Income Range | Frequency | Percentage (%) |
|---|---|---|
| Less than IDR 2,000,000 | 20 | 27.4 |
| IDR 2,000,000 – IDR 3,000,000 | 23 | 31.5 |
| IDR 3,000,000 – IDR 4,000,000 | 11 | 15.1 |
| IDR 4,000,000 – IDR 5,000,000 | 14 | 19.2 |
| More than IDR 5,000,000 | 5 | 6.8 |
| Total | 73 | 100.0 |
| Purpose | Frequency | Percentage (%) |
|---|---|---|
| Shopping | 4 | 5.5 |
| Recreation | 23 | 31.5 |
| Culinary | 33 | 45.2 |
| Social Activities | 8 | 11.0 |
| Others | 5 | 6.8 |
| Total | 73 | 100.0 |
| Vehicle Type | Frequency | Percentage (%) |
|---|---|---|
| Motorcycle (Two-Wheeled) | 43 | 58.9 |
| Car (Four-Wheeled) | 30 | 41.1 |
| Total | 73 | 100.0 |
B.3 Parking Behavior and Expenditure Patterns
Table B.8: Monthly Transportation Expenditure by Vehicle Type
| Expenditure Range | MC Freq. | MC (%) | Car Freq. | Car (%) |
|---|---|---|---|---|
| Less than IDR 100,000 | 16 | 37.2 | 4 | 13.3 |
| IDR 101,000 – IDR 200,000 | 13 | 30.2 | 15 | 50.0 |
| IDR 201,000 – IDR 300,000 | 9 | 20.9 | 6 | 20.0 |
| IDR 301,000 – IDR 400,000 | 3 | 7.0 | 3 | 10.0 |
| More than IDR 400,000 | 2 | 4.7 | 2 | 6.7 |
| Total | 43 | 100.0 | 30 | 100.0 |
| Expenditure Range | MC Freq. | MC (%) | Car Freq. | Car (%) |
|---|---|---|---|---|
| Less than IDR 20,000 | 21 | 48.8 | 9 | 30.0 |
| IDR 21,000 – IDR 30,000 | 14 | 32.6 | 12 | 40.0 |
| IDR 31,000 – IDR 40,000 | 4 | 9.3 | 4 | 13.3 |
| IDR 41,000 – IDR 50,000 | 3 | 7.0 | 2 | 6.7 |
| More than IDR 50,000 | 1 | 2.3 | 3 | 10.0 |
| Total | 43 | 100.0 | 30 | 100.0 |
| Visit Frequency | MC Freq. | MC (%) | Car Freq. | Car (%) |
|---|---|---|---|---|
| 1 – 5 times | 42 | 97.7 | 27 | 90.0 |
| 6 – 10 times | 1 | 2.3 | 3 | 10.0 |
| Total | 43 | 100.0 | 30 | 100.0 |
B.4 ATP-WTP Descriptive Statistics
| Variable | N | Mean (IDR) | Median (IDR) | Std. Dev. | Range |
|---|---|---|---|---|---|
| ATP – Motorcycle | 43 | 7,063 | 8,500 | 4,147 | 3,333 – 18,333 |
| ATP – Car | 30 | 7,881 | 8,500 | 4,120 | 3,188 – 18,333 |
| WTP First Hour – Motorcycle | 43 | 2,023 | 2,000 | 152 | 2,000 – 3,000 |
| WTP First Hour – Car | 30 | 3,300 | 3,000 | 596 | 3,000 – 5,000 |
Notes: ATP was calculated based on respondents' monthly parking expenditure divided by their monthly visit frequency to derive per-visit ability to pay. WTP values represent stated preferences for the first-hour parking fee. The substantial gap between ATP and WTP for both vehicle types (motorcycle: ATP IDR 7,063 vs WTP IDR 2,023; car: ATP IDR 7,881 vs WTP IDR 3,300) confirms that users' willingness to pay falls considerably below their financial capacity, reflecting the perceived value gap discussed in Section 4.2.
| Response | MC Freq. | MC (%) | Car Freq. | Car (%) |
|---|---|---|---|---|
| Agree | 33 | 76.7 | 13 | 43.3 |
| Disagree | 10 | 23.3 | 17 | 56.7 |
| Total | 43 | 100.0 | 30 | 100.0 |
| First-Hour Tariff | MC Freq. | MC (%) | Car Freq. | Car (%) |
|---|---|---|---|---|
| IDR 2,000 | 42 | 97.7 | 0 | 0.0 |
| IDR 3,000 | 1 | 2.3 | 23 | 76.7 |
| IDR 4,000 | 0 | 0.0 | 5 | 16.7 |
| More than IDR 5,000 | 0 | 0.0 | 2 | 6.7 |
| Total | 43 | 100.0 | 30 | 100.0 |
| Progressive Tariff | MC Freq. | MC (%) | Car Freq. | Car (%) |
|---|---|---|---|---|
| IDR 1,000 | 42 | 97.7 | 23 | 76.7 |
| IDR 2,000 | 1 | 2.3 | 4 | 13.3 |
| IDR 3,000 | 0 | 0.0 | 3 | 10.0 |
| Total | 43 | 100.0 | 30 | 100.0 |
B.5 Summary of Statistical Findings
The statistical analysis reveals several key patterns:
The sample of 73 valid respondents (43 motorcycle users, 30 car users) shows balanced gender representation (49.3% male, 50.7% female) and is predominantly young adult (54.8% aged 17–25 years), consistent with the demographic profile of evening visitors to the Kayutangan Heritage Area during Ramadan.
The majority of respondents (58.9%) earn less than IDR 3,000,000 per month, reflecting a price-sensitive user base. This income profile directly influences the observed ATP–WTP gap and supports the need for moderate, value-aligned tariff schemes.
For motorcycle users, mean ATP (IDR 7,063) substantially exceeds mean WTP (IDR 2,023), a ratio of approximately 3.5:1. For car users, mean ATP (IDR 7,881) exceeds mean WTP (IDR 3,333), a ratio of approximately 2.4:1. This persistent gap across both vehicle categories confirms that perceived value—rather than financial capacity—is the primary constraint on tariff acceptance.
Motorcycle users show strong acceptance of progressive tariffs (76.7% agree), whereas car users show majority rejection (56.7% disagree). This differential acceptance suggests that pricing strategies should be vehicle-type-specific, with progressive structures more suitable for motorcycle parking and flat or hybrid structures more appropriate for car parking.
Approximately 95% of all respondents (97.7% motorcycle, 90.0% car) visit Kayutangan 1–5 times per month, indicating a predominantly occasional rather than regular user base. This visit pattern reflects the area's character as a recreational and culinary destination rather than a daily commuting hub.
The descriptive analysis presented here does not include inferential statistical tests (such as t-tests, ANOVA, or regression analysis) due to the exploratory nature of the study. Future research is recommended to incorporate econometric modeling and elasticity estimation to provide deeper insights into user payment behavior, as acknowledged in Section 4.2 of the manuscript.
References
- Antariksa, H. Santosa, J. Ernawati, and A.P. Yasmin, “The impact of community activity enlivening in shaping historical areas, case study: Kayutangan Heritage, Malang, Indonesia,” IOP Conf. Ser. Earth Environ. Sci., 1324 (1) (2024). doi:10.1088/1755-1315/1324/1/012057.
- I.D. Nurfitriya, and D.A. Iskandar, “The effect of urban tourism on an urban economy (the case of Malang municipality),” IOP Conf. Ser. Earth Environ. Sci., 561 (1) (2020). doi:10.1088/1755-1315/561/1/012011.
- M. Ni, Z. Sun, Y. Luo, Q. Yi, Y. Zhang, and Z. Wang, “Evaluation model of parking equipment planning and design based on object-oriented technology,” Appl. Sci., 11 (9) (2021). doi:10.3390/app11094263.
- F. Alanazi, “Electric vehicles: benefits, challenges, and potential solutions for widespread adaptation,” Appl. Sci., 13 (10) 2–23 (2023). doi:10.3390/app13106016.
- S. Demir, M. Basaraner, and A. Taskin Gumus, “Selection of suitable parking lot sites in megacities: a case study for four districts of Istanbul,” Land Use Policy, 111 (August) 105731 (2021). doi:10.1016/j.landusepol.2021.105731.
- K. E. Sari, Antariksa, Marjono, and K. Sukesi, “The Development of HUL (Historic Urban Landscape) Concept for Community-Based Conservation in Surabaya City,” Evergreen, 11 (2) 1125–1135 (2024). doi:10.5109/7183415.
- A.D. Wicaksono, D. Agustina, and V.Y.R. Ningtyas, “Sustainable urban mobility: level of people mobilization in Surabaya,” Evergreen, 11 (2) 1116–1124 (2024). doi:10.5109/7183413.
- F.R. Sutikno, R.N. Choiriyah, and Surjono, “Informality and public space policies –a study of Bandung City urban center,” Evergreen, 11 (2) 1050–1059 (2024). doi:10.5109/7183400.
- H. Manot, and J. Lienhard, “Potentials of reusing steel skeleton structures from multistorey parking units for architectural applications,” in: Ce/Papers Proceedings in civil engineering, 385–390 (2023). doi:10.1002/cepa.2373.
- Vadym Kutsevych, “Parking Places Built-Into The Lower Ground Floors Of Public Buildings And Structures. Architectural-Planning And Functional-Technological Requirements,” in: Natl. Acad. Fine Arts Archit. Ukr. Acad. Fine Art. Res. Methodol. Pap., 5-11 (2020). doi:10.33838/naoma.29.2020.5-11
- Faheem, S.A. Mahmud, G.M. Khan, M. Rahman, and H. Zafar, “A survey of intelligent car parking system,” J. Appl. Res. Technol., 11 (5) 714–726 (2013). doi:10.1016/S1665-6423(13)71580-3.
- D.S. Ellk, A.H. Mohsin, and S.A. Hasan, “Feasibility study for the establishment of a multi-story car park, a case study,” Open Civ. Eng. J., 14 (1) 179–187 (2020). doi:10.2174/1874149502014010179.
- J.A. Khan, A.M. Raman, N. Sambamoorthy, and K. Prashanth, “Research Methodology (Methods, Approaches and Techniques),” (2023). doi:10.59646/rmmethods/040.
- Tettamanti, T., & Varga, I. "Travel time reliability in transportation networks: A review of methodological developments". arXiv:2206.12696 [econ.GN] (2022). doi:10.48550/arXiv.2206.12696
- I.M. of Transportation, “Minister of Transportation Decree No. KM 66 of 1993 on parking facilities for public purpose,” Jakarta, 1993. https://ika-all.tripod.com/pdf/km66tahun1993.pdf (in Bahasa). (Accessed Sep. 1, 2024).
- C. Zhou, H. Petryshyn, R. Liubytskyi, and O. Kochan, “Optimization of on-street parking in the historical heritage part of Lviv (Ukraine) as a prerequisite for designing the IoT smart parking system,” Buildings, 12 (6) (2022). doi:10.3390/buildings12060865.
- Tišma, S., MM Škrti ́c, S. Malekovi ́c, and DA Jelinˇci ́c. “Cost–Benefit Analysis in the Evaluation of Cultural Heritage Project Funding”. Journal of Risk and Financial Management 14(10) 466, (2021). doi:10.3390/jrfm14100466.
- S.A. Hussein, and M.D. Al-Taee, “The management of heritage buildings in historical urban areas according to cost-benefit methods,” IOP Conf. Ser.. Earth Environ. Sci., 779 (1) (2021). doi:10.1088/1755-1315/779/1/012045.
- R.C. Jou, Y.C. Lin, and D. Hensher, “Parking preferences of tourists in Sun Moon Lake Scenic Area,” Case Study Transp. Policy, 17 (June) 101249 (2024). doi:10.1016/j.cstp.2024.101249.
- I. Nuraini, E.J.P. Government, and BPS, “Analysis of macro indicators East Java 2008–2010. Book I: Analysis of social and economic macro indicators for 2008–2010,” 2007. https://jatim.bps.go.id/id/publication/2011/12/20/d81215add534b2779573ac52 (In Bahasa), (Accessed Sep. 1, 2024).
- J.P. Gittinger, “Economic analysis of agricultural projects,” Johns Hopkins University Press, Baltimore, 1982. doi:10.2307/2618842
- Sunhaji, M., A. Wicaksono, and A.D. Wicaksono, “Determination of tourist bus fares in Batu City based on ability to pay, willingness to pay, and vehicle operating cost,” Rekayasa Sipil Journal no 19 (01) (2025). (In Bahasa) doi:10.21776/ub.rekayasasipil.2025.019.01.2.
- A.N. Abbood, A.R.I. Ahmed, and H.K.K. Ajam, “Evaluation of parking demand and future requirement in the urban area,” Civ. Eng. J., 7 (11) 1898–1908 (2021). doi:10.28991/cej-2021-03091767.
- I. Betkier, and E. Macioszek, “Characteristics of parking lots located along main roads in terms of cargo truck requirements: a case study of Poland,” Sustain., 14 (23) 1–21 (2022). doi:10.3390/su142315720.
- B. Assemi, D. Baker, and A. Paz, “Searching for on-street parking: an empirical investigation of the factors influencing cruise time,” Transp. Policy, 97 (July) 186–196 (2020). doi:10.1016/j.tranpol.2020.07.020.
- X. Li, B. Xie, X. Wang, G. Li, and Z. Yao, “Parking choice behavior of urban village residents considering parking risk: an integrated modeling approach,” Case Study Transp. Policy, 15 (July 2023) 101145 (2024). doi:10.1016/j.cstp.2023.101145.
- H. Herdiansyah, Sugiyanto, A.G. Octavianto, E.G. Aritonang, M.N. Imaduddin, Dedi, and M. Rilaningrum, “Capacity analysis of parking lot and volume of vehicle toward sustainable parking convenience,” IOP Conf. Ser. Earth Environ. Sci., 88 (1) 0–6 (2017). doi:10.1088/1755-1315/88/1/012031.
- N. Ketut, S.A. Sukawati, G. Agung, and G. Suryadarmawan, “Parking land evaluation and planning at the Kereneng market, Denpasar City,” Int. J. Appl. Sci. Sustain. Dev., 4 (1) 39–48(2022). https://e-journal.unmas.ac.id/index.php/IJASSD/article/view/3765/2881. (Accessed Sep. 1, 2024).
- M. Hashan, “Parking volume study of strategically important locations in Khulna City, Bangladesh,” Int. J. Innov. Sci. Res. Technol., 8 (6) 1780–1789 (2023). doi:10.5281/zenodo.8123098
- T. Litman, “Comprehensive parking supply, cost and price analysis,” Transp. Res. Procedia, 82 (July 2023) 1700–1716 (2025). doi:10.1016/j.trpro.2024.12.150.
- R. Magdalena, “Financial performance analysis of location, rental rate, and parking revenue on shopping centers,” J. Account. Bus. Educ., 1 (2) 230 (2017). doi:10.26675/jabe.v1i2.8490.
- J. Parmar, P. Das, and S.M. Dave, “Study on demand and characteristics of parking system in urban areas: a review,” J. Traffic Transp. Eng. (English Ed.), 7 (1) 111–124 (2020). doi:10.1016/j.jtte.2019.09.003.
- T. Litman, “Parking evaluation,” VTPI (Victoria Transp. Policy Institute), (2017). https://vtpi.org/tdm/tdm73.htm (Accessed April 27, 2025).
- M.T.H. Nugraha, and M. Sibarani, “Investment feasibility study with the capital budgeting method for the construction project of facilities for overnight parking services at Apt Pranoto Airport in Samarinda City, East Kalimantan,” American Journal of Economic and Management Business (AJEMB) 3 (12) 436–446 (2024). doi:10.58631/ajemb.v3i12.140
- F. Akbar Gumilang, S. Adi Saputra, Z. Zulkifli, S. Novriani, and H. Hermawan, “Analysis of off-street parking capacity at Cirebon Super Block, Cirebon City,” J. World Sci., 3 (7) 838–848 (2024). doi:10.58344/jws.v3i7.666.
- I.W. Agustin, I.R. Dwi Ari, B.S. Waloejo, S. Hariyani, and S. Irawati, “How much parking space is needed for park and ride facilities to support sustainable infrastructure,” J. Socioecon. Dev., 6 (1) 59 (2023). doi:10.31328/jsed.v6i1.4146.
- D.L. Boardman, Anthony E.; Greenberg, David H.; Vining, Aidan R.; Weimer, “Cost–Benefit Analysis: Concepts and Practice,” 5th ed., Cambridge University Press, Cambridge, United Kingdom, 2018. doi:10.4324/9781315387420-4.
- R. Safitri, R. Amelia, and J.D.N. Manik, “The effectiveness of on-street parking fees in Pangkalpinang city,” Adv. Soc. Sci. Educ. Humanit. Res., 436 523–525 (2020). doi:10.2991/assehr.k.200529.109.
- B.S. Waloejo, I.W. Agustin, S. Hariyani, D.F. Al Himah, and D.F. Al Khariri, “The effect of land use on the road’s level of service at Sultan Agung Road, Malang Regency,” Evergreen, 11 (2) 1136–1147 (2024). doi:10.5109/7183416.
- D.S. Gunanto, “Risk of returning deposit investment results,” Int. J. Econ. Bus. Account. Res., 3 (02) 2014–2017 (2019). doi:10.29040/ijebar.v3i02.623.
- I.W. Agustin, I.R. Dwi Ari, S. Irawati, and E. Siankwilimba, “Strategy for implementing park-and-ride as a supporting facility for commuter movement,” Evergreen, 11 (2) 1068–1080 (2024). doi:10.5109/7183406.
- J. Huang, “Comparison between NPV and IRR: evaluation of investment,” BCP Bus. Manag., 40 149–154 (2023). doi:10.54691/bcpbm.v40i.4373.
- C.J. Gabbe and G. Pierce, “Hidden costs and deadweight losses: bundled parking and residential rents in the metropolitan United States,” Hous. Policy Debate, 27 (2) 217–229 (2017). doi:10.1080/10511482.2016.1205647.
- J. Li, S. Wu, and X. Feng, “Optimization of on-street parking charges based on price elasticity of the expected perceived parking cost,” Sustain., 13 (10) (2021). doi:10.3390/su13105735.
- L. Shan, and S. Qian, “The price mechanism analysis of parking fees on economic perspective,” Int. J. Bus. Adm., 6 (2) 118–123 (2015). doi:10.5430/ijba.v6n2p118.
- Respondent's Name (optional): _______________________________
- Address: _______________________________
- Gender
- Age
- Highest Educational Attainment
- Occupation
- Monthly Income
- Purpose of Visit to Kayutangan
- Monthly Transportation Expenditure
- Monthly Parking Expenditure
- Frequency of Visits to Kayutangan in One Month
- Average Parking Duration per Visit
- Do you agree with implementing a time-based (progressive) parking tariff?
- Preferred Parking Fee for the First Hour
- Preferred Progressive Parking Fee (per additional hour)
- Do you agree with implementing a time-based (progressive) parking tariff?
- Preferred Parking Fee for the First Hour
- Preferred Progressive Parking Fee (per additional hour)
- Sample Composition:
- Income Distribution:
- ATP–WTP Gap:
- Progressive Tariff Acceptance:
- Visit Frequency:
- Methodological Limitations: