
Abstract
This study presents a systematic, modular prompt-construction framework for using Artificial Intelligence (AI) to assist simulation modelers in public transportation systems, leveraging large language models (LLMs). By using GPT-4o and Codex, we demonstrate how discrete-event simulation (DES) executable models can be rapidly generated with our five-part prompt construction framework, requiring minimal manual coding effort. The proposed framework was tested using a real-world case study of the in-campus shuttle bus transportation system at Universitas Indonesia. The empirical data from the case study served as the foundation for constructing a simulation model that can replicate a real-world situation. This data was provided to the AI via our modular prompt-construction framework, which was then used to generate the Python code for the simulation model. The generated model results were validated based on field observation data. The generated model yielded a Mean Absolute Percentage Error (MAPE) of 5.18%. These results indicate that LLM-assisted development of simulation models using our proposed framework can produce reliable simulation code that aligns with real-world public transportation behavior. The framework's applicability could provide a replicable, scalable method for rapid simulation development in public transportation planning and smart mobility contexts.
Keywords: AI-assisted discrete-event simulation, AI-assisted simulation modeling, Human-AI simulation modeling, Large language models (LLM), Public transportation modeling
Outline
1. Introduction
Maintaining efficient public transportation systems without compromising passenger satisfaction is increasingly essential as urban populations grow and mobility demands become more intensive1–3). However, overly efficient public transportation systems may suffer from insufficient capacity and overcrowding4,5). This situation can lead to diminished user satisfaction and a potential shift toward private vehicle use. On the other hand, oversupplying transport services may enhance passenger comfort but entail substantial operational costs6,7). Therefore, designing an optimized public transport system requires balancing service quality and resource efficiency8,9). This design process is inherently complex because it involves many interrelated components, such as passenger arrival variability, fleet capacity, and scheduling. Simulation models that accurately reflect real-world behaviors are necessary to help stakeholders design, analyze, and improve such systems10–12). This simulation model can help stakeholders understand the system and enable transport planners to experiment with scenarios, test interventions, and make data-informed design decisions11,13,14).
A traditional approach to simulation modeling, particularly discrete-event simulation (DES), is often used to study such transportation systems11,15,16). DES is a modeling technique that describes a system as a sequence of events occurring at separate points in time (e.g., bus arrivals, passenger boarding, or departures from a terminal)17,18). DES can analyze micro-level queueing behavior and time-dependent performance in public transportation operations, making it more suitable than other system modeling methods15,19–22). However, DES requires significant proficiency in proprietary software and a substantial time investment in model development17,23,24). These barriers frequently limit system modelers and practitioners who are non-programmers and do not have access to licensed DES software25–30), which is typically very expensive, but who wish to use open-source programming languages to develop their models31,32). To overcome such obstacles, using AI or LLMs to assist modelers in designing and analyzing complex simulation models may be beneficial33–35).
The current development of Artificial Intelligence, particularly large language models (LLMs) such as OpenAI's GPT-4o and Codex, fosters new ideas and paradigms for developing discrete-event simulation models36–38). The ability of LLMs to translate structured natural language prompts into executable code enables the construction of simulation models to be faster, more intuitive, and accessible to modelers with limited programming skills39,40). Existing literature has attempted to integrate LLMs in computer simulations to analyze big data, including data mining, machine learning, data farming, visual analytics, and process mining41). Although initial experiments reveal that popular LLMs, such as ChatGPT, are incapable of producing concise or executable models42), structured prompt engineering approaches have emerged as a mechanism for improving the reliability and consistency of LLM-based code generation outputs in generating executable codes of real-world or empirical computer simulation models38,43).
Despite these developments, limited research has investigated how structured prompt engineering in LLMs can be integrated into the DES model development workflow while maintaining reliability and consistency in generating a valid real-world DES simulation model. In addition, there is limited research on how AI (particularly using LLMs) can be applied to assist or generate valid DES models for public transport systems in real-world settings. Moreover, integrating empirical data, conceptual modeling, and iterative validation through the combination of observed data collected from humans and AI-generated simulation models remains underexplored in the context of public transport systems.
This study aims to address this gap by adapting and proposing a systematic, modular prompt-construction framework and demonstrating the use of GPT-based LLMs to support the development of DES simulation models for public transportation systems. The real-world case study used for demonstration in this study is the public shuttle system at Universitas Indonesia in Depok City. Empirical data from the real-world system, including the number of shelters, passenger arrival patterns, bus capacity, and departure scheduling intervals obtained from field observations, were used to create a conceptual model. From this conceptual model, the modeler formulated prompts in natural language to be input into GPT-4o/Codex to generate an executable simulation model. The results of the simulation model executed by the LLM are then compared with empirical field observation results to evaluate its validity.
This study has three main contributions. First, it adapts and extends existing prompt-engineering frameworks for discrete-event simulation development in public transportation, a domain that has received limited attention in the emerging literature on LLM-assisted simulation modeling. Second, it proposes a systematic, modular prompt-construction protocol to provide a structured, reproducible workflow for transforming a conceptual model into executable simulation code. Third, it offers insights into the practical use of an LLM-assisted framework for developing discrete-event simulation in public transportation, highlighting both its potential and its limitations.
2. Proposed Framework Design
This study proposes a structured framework that integrates system analysis, conceptual modeling, and LLM-assisted code generation to rapidly develop discrete-event simulation (DES) models of transportation systems. The proposed framework, as shown in Figure 1, is an extension of the work of Jackson et al.33) and follows established practices in generic simulation model development17). The main contribution of the framework in this study is a structured, modular prompt-construction technique to guide simulation model development. Rather than relying on unstructured natural language instructions, the framework proposed in this study introduces a modular prompt construction protocol consisting of five components in the prompt construction phase, following a suggestion by Maaz et al.44) and Kleiman et al.35): task definition, system context, model parameters, conceptual model representation, and output formatting instructions. The proposed framework is divided into four main stages, with the main contribution in the prompt construction stage. A brief explanation of each stage in the proposed framework is provided below.
2.1. System analysis (a)
The modeling begins with a detailed analysis of a real-world public transportation system. This stage involves defining the system entities, interrelationships, boundaries, and assumptions. Some important real-world variables to consider include the number of fleets in operation, fleet capacity, available route options, passenger arrival distribution, distance between shelters, and boarding/alighting passenger time6,45). In this system analysis stage, data is collected through field observations and discussions with experts/stakeholders to ensure that the modeler's understanding of the system being modeled reflects operational realities.
After collecting empirical data, the next step is to translate
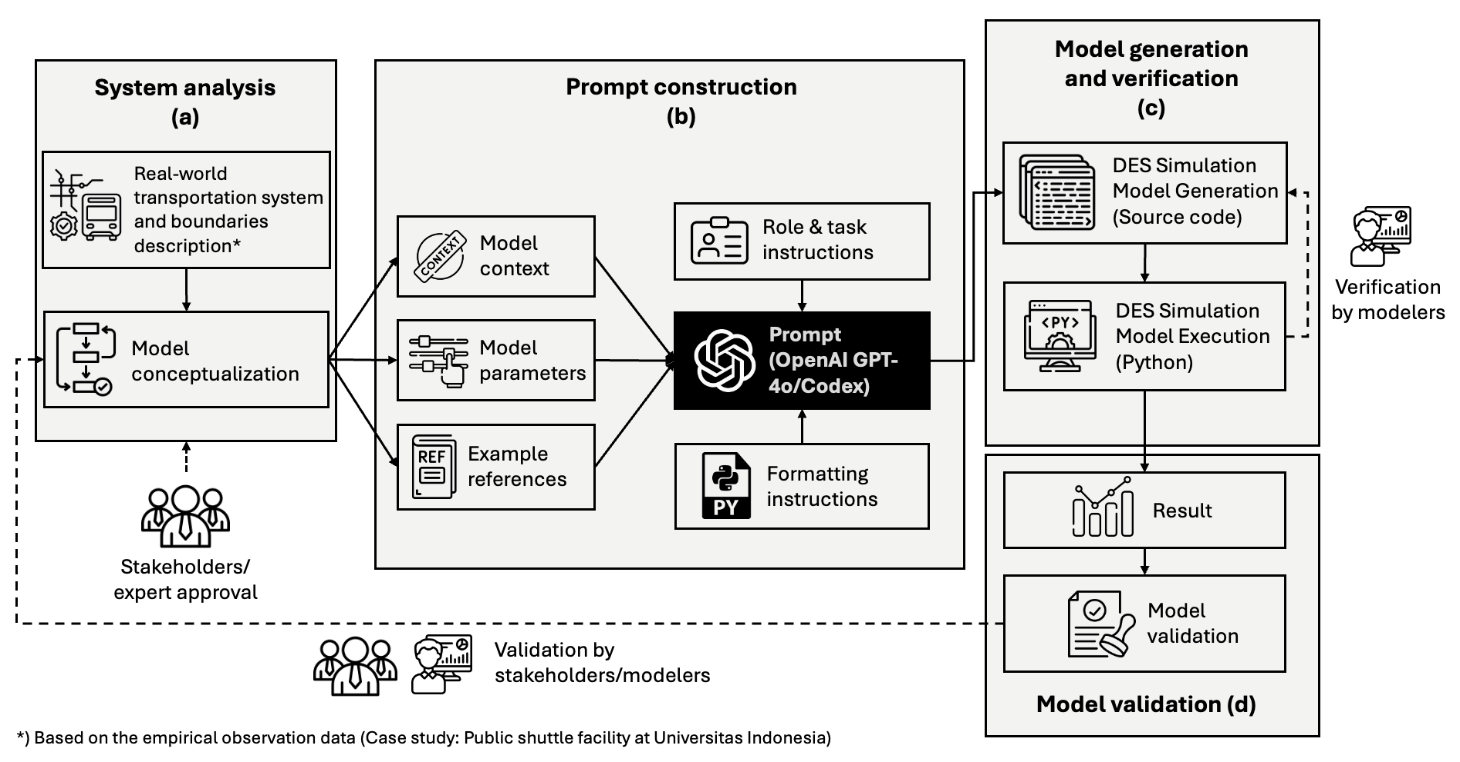
the description into a conceptual model, a process known as conceptualization. This conceptual model defines how the system should behave in terms of logic and structure. As recommended in the conceptual modeling framework for simulation models46,47), this phase includes identifying model inputs, processes, outputs, and decision rules. The conceptual model in this framework serves as a bridge between the problem space and the simulation model, providing a structured basis for AI/LLM input through prompt engineering techniques.
2.2. Prompt construction (b)
In this stage, the conceptual model is translated into a structured, modular prompt that the LLM can use to generate executable simulation code. This framework proposes five key components for incorporating prompts into the LLM as the primary contribution to this study:
•Model Context: Describes the real-world system (e.g, transportation system setting).
•Role and Task Instructions: Assign the LLM a role (e.g., “You are a simulation modeler expert who has experienced more than 30 years”) and a goal (e.g., “Create a Python simulation using SimPy”).
•Model Parameters: Empirical data (e.g., arrival distributions, interarrival times, and capacity constraints) are used as the model’s key parameters.
•Formatting Instructions: Specifies simulation model source code output preferences such as format, indentation, modularity, and naming conventions.
•Example References: Includes previously validated prompt patterns or working examples to guide the source code generation.
These five components are concatenated to form a complete instruction (prompt) to the OpenAI GPT-4o/Codex user interface. In this study, OpenAI GPT-4o/Codex acts as a simulation model co-designer/co-developer in rapid simulation model development.
2.3. Model generation and verification (c)
The LLM interprets the structured prompt and returns executable Python code representing a discrete-event simulation model built with SimPy. For the context of a public transportation system, the generated code at least includes modules for representing:
•Entity arrival (vehicle generation and passenger generation per shelter),
•Vehicle dispatch and capacity logic,
•Queuing mechanism or waiting times at each stop,
•Time-based simulation scheduling.
The model generated by LLM is then executed and verified by human modelers for syntactic correctness. This verification is necessary because there may be differences between the Python version generated by LLM and the one installed on the execution system owned by modelers. Verification ensures the model can run without syntax errors and produce outputs as Banks48,49) and Robinson46,47)described.
2.4. Model validation (d)
Once the simulation model can be executed, the simulation output (e.g., passenger waiting time) is compared with empirical field data to validate the model. One technique is Mean Absolute Percentage Error (MAPE). MAPE is a commonly used statistical measure for evaluating the accuracy of predictive models by comparing their output with actual observed data.
Mathematically, MAPE is defined as:
Where:
At = Actual observed value at time or location t
Ft = Simulated value at t
n = Total number of data points
The formula above calculates the absolute difference between the observed and simulated values. The difference obtained is then divided by the observed value to get the percentage error. This percentage error is then averaged across all data points. The higher the MAPE value, the further the model output is from the observed value. If significant discrepancies are observed, modelers or stakeholders may refine input assumptions or prompt components to enhance model accuracy in subsequent iterations.
3. Framework application: a case of shuttle service at Universitas Indonesia (UI)
This section will demonstrate in more detail the results of applying the proposed framework to a real-world case study in the context of public transportation. This study defines public transport as transportation for the public that operates on fixed routes, with fares and schedules50). A real-world case study was conducted using data from the Free Shuttle Service at the Universitas Indonesia (UI) Depok Campus to test the proposed framework. Universitas Indonesia offers a free intra-campus shuttle service that transports students and staff to various faculties. The main reason for selecting this case study is that its transportation system represents the complexity of public transportation in general, but on a smaller scale, making it suitable for testing the framework. Additionally, empirical data from field observations are relatively more straightforward to obtain.
3.1. Demonstration of system analysis (a)
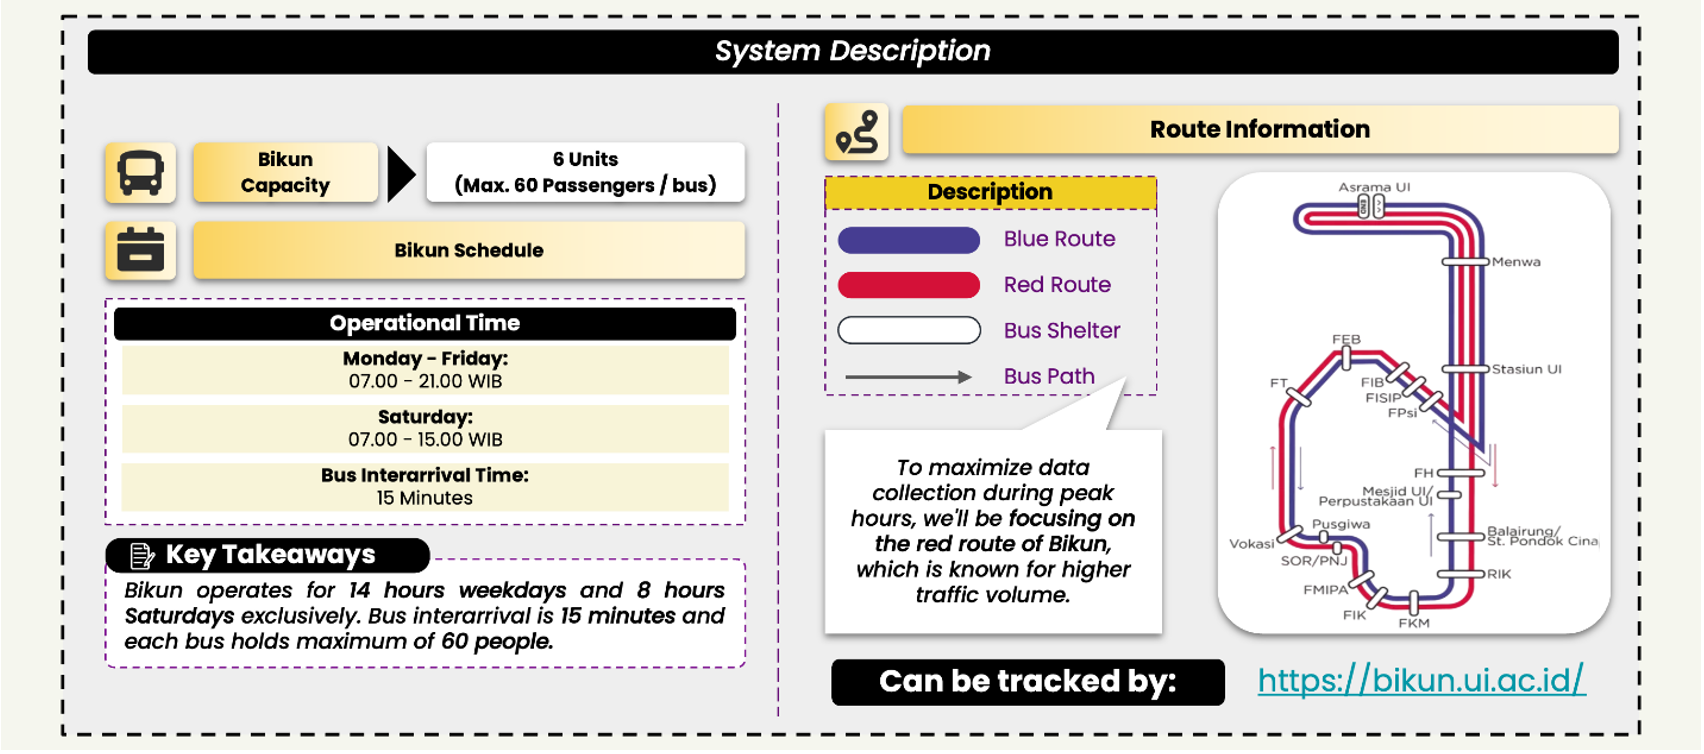
The first stage of this study involved a comprehensive systems analysis of the Free Shuttle Service System as a free public transportation facility on campus. The UI academic community also knows this transportation system as the Yellow Bus (Bis Kuning/Bikun). The system analysis was conducted through direct observation, stakeholder interviews, and secondary data from the Bikun Tracking Portal (https://bikun.ui.ac.id). The description of the Free Shuttle Service system at Universitas Indonesia is illustrated in Figure 2. This service has operated since 1998 and runs from Monday to Saturday, starting at 7:00 AM. Based on field observations, the shuttle system frequently experiences delays and passenger congestion, particularly during peak morning hours at high-demand stops such as UI Dormitory, UI Station, and the Faculty of Engineering. In the long term, these issues could undermine the reliability of the shuttle service and encourage passengers to switch to private transportation, thereby contributing to traffic congestion and carbon emissions on campus.
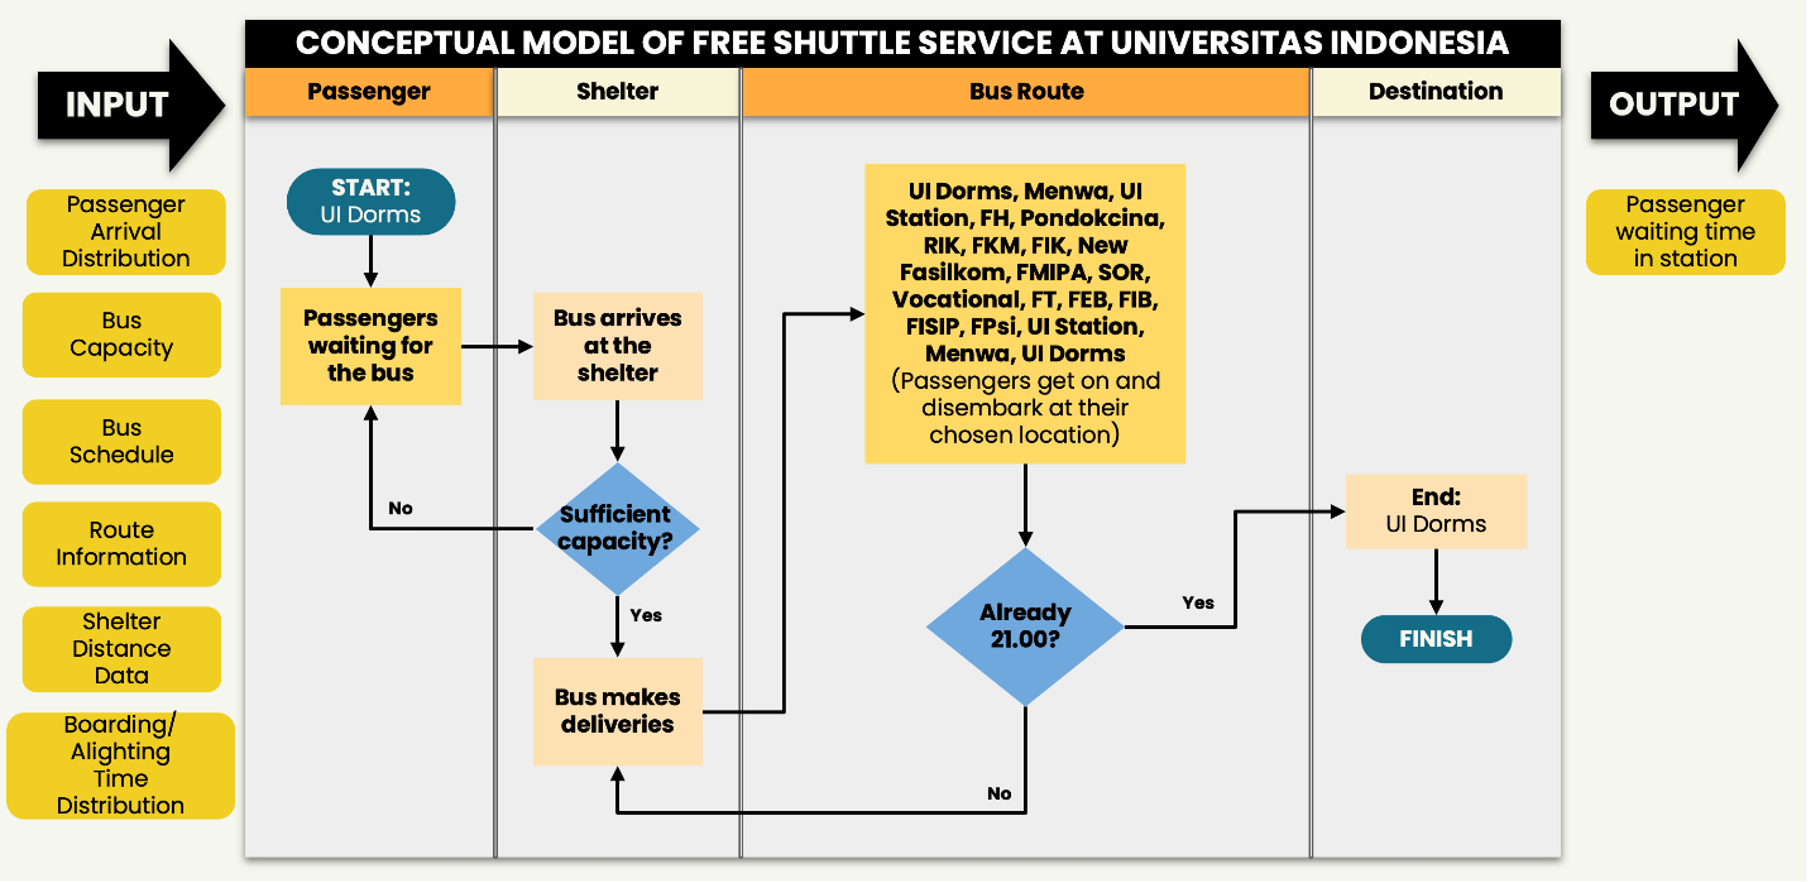
The observational data were then translated into a conceptual model, as illustrated in Figure 3. The conceptual model describes the empirical data used as input parameters in the model. The process section explains the shuttle service’s operational scheme using a flowchart from start to end of operating hours. The output to be measured is the average waiting time of passengers at each bus stop, considered the most critical indicator from the passengers' perspective (mostly UI students). To simplify the implementation of the framework, the base configuration of the system modeled in this study is limited to the red line route (red line) during the morning peak hours (07:00–09:00 WIB).
3.2. Demonstration of prompt construction (b)
This section demonstrates the prompts used to generate a Python-based DES simulation model. The prompts in this section are divided into modular components according to the proposed framework and consist of five main parts, each with the following demonstrations.
Prompt Part 1: Role & Task Instructions
“You are a discrete-event simulation (DES) expert who writes Python code using the SimPy library. Your task is to generate a simulation model of a campus shuttle service operating along a fixed route with multiple bus stops. The simulation must account for passenger arrivals at each shelter, bus capacity constraints, passenger boarding and alighting processes, and shuttle operating schedules. Generate clean, modular Python code with clear function definitions, appropriate use of SimPy processes and resources, and comprehensive data logging to track passenger waiting times at each shelter. The code should be sufficiently structured to support model validation, replication, and future scenario analysis.”
Prompt Part 2: Model Description and Context
“The system to be modeled represents the free campus shuttle bus service (Bikun) operated by Universitas Indonesia along the Red Route. The shuttle operates on a circular one-direction route, departing from the UI Dorms shelter and visiting all designated campus shelters in sequence before returning to the origin. The simulation represents morning peak-hour operations between 07:00 and 09:00 WIB. Passenger arrivals occur continuously at each shelter according to empirically derived shelter-specific triangular probability distributions. Each shuttle vehicle has a maximum capacity of 60 passengers and follows a fixed dispatching schedule with constant headways. The model is intended to capture passenger movements, shelter queues, boarding and alighting processes, and vehicle occupancy dynamics. The primary objective of the simulation is to estimate and evaluate average passenger waiting times at each shelter.”
Prompt Part 3: Model Parameters
“Define the following model parameters and operational assumptions:
a)Create a bus entity with a maximum capacity of 60 passengers.
b)Generate passenger arrivals at each shelter using empirically derived triangular probability distributions with shelter-specific minimum, most likely, and maximum passenger per 20 minutes. Example arrival distributions include:
•"UI Dorms": (6, 9, 12),
•"Menwa": (11, 13, 15),
•"UI Station": (20, 28, 30),
•"FH": (4, 11, 18), "Pondokcina": (10, 12, 20), "RIK": (7, 15, 22),
•"FKM": (4, 6, 8), "FIK": (4, 6, 8),
•"New Fasilkom": (5, 9, 10),
•"FMIPA": (5, 9, 10),
•"SOR": (5, 7, 9),
•"Vocational": (5, 6, 18),
•"FT": (6, 7, 8),
•"FEB": (5, 7, 8),
•"FIB": (1, 3, 6),
•"FISIP": (3, 7, 8),
•"FPsi": (4, 6, 8),
c)Define the shuttle route in the following sequence:
UI Dorms > Menwa > UI Station > Faculty of Law (FH) > Pondokcina > RIK > Faculty of Public Health (FKM) > Faculty of Nursing (FIK) > New Fasilkom >
Faculty of Mathematics and Natural Sciences (FMIPA) > Sports Center (SOR) > Vocational School > Faculty of Engineering (FT) > Faculty of Economics and Business (FEB) > Faculty of Humanities (FIB) > Faculty of Social and Political Sciences (FISIP) > Faculty of Psychology (FPsi) > UI Station > Menwa > UI Dorms
d)Dispatch buses from the origin shelter using a fixed headway of 15 minutes.
e)Implement passenger boarding and alighting processes at each shelter. Alighting passengers should be determined using shelter-specific destination demand patterns, while boarding passengers should be constrained by the remaining vehicle capacity and follow a First-In-First-Out (FIFO) queue discipline.
f)Treat repeated visits to UI Station and Menwa as separate shelter instances to avoid queue interference between outbound and return-route operations.
g)Set the simulation duration to 120 minutes, representing operations from 07:00 to 09:00 WIB.
h)Organize all parameters in dedicated configuration structures to facilitate model validation, replication, and future scenario experimentation.
Prompt Part 4: Formatting Instructions
“Structure the generated code using the following components:
a)Parameter initialization section containing all model inputs, including bus capacity, shelter definitions, route sequence, dispatch interval, travel times, and passenger arrival distributions.
b)Passenger generation module that creates passengers independently at each shelter according to the specified triangular probability distributions.
c)Bus operation module that controls vehicle dispatching, movement between shelters, passenger alighting, passenger boarding, vehicle occupancy updates, and capacity enforcement.
d)SimPy environment setup and simulation scheduler responsible for executing the complete 120-minute simulation.
e)Data collection and logging module that records:
1)Passenger waiting times at each shelter.
2)Average waiting time per shelter.
3)Overall average waiting time across the system.
4)Total number of passengers served during the simulation.
f)Results reporting section that summarizes simulation outputs in a clear and interpretable format.
g)Ensure the code follows good software-engineering practices, including:
1)Clear function definitions and modular design.
2)Consistent variable naming conventions.
3)Appropriate inline comments and documentation.
4)Proper indentation and readability.
5)Separation between model parameters, simulation logic, and output analysis.
h)Use NumPy for random number generation and statistical calculations. Use Matplotlib to generate plots of key performance indicators when appropriate. The generated code should be sufficiently organized to support model validation, replication experiments, and future scenario analysis.”
Prompt Part 5: Output Example References
“The simulation should return the following outputs:
a)Average passenger waiting time for each shelter along the route.
b)Overall average passenger waiting time across the entire shuttle system.
c)Total number of passengers served during the simulation period.
d)A graphical visualization showing shelter-level passenger waiting-time performance to facilitate comparison among shelters.
Implementation requirements:
a)Represent bus seating availability using an appropriate SimPy mechanism, such as SimPy.Resource, SimPy.Container, or an equivalent capacity-management approach that accurately enforces the 60-passenger vehicle limit.
b)Record passenger waiting times at the individual-passenger level and aggregate the results by shelter.
c)Generate output structures that can be directly used for model validation and subsequent scenario-analysis experiments.
d)Include exception-handling procedures to prevent simulation failure caused by indexing errors, empty queues, invalid shelter references, or capacity-allocation issues.
e)Ensure that all output metrics are reported automatically at the end of the simulation run.
The generated outputs should be suitable for statistical analysis, model validation, and visualization of passenger service performance.”
To improve transparency and reproducibility, the prompt construction process was documented throughout model development. Rather than relying on a single prompt submission, this study used an iterative prompting process to produce the simulation model. The initial prompt produced a functional SimPy-based discrete event simulation model but contained minor implementation issues. The issues include syntax inconsistencies and incomplete implementation of certain operational rules, as per the intended simulation logic. Subsequent prompt iterations refined the final model by correcting the logic for inter-shelter travel times, bus capacity constraints, and other operational rules, ensuring consistency with the system specifications defined during the conceptual modeling stage.
A total of three prompt iterations were performed for each part before obtaining the final executable model. The complete prompt history, including all intermediate prompts and corresponding model outputs, is provided in supplementary information to facilitate replication of the development process.
3.3. Demonstration of model generation and verification (c)
After the prompt has been structured and refined, the next step is to enter it into the LLM to generate SimPy Python code to simulate this transportation system. The executable code was generated after three iterations to ensure no syntax errors. The pseudocode is shown below. The generated code was reviewed by the authors to ensure syntactic correctness and successful execution within the Python environment. The full source code is available in the supplementary information.
The major authors’ role in this phase was to conduct model verification. Verification activities included checking Python syntax compatibility, confirming successful package imports, resolving runtime errors, and ensuring that simulation outputs could be generated correctly. There are no substantive modifications to the simulation logic and operational parameters. These components remained consistent with the code generated by the LLM. Consequently, the final code generated to represent the simulation logic reported in this study should be regarded as LLM-generated, while the authors served as domain experts responsible for model verification to ensure successful execution.
Pseudocode generated by LLMs based on the structured prompt entered
Input:
Route shelters S = {s1, s2, ..., sn}
Simulation duration T
Bus capacity C
Dispatch headway H
Passenger arrival interval I
Boarding time per passenger tb
Alighting time per passenger ta
Shelter-specific triangular arrival parameters (min, mode, max)
Shelter-specific travel times
Shelter-specific alighting probabilities
Output:
Passenger waiting time per shelter
Number of passengers served per shelter
Remaining queue per shelter
System-level performance indicators
1. Initialize simulation clock t = 0
2. Initialize FIFO queue Qs for each shelter s in S
3. Initialize data collectors for:
passenger arrivals,
passenger waiting times,
bus operations,
bus occupancy
4. For each shelter s in S:
Start PassengerArrivalProcess(s)
5. Start BusDispatchProcess()
6. Run simulation until t = T
Procedure PassengerArrivalProcess(s):
while t < T do
Draw demand ds from Triangular(mins, modes, maxs)
Compute mean interarrival time:
μs = I / ds
Draw passenger interarrival time Δt from Exponential(μs)
Advance simulation clock by Δt
if t ≤ T then
Create new passenger p with arrival time t
Add p to FIFO queue Qs
Record passenger arrival at shelter s
end if
end while
Procedure BusDispatchProcess():
bus_id = 0
while t < T do
bus_id = bus_id + 1
Create new bus b with capacity C
Start BusRouteProcess(b)
Wait H minutes before dispatching next bus
end while
Procedure BusRouteProcess(b):
Set current shelter index i = 1
while t < T do
s = S[i]
Call AlightingProcess(b, s)
Call BoardingProcess(b, s)
Record bus operation at shelter s:
number boarded,
number alighted,
onboard passengers,
remaining queue
Record bus occupancy after serving shelter s
Travel to next shelter:
Wait travel_time(s)
Move to next shelter:
i = i + 1
if i > n then
i = 1
end if
end while
Procedure AlightingProcess(b, s):
if onboard passengers > 0 then
Draw number of alighting passengers a from:
Binomial(onboard passengers, alighting_probability(s))
Remove a passengers from bus b
Wait a × ta minutes
end if
Procedure BoardingProcess(b, s):
boarded = 0
while Qs is not empty and onboard passengers < C do
Remove first passenger p from Qs
Compute waiting time:
wp = current time - arrival_time(p)
Record wp for shelter s
Add passenger p to bus b
boarded = boarded + 1
end while
Wait boarded × tb minutes
7. After simulation ends:
For each shelter s:
Compute average waiting time
Count passengers served
Count remaining queue length
8. Compute system-level indicators:
Total passengers served
Overall average waiting time
Total remaining queue
Simulation duration
Bus capacity
Dispatch headway
9. Return shelter-level and system-level results
The final source code of the DES model generated in this phase can simulate the operational dynamics of the campus shuttle bus system over a 120-minute simulation period using the conceptual simulation logic described in Figure 3. The 120-minute run is the base configuration of the model. For steady-state analysis, the simulation horizon was extended to 240 minutes, the first 60 minutes were removed as warm-up, and reported values were averaged over 100 replications. The 240-minute horizon is used specifically for validation and scenario analysis. The generated code of this final DES model follows the simulation logic below.
First, passenger arrivals at each shelter are generated continuously throughout the simulation period using empirical shelter-specific triangular probability distributions. The minimum, most likely, and maximum values of arrival rates are defined according to empirical observations and simulated by this model. Bus scheduling is simulated using a fixed dispatching policy. This model simulates buses departing from the origin shelter (UI dorms) at regular 15-minute headways and following a predefined circular route that serves all designated shelters. The route structure and bus stop sequence are embedded within the simulation parameters.
Second, when a bus arrives at a shelter, passengers alight according to shelter-specific destination demand patterns. The number of alighting passengers is estimated in proportion to the distribution of students across the faculties served by each shelter. Following the alighting process, waiting passengers may board the bus, subject to remaining capacity, with each bus limited to 60 passengers. If the number of passengers waiting exceeds the available capacity, only the allowable number of passengers can board the bus under the First-In-First-Out (FIFO) rule, while the remaining passengers continue waiting for the next bus. Travel between consecutive shelters is modeled using fixed inter-shelter travel times. This alighting-boarding sequence is repeated at each shelter along the route. The route includes shelters that are visited more than once during complete circulation, specifically UI Station and Menwa shelter. To accurately represent passenger queues, this model treats each visit as a separate shelter instance corresponding to its outbound and return-route positions. This logic prevents interference between queues at the two route segments that share a shelter and ensures an accurate representation of passenger flow.
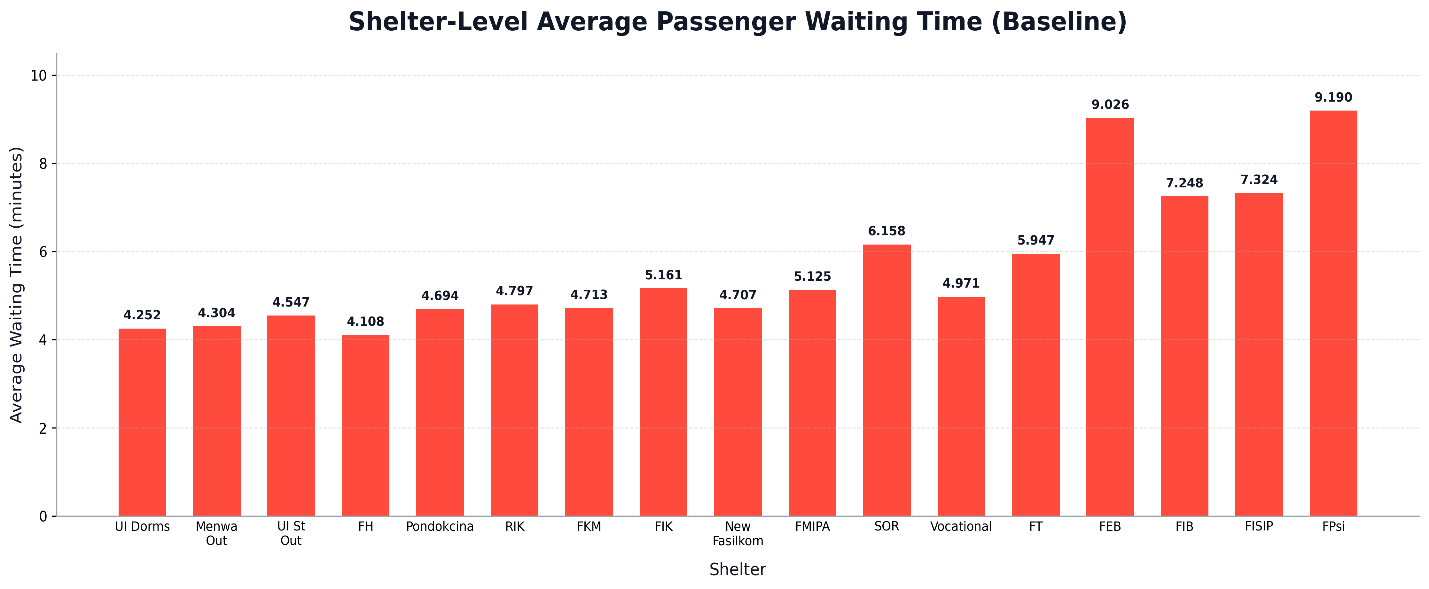
Lastly, the simulation records key performance indicators for the system, namely passenger waiting times per shelter/station. These output indicators are subsequently used for model validation and system performance assessment in scenario analysis. The time required to generate the code for each iteration is approximately 20-40 seconds. After the final code is generated, it is then executed. The results are shown in Figure 4.
3.4. Demonstration of model validation (d)
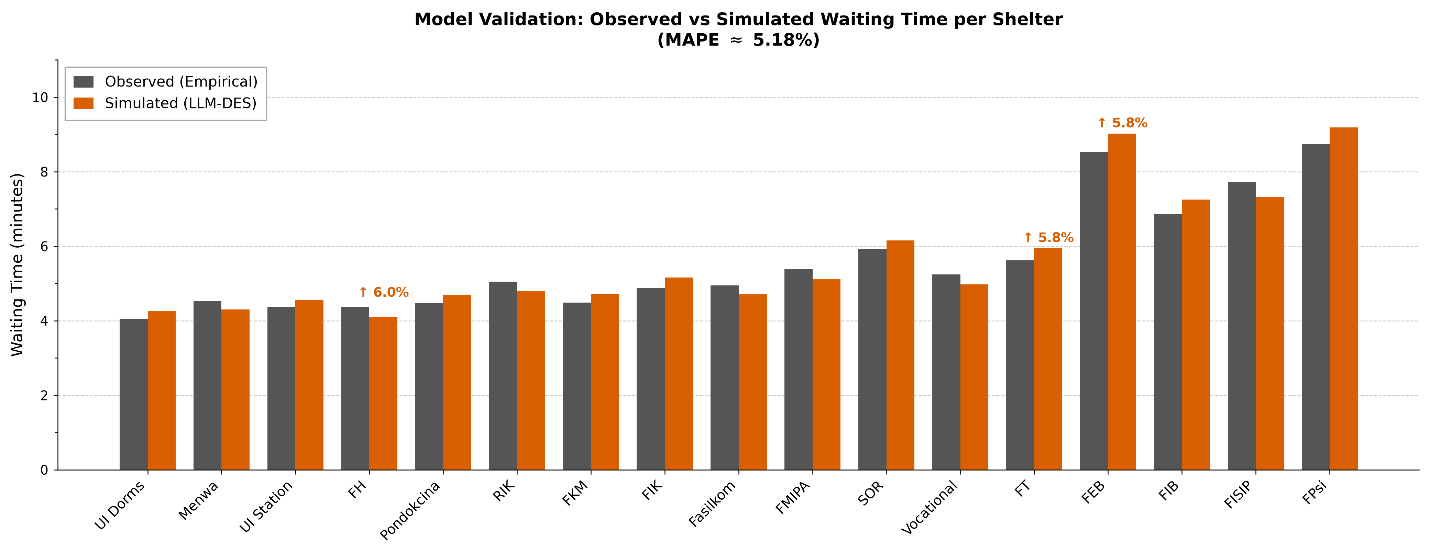
The model validation stage was conducted by comparing the model's output with empirical data from observations. The data compared were the average passenger waiting times at shelters. The differences between the real data and the model output were calculated using MAPE, defined in Equation 1. The results of this validation stage indicated a MAPE of 5.18%, as shown in Figure 5. Table 1 provides a shelter-level comparison of observed and simulated average passenger waiting times in greater detail.
Based on the Figure, the statistical output of the simulation model generated by the LLM shows good alignment (with minor discrepancies) across most shelters. The top 3 shelters with the most significant deviations are FH, FT, and FEB (each has a deviation of more than 5.8% relative to the observation data). However, the overall MAPE value of 5.18% indicates that the generated model reflects real-world system behavior.
To demonstrate the practical applicability of the LLM-generated simulation model for transportation planning purposes, a simple scenario analysis was conducted. The objective is to evaluate which strategy is effective in minimizing waiting time by reducing bus headway or increasing bus capacity. These are scenarios we evaluated:
•Baseline: Current operating conditions with a 15-minute bus headway, 60-passenger bus capacity.
•Scenario 1: Bus headway reduced from 15 minutes to 12 minutes while maintaining the same vehicle capacity.
•Scenario 2: Bus capacity increased from 60 to 80 passengers while maintaining the original 15-minute headway.
Each scenario was simulated under identical passenger demand conditions. The performance indicator was the system-wide average waiting time. Table 2 summarizes the results of the scenario analysis.
The results in Table 2 indicate that reducing bus headway produces a larger reduction in passenger waiting time. Increasing vehicle capacity also improves system performance, although the magnitude of the improvement is smaller than that achieved by increasing service frequency. These findings suggest that passenger waiting time is more sensitive to vehicle capacity under the demand conditions represented in the case study.
Table 1: The observed vs. the simulated value
| Shelter | Observed (min) | Simulated (min) | Percentage Error (%) |
|---|---|---|---|
| UI Dorms | 4.05 | 4.252 | 4.99 |
| Menwa | 4.53 | 4.304 | 4.99 |
| UI Station | 4.37 | 4.547 | 4.05 |
| FH | 4.37 | 4.108 | 5.99 |
| Pondokcina | 4.47 | 4.694 | 5.01 |
| RIK | 5.05 | 4.797 | 5.01 |
| FKM | 4.49 | 4.713 | 4.97 |
| FIK | 4.88 | 5.161 | 5.76 |
| Fasilkom | 4.95 | 4.707 | 4.91 |
| FMIPA | 5.39 | 5.125 | 4.92 |
| SOR | 5.93 | 6.158 | 3.85 |
| Vocational | 5.24 | 4.971 | 5.13 |
| FT | 5.62 | 5.947 | 5.82 |
| FEB | 8.53 | 9.026 | 5.81 |
| FIB | 6.86 | 7.248 | 5.66 |
| FISIP | 7.72 | 7.324 | 5.13 |
| FPsi | 8.75 | 9.190 | 5.03 |
| MAPE | 5.18% | ||
Table 2: Scenario analysis results
| Scenario | Headway (min) | Capacity (passenger) | Avg Waiting Time (min) | Change from baseline |
|---|---|---|---|---|
| Baseline | 15 | 60 | 5.708 | - |
| Sc 1 | 12 | 60 | 4.374 | -23.4% |
| Sc 2 | 15 | 80 | 4.966 | -13% |
4. Discussion
The results of implementing the proposed framework demonstrate its feasibility in combining conventional simulation model development and AI/LLMs to develop accurate DES simulation models with minimal manual coding. Applying the proposed framework to the Universitas Indonesia shuttle system, using structured prompts with GPT-4o/Codex, achieved a very low MAPE of 5.18% compared to real-world observations. These findings have important implications for the fields of simulation and modeling.
First, the results of this study demonstrate that the foundational theory of DES modeling has been strengthened, further strengthening a theory that is already highly mature. DES excels in accurately modeling operational systems with queueing, scheduling, and resource constraints, as previously highlighted by Banks48,49) and Robinson46,47). Conventional DES development processes still adhere to the principle that simulation development must be technically intensive and dependent on specialized modeling languages or commercial software10,27,51). The results of this study demonstrate a simulation model code that can be generated in approximately 20-40 seconds. These results reinforce the idea that using AI (especially LLMs) to generate open-source DES simulation code models, such as Python, can be adapted to minimize dependence on specific modeling languages or commercial software, which typically have expensive license fees, thereby accelerating the model development process. Based on the results of this study, the development of DES models with AI assistance can begin to be explored as an alternative to complement or replace conventional DES model development. Second, the results of this study show that GPT-4o/Codex successfully generated a basic DES model (without experimentation or intervention) of a public transportation system. These results align with recent exploratory studies on the potential use of LLMs to automate the development of a simulation model52–55).
A distinguished feature of our proposed framework, compared to previous similar approaches, is that it adds clear instructions in five parts as essential components of prompt construction. Additionally, this study builds on previous research by using real operational data and quantitatively validating model outputs against field observation data, using MAPE as the error metric. The MAPE value of 5.18% in this study indicates that LLMs, when supported by domain expertise and structured prompt design, can contribute not only to accelerating the development process but also to improving the quality of model outputs. Furthermore, the proposed modular prompt protocols enable reproducibility, reusability, and controlled variability in the development of simulation models. This contributes an additional pathway in modeling and simulation practice, in which natural language becomes a viable interface for generating simulation logic.
Third, this study improves conventional methodologies in model development by introducing a collaborative paradigm that combines human capabilities in system analysis with generative AI/LLMs’ capabilities. The results, in which code was generated in approximately 20-40 seconds and produced a MAPE of 5.18%, demonstrate a step toward accelerating the model creation process by reducing dependence on proprietary simulation software while maintaining model quality.
Finally, the scenario analysis demonstrates that the validated LLM-generated simulation model can be used to evaluate alternative operational strategies to support transportation planning. Although the scenarios provided are intentionally modest, we demonstrate how decision-makers can use the model to assess potential service improvements before implementation. Such analyses are particularly relevant to similar public transportation services, where decisions about vehicle capacity and service frequency directly affect the passenger experience.
This enables non-programmers to create operational model prototypes while maintaining methodological rigor in developing DES simulation models. Ultimately, the framework proposed here can democratize access to the rapid development of high-quality simulation models.
Although the results demonstrate that the proposed framework can successfully generate a valid discrete-event simulation (DES) model in a public transportation context, several limitations and risks associated with the LLM-assisted simulation model development framework should be acknowledged. First, LLM-generated code is susceptible to hallucination errors, in which the generated program may be syntactically correct yet contain incorrect simulation logic. Consequently, human verification remains an essential component of the framework. The model generation and verification stage (c) plays a critical role in identifying and correcting logic hallucinations before simulation results are used for decision-making.
Second, the framework proposed in this study is subject to prompt sensitivity. Any small changes in prompt wording, sentence structure, or level of detail may lead to substantially different executable simulation code. To mitigate this sensitivity issue, modelers should adopt iterative prompt-refinement procedures and maintain a documented repository of validated prompts to improve consistency across modeling projects using this framework.
Third, LLM outputs exhibit a degree of non-determinism, meaning that multiple executions of the same prompt may produce different results (code structures) despite addressing the same objective. While such variability can sometimes produce better solutions, it also raises concerns regarding computational reproducibility and methodological transparency. Future applications should therefore document prompt versions, model-generation iterations, and validation procedures to facilitate replication.
Finally, this study focuses on a relatively simple public transportation system, consisting of a single case study of a campus shuttle service operating during a limited observation period. As public transportation systems become more complex (such as in multi-route, multi-depot, or multi-modal transportation networks), the corresponding prompts become substantially more detailed and challenging to manage. Therefore, while the proposed framework demonstrates the applicability to modeling a campus shuttle transportation system, additional research is required to evaluate its scalability in more complex transportation environments. However, these limitations do not diminish the practical value of the proposed framework; rather, they highlight the importance of the human role in conducting rigorous verification procedures and systematic validation when implementing an LLM-assisted framework for DES simulation model development.
5. Conclusion
This study presents a validated and replicable framework for developing DES models for public transportation using LLMs. A real-world case study of the University of Indonesia campus shuttle system is used as the main case study in this research. By integrating the conventional DES development cycle with AI/LLM-assisted code generation, this framework significantly reduces the technical barriers to traditional simulation modeling while maintaining methodological rigor.
In addition, this study demonstrates that DES models generated from structured natural language prompts can closely replicate a public transportation system in real-world settings. This finding suggests a potential shift in simulation practice from code-centric to prompt-driven modeling. The shift can open new opportunities for rapid prototyping, educational use, and deployment in environments with limited programming skills. This framework can be extended to support scenario experimentation by adjusting several system parameters. For instance, bus capacity, bus interarrival distributions, or routing choices can be modified to improve system performance while maintaining efficiency. These modifications will enable modelers and transport planners to explore optimization strategies for public transportation systems in campus and urban contexts.
However, this study is limited to a single case study of a campus shuttle service, which may not capture the full complexity of urban public transport operations. Future research should apply the proposed framework to generate a model for large-scale systems, such as city buses, metro, commuter lines, or mass rapid transit, to assess its scalability and generalizability.
CRediT authorship contribution statement
Arry Rahmawan Destyanto: Conceptualization, Data Curation, Formal analysis, Investigation, Methodology, Software, Supervision, Validation, Visualization, Writing – original draft, Melinda Nurimannisa: Conceptualization, Supervision, Validation, Writing – review & editing, Dendy Rio Casillas Pratama: Validation, Writing – review & editing.
Declaration of Competing Interest
The authors declare that they have no known competing financial interests that could have appeared to influence the work reported in this paper.
Data Availability
The data that support the findings of this study are available in the supplementary information.
Acknowledgements
The authors would like to thank the Industrial Engineering Department, Universitas Indonesia, for supporting this research and publication process.
Nomenclature
| Symbol | Description |
|---|---|
| AI | artificial intelligence |
| DES | discrete-event simulation |
| LLM | large language models |
| MAPE | mean absolute percentage error |
References
- Z. Zhao, M. Fang, L. Tang, X. Yang, Z. Kan, and Q. Li, “The impact of community shuttle services on traffic and traffic-related air pollution,” IJERPH, 19 (22) 15128 (2022). doi:10.3390/ijerph192215128.
- E. Puzio, W. Drożdż, and M. Kolon, “The role of intelligent transport systems and smart technologies in urban traffic management in polish smart cities,” Energies, 18 (10) 2580 (2025). doi:10.3390/en18102580.
- M.A.S.A.S. Abdulrahman, and F.T. Dweiri, “Development of an agile and sustainable framework for resilient and inclusive public transport organizations,” Sustainability, 17 (10) 4652 (2025). doi:10.3390/su17104652.
- A.Y.S. Lam, Y.-W. Leung, and X. Chu, “Autonomous-vehicle public transportation system: scheduling and admission control,” IEEE Trans. Intell. Transport. Syst., 17 (5) 1210–1226 (2016). doi:10.1109/TITS.2015.2513071.
- L.J. Basso, F. Feres, and H.E. Silva, “The efficiency of bus rapid transit (brt) systems: a dynamic congestion approach,” Transportation Research Part B: Methodological, 127 47–71 (2019). doi:10.1016/j.trb.2019.06.012.
- X. Sun, and Y. Zu, “Research on fleet size of demand response shuttle bus based on minimum cost method,” Applied Sciences, 15 (10) 5350 (2025). doi:10.3390/app15105350.
- J.E. Barrera Hernandez, L.E. Tarazona Torres, A. Tabares, and D. Álvarez-Martínez, “Optimization of bus dispatching in public transportation through a heuristic approach based on passenger demand forecasting,” Smart Cities, 8 (3) 87 (2025). doi:10.3390/smartcities8030087.
- J.-P. Jokinen, “Modelling optimal policies of demand responsive transport and interrelationships between occupancy rate and costs,” (2021). doi:10.48550/ARXIV.2103.00565.
- F. Carreyre, T. Chouaki, N. Coulombel, J. Berrada, L. Bouillaut, and S. Hörl, “On-demand autonomous vehicles in berlin: a cost–benefit analysis,” Transportation Research Record: Journal of the Transportation Research Board, 2678 (5) 13–30 (2024). doi:10.1177/03611981231186988.
- T. van der Spek, “A multi-method simulation of a high-frequency bus line using anylogic,” (2017). doi:10.48550/ARXIV.1704.05692.
- C.-R. Campo, J.-P. Salazar, and C.-A. Cobos-Lozada, “ModeLab - web tool for the modeling of bus rapid transit systems,” Rev. Fac. Ing., 30 (56) e13294 (2021). doi:10.19053/01211129.v30.n56.2021.13294.
- A. Lopez, S. Seriani, A. Peña, V. Aprigliano, and B. Arredondo, “Infrastructure typology of metro stations: a passenger simulation approach based on efficiency and capacity,” Applied Sciences, 15 (6) 2889 (2025). doi:10.3390/app15062889.
- V. Krivda, J. Petru, D. Macha, and J. Novak, “Use of microsimulation traffic models as means for ensuring public transport sustainability and accessibility,” Sustainability, 13 (5) 2709 (2021). doi:10.3390/su13052709.
- D. Moffatt, and H. Dia, “Development and evaluation of simulation-based low carbon mobility assessment models,” Future Transportation, 1 (2) 134–153 (2021). doi:10.3390/futuretransp1020009.
- W.B. Daszczuk, “Discrete event simulation of personal rapid transit (prt) systems,” (2017). doi:10.48550/ARXIV.1705.05237.
- V.K. Dubey, and D. Veeramani, “A framework for sizing an automated distribution center in a retail supply chain,” Simulation Modelling Practice and Theory, 75 113–126 (2017). doi:10.1016/j.simpat.2017.03.014.
- B.P. Zeigler, A. Muzy, and E. Kofman, “Theory of Modeling and Simulation: Discrete Event & Iterative System Computational Foundations,” 3rd ed., Academic Press, Elsevier (2018). doi:10.1016/C2016-0-03987-6.
- P. Barlas, and C. Heavey, “Automation of input data to discrete event simulation for manufacturing: a review,” Int. J. Model. Simul. Sci. Comput., 07 (01) 1630001 (2016). doi:10.1142/S1793962316300016.
- J. Wales, and M. Marinov, “Analysis of delays and delay mitigation on a metropolitan rail network using event based simulation,” Simulation Modelling Practice and Theory, 52 52–77 (2015). doi:10.1016/j.simpat.2015.01.002.
- J. Liang, C. Gong, Y. Hou, M. Yu, and W. Wang, “Application of networked discrete event system theory on intelligent transportation systems,” Control Theory Technol., 19 (2) 236–248 (2021). doi:10.1007/s11768-020-00002-2.
- Y. Li, X. Yang, J. Wu, H. Sun, X. Guo, and L. Zhou, “Discrete-event simulations for metro train operation under emergencies: a multi-agent based model with parallel computing,” Physica A: Statistical Mechanics and Its Applications, 573 125964 (2021). doi:10.1016/j.physa.2021.125964.
- S.-W. Cho, Y.-H. Lim, S.-H. Ju, and K.-M. Seo, “Analyzing new operation strategy of demand-responsive transports using discrete-event simulation framework,” Systems, 13 (4) 303 (2025). doi:10.3390/systems13040303.
- T.J. Schriber, and D.T. Brunner, “Inside Discrete-Event Simulation Software: How it Works and Why it Matters,” in: Proceedings of the Winter Simulation Conference, 2005., IEEE, Orlando, FL. USA, 2005: pp. 167–177. doi:10.1109/WSC.2005.1574249.
- Y. Huang, M.D. Seck, and A. Verbraeck, “Component-based light-rail modeling in discrete event systems specification (devs),” SIMULATION, 91 (12) 1027–1051 (2015). doi:10.1177/0037549715614652.
- C.R. Harrell, and R.N. Price, “Simulation modeling using ProModel technology,” in: Proceedings of the 2003 International Conference on Machine Learning and Cybernetics (IEEE Cat. No.03EX693), IEEE, New Orleans, LA, USA, 2003: pp. 175–181. doi:10.1109/WSC.2003.1261421.
- C.D. Pegden, “Simio: A new simulation system based on intelligent objects,” in: 2007 Winter Simulation Conference, IEEE, Washington, DC, USA, 2007: pp. 2293–2300. doi:10.1109/WSC.2007.4419867.
- N. Galaske, E. Tantik, and R. Anderl, “Discrete-Event Simulation Software for Modeling Flexibility-Driven Manufacturing Processes,” in: Volume 4: 20th Design for Manufacturing and the Life Cycle Conference; 9th International Conference on Micro- and Nanosystems, American Society of Mechanical Engineers, Boston, Massachusetts, USA, 2015: p. V004T05A015. doi:10.1115/DETC2015-47411.
- A. Borshchev, “Multi‐method modelling: AnyLogic,” in: S. Brailsford, L. Churilov, B. Dangerfield (Eds.), Discrete‐Event Simulation and System Dynamics for Management Decision Making, 1st ed., Wiley, 2014: pp. 248–279. doi:10.1002/9781118762745.ch12.
- H. El Raoui, M. Oudani, and A.E.H. Alaoui, “ABM-gis simulation for urban freight distribution of perishable food,” MATEC Web Conf., 200 00006 (2018). doi:10.1051/matecconf/201820000006.
- A. Attajer, S. Darmoul, S. Chaabane, F. Riane, and Y. Sallez, “Benchmarking Simulation Software Capabilities Against Distributed Control Requirements: FlexSim vs AnyLogic,” in: T. Borangiu, D. Trentesaux, P. Leitão, O. Cardin, S. Lamouri (Eds.), Service Oriented, Holonic and Multi-Agent Manufacturing Systems for Industry of the Future, Springer International Publishing, Cham, 2021: pp. 520–531. doi:10.1007/978-3-030-69373-2_38.
- R. Van Der Ham, “Salabim: discrete event simulation and animation in python,” JOSS, 3 (27) 767 (2018). doi:10.21105/joss.00767.
- D. Zinoviev, “Discrete event simulation: it’s easy with simpy!,” (2024). doi:10.48550/ARXIV.2405.01562.
- I. Jackson, M. Jesus Saenz, and D. Ivanov, “From natural language to simulations: applying ai to automate simulation modelling of logistics systems,” International Journal of Production Research, 62 (4) 1434–1457 (2024). doi:10.1080/00207543.2023.2276811.
- C. Gao, X. Lan, N. Li, Y. Yuan, J. Ding, Z. Zhou, F. Xu, and Y. Li, “Large language models empowered agent-based modeling and simulation: a survey and perspectives,” Humanit Soc Sci Commun, 11 (1) 1259 (2024). doi:10.1057/s41599-024-03611-3.
- J. Kleiman, K. Frank, J. Voyles, and S. Campagna, “Simulation agent: a framework for integrating simulation and large language models for enhanced decision-making,” (2025). doi:10.48550/ARXIV.2505.13761.
- G. Jagadeesh, S. Iyer, M. Polanowski, and K.X. Thia, “Application and evaluation of large language models for forecasting the impact of traffic incidents,” (2025). doi:10.48550/ARXIV.2507.04803.
- D. Mahmud, H. Hajmohamed, S. Almentheri, S. Alqaydi, L. Aldhaheri, R.A. Khalil, and N. Saeed, “Integrating llms with its: recent advances, potentials, challenges, and future directions,” (2025). doi:10.48550/ARXIV.2501.04437.
- L. Gao, Y. Liu, H. Chen, D. Liu, Y. Zhang, and J. Sun, “Exploring Traffic Simulation and Cybersecurity Strategies Using Large Language Models,” in: 2025 IEEE Security and Privacy Workshops (SPW), IEEE, San Francisco, CA, USA, 2025: pp. 346–351. doi:10.1109/SPW67851.2025.00048.
- S. Rasal, and E.J. Hauer, “Optimal decision making through scenario simulations using large language models,” (2024). doi:10.48550/ARXIV.2407.06486.
- Z. Rasheed, M. Waseem, K.K. Kemell, A. Ahmad, M.A. Sami, J. Rasku, K. Systä, and P. Abrahamsson, “Large language models for code generation: the practitioners perspective,” (2025). doi:10.48550/ARXIV.2501.16998.
- A. Greasley, and J.S. Edwards, “Enhancing discrete-event simulation with big data analytics: a review,” Journal of the Operational Research Society, 72 (2) 247–267 (2021). doi:10.1080/01605682.2019.1678406.
- E. Frydenlund, J. Martínez, J.J. Padilla, K. Palacio, and D. Shuttleworth, “Modeler in a box: how can large language models aid in the simulation modeling process?,” SIMULATION, 100 (7) 727–749 (2024). doi:10.1177/00375497241239360.
- T. Schmitt, N. Gegenmantel, M. Urenda Moris, P. Mårtensson, and K. Amouzgar, “LLM-driven discrete-event simulation: a generative ai framework for automated model generation, adaptation, and evaluation in manufacturing,” Journal of Manufacturing Systems, 85 642–661 (2026). doi:10.1016/j.jmsy.2026.02.015.
- S. Maaz, J.C. Palaganas, G. Palaganas, and M. Bajwa, “A guide to prompt design: foundations and applications for healthcare simulationists,” Front. Med., 11 1504532 (2025). doi:10.3389/fmed.2024.1504532.
- L. Winkler, D. Pearce, J. Nelson, and O. Babacan, “The effect of sustainable mobility transition policies on cumulative urban transport emissions and energy demand,” Nat Commun, 14 (1) 2357 (2023). doi:10.1038/s41467-023-37728-x.
- S. Robinson, “Conceptual modelling for simulation: progress and grand challenges,” Journal of Simulation, 14 (1) 1–20 (2020). doi:10.1080/17477778.2019.1604466.
- S. Robinson, G. Arbez, L.G. Birta, A. Tolk, and G. Wagner, “Conceptual modeling: Definition, purpose and benefits,” in: 2015 Winter Simulation Conference (WSC), IEEE, Huntington Beach, CA, USA, 2015: pp. 2812–2826. doi:10.1109/WSC.2015.7408386.
- J. Banks, “Verifying and validating complex simulation models by analogy,” SIMULATION, 54 (1) 33–36 (1990). doi:10.1177/003754979005400106.
- J. Banks, “Testing, understanding, and validating complex simulation models,” in: Proceedings of the 21st Conference on Winter Simulation - WSC ’89, ACM Press, Washington, D.C., United States, 1989: pp. 549–551. doi:10.1145/76738.76809.
- J. Preston, “Public Transport,” in: International Encyclopedia of Human Geography, Elsevier, 2020: pp. 113–120. doi:10.1016/B978-0-08-102295-5.10325-7.
- S. Robinson, “Discrete-event simulation: from the pioneers to the present, what next?,” Journal of the Operational Research Society, 56 (6) 619–629 (2005). doi:10.1057/palgrave.jors.2601864.
- T. Liu, J. Yang, and Y. Yin, “Toward llm-agent-based modeling of transportation systems: a conceptual framework,” (2024). doi:10.48550/ARXIV.2412.06681.
- I. Jackson, and M.J. Saenz, “From natural language to simulations: applying gpt-3 codex to automate simulation modeling of logistics systems,” SSRN Journal, (2022). doi:10.2139/ssrn.4203417.
- Y.-L. Song, C.-E. Tsern, C.-C. Wu, Y.-M. Chang, S.-B. Huang, W.-C. Chen, M.C.-L. Lin, and Y.-T. Lin, “Incorporating llms for large-scale urban complex mobility simulation,” (2025). doi:10.48550/ARXIV.2505.21880.
- A. Nouri, J. Andersson, K.D.J. Hornig, Z. Fei, E. Knabe, H. Sivencrona, B. Cabrero-Daniel, and C. Berger, “On simulation-guided llm-based code generation for safe autonomous driving software,” (2025). doi:10.48550/ARXIV.2504.02141.