
Abstract
This study presents a multimodal characterization of Methylosinus sp. strain C49 (MC49), a Type II methanotroph, to establish a reproducible workflow for methane mitigation and bioplastic polyhydroxyalkanoate (PHA) production. Cryopreserved cultures exhibited measurable growth by day 10, peaking at OD₆₀₀ 0.357 by day 14. Fluorescence microscopy identified SYBR Green I combined with SlowFade™ Diamond as optimal for cell visualization, while PCR-RFLP confirmed genetic purity across subcultures, storage methods, and environmental conditions, with minor changes after prolonged starvation. This integrated approach provides a reliable framework for methanotroph-based biotechnological applications and underscores critical considerations for culture maintenance, imaging, and molecular validation.
Keywords: Cryopreservation, DNA staining, Genetic stability, Methanotroph, PCR-RFLP
Outline
1. Introduction
Methane (CH4) is one of the most potent greenhouse gases, exhibiting a global warming potential approximately 27 times higher than carbon dioxide (CO2) over a 100-year timescale1). Recent global assessments have highlighted a continuous increase in anthropogenic methane emissions, intensifying concerns regarding climate change and environmental sustainability2). In this context, biological methane mitigation using methanotrophic microorganisms–capable of utilizing CH4 as their sole source of carbon and energy–has emerged as a promising and environmentally friendly strategy3,4). Members of the genus Methylosinus, classified as Type II methane-oxidizing bacteria (MOB), have attracted increasing attention because of their versatile metabolism and potential for biotechnological applications, such as producing biopolymers like polyhydroxyalkanoate (PHA)5–8).
Methylosinus sp. strain C49 (MC49), a Type II methanotroph isolated from a rice paddy field in Japan9), has previously been characterized with respect to its methane oxidation kinetics, growth characteristics, and PHA production potential under various cultivation conditions9–11). Previous studies demonstrated that MC49 grows optimally at pH 6.8 and 25°C in a headspace containing 25% CH4 and 75% air, exhibiting a maximum specific growth rate of 0.049 h-1 and a doubling time of approximately 14 h under optimal conditions10). In addition, MC49 exhibited a high methane oxidation capacity and enhanced PHA accumulation under feast–famine cultivation, highlighting its potential for simultaneous methane mitigation and sustainable bioplastic production11). Rice paddies are among the largest biological sources of atmospheric methane due to anaerobic methanogenesis in flooded soils. In contrast, they also harbor diverse methanotrophic communities that consume a substantial fraction of the methane before it is released into the atmosphere, underscoring the ecological significance of paddy-derived methanotrophs12). Unlike methane-producing archaea (methanogens), which produce methane under anaerobic conditions3,13), MC49 is a methane-oxidizing bacterium (methanotroph) that consumes methane aerobically as its sole carbon and energy source. This metabolic capability, coupled with its ability to convert methane into PHA, underscores its relevance for both environmental and industrial biotechnology applications9,10). Compared with previously reported MOB, MC49 exhibited favorable growth kinetics and PHA production performance under laboratory conditions10), highlighting its potential as a model organism in methane oxidation and biopolymer synthesis research. However, previous studies have primarily focused on the physiological characteristics and biotechnological potential of MC49, whereas methodological aspects related to culture revival, fluorescence imaging optimization, and molecular verification of culture purity have not been comprehensively investigated.
Despite these previous physiological studies, long-term cultivation, cryopreservation, and repeated subculturing of laboratory strains may lead to physiological alterations or contamination if appropriate quality control measures are not implemented. Best practices in microbial preservation highlight these risks14). Furthermore, fluorescence-based techniques for microbial imaging and enumeration, such as those used in cell counting and structural visualization, rely heavily on the quality of staining reagents and antifade mountants, which may degrade over time or present cytotoxic risks15). Therefore, ensuring the physiological integrity and purity of MC49 requires a robust preconditioning and quality control protocol prior to downstream experimentation.
In this context, this study aims to develop a multimodal characterization protocol for Methylosinus sp. strain C49, integrating physiological, microscopic, and molecular analyses. Specifically, we aim to (1) evaluate the revival of cryopreserved MC49 cells and their subculturing efficiency in nitrate mineral salts (NMS) medium under methane-rich conditions, (2) assess the applicability of SlowFade™ Diamond Antifade Mountant as a safer, commercial alternative to conventional Mowiol mounting medium and compare the detectability of three fluorescent DNA-binding dyes–DAPI, SYBR Gold, and SYBR Green I–using fluorescence microscopy, and (3) assess the genetic purity and consistency of subcultures under varying experimental conditions including a PHA-synthesis condition by polymerase chain reaction-restriction fragment length polymorphism (PCR-RFLP) analysis with HhaI digestion. Together, these objectives establish a robust workflow for reliable characterization and quality assurance of MC49, facilitating its use in methane mitigation and biotechnological applications.
This study addresses practical gaps in methanotroph-based research by proposing a reliable workflow for maintaining culture quality, optimizing microscopy for cell quantification, and detecting potential culture contamination or mutation. Interestingly, this study also reports fluorescence signals that may indicate previously undocumented autofluorescence in Methylosinus sp., warranting further investigation. The integration of these three approaches provides a framework to ensure experimental reproducibility in methane mitigation studies.
2. Materials and methods
2.1. Strain and Culture Preparation
Methylosinus sp. strain C49 (MC49), a Type II methane-oxidizing bacterium (MOB), was selected as the model organism in this study. The strain was originally isolated from a methane-emitting rice paddy field and maintained as cryopreserved stocks at −80°C9). Cryoprotection using glycerol or dimethyl sulfoxide (DMSO) followed established preservation practices for methanotrophic bacteria16). All experiments were initiated using glycerol-based frozen stocks unless otherwise specified.
Cells were cultivated in nitrate mineral salts (NMS) medium prepared according to the formulation of Whittenbury et al.17), with minor laboratory adaptations. The medium composition per liter of ultrapure water included: MgSO4·7H2O (1.0 g), KNO3 (1.0 g), CaCl2·2H2O (0.228 g), Fe-EDTA solution (0.1 mL, 3.8%), NaMoO4·4H2O (0.5 mL, 0.1%), trace element solution (10 mL), phosphate buffer (10 mL, adjusted to pH 6.8), vitamin solution (10 mL), and CuCl2·2H2O (10 mL, 10 mM). Trace element solution consisted of FeSO4·7H2O (500 mg), ZnSO4·7H2O (400 mg), MnCl2·7H2O (20 mg), CoCl2·6H2O (50 mg), NiCl2·6H2O (10 mg), H3BO3 (15 mg), and EDTA-2Na (250 mg) per liter. The phosphate buffer contained KH2PO4 (26 g) and Na2HPO4·12H2O (82.83 g) per liter. Vitamin solution was prepared by dissolving biotin (2.0 mg), folic acid (2.0 mg), thiamine HCl (5.0 mg), calcium pantothenate (5.0 mg), vitamin B12 (0.1 mg), riboflavin (5.0 mg), and nicotinamide (5.0 mg) per liter.
NMS is a chemically defined mineral medium widely used for the selective cultivation of methanotrophs because it supplies essential inorganic nutrients while excluding organic carbon sources17). Under these conditions, methane serves as the sole carbon and energy source, enabling the selective growth and characterization of methane-oxidizing bacteria such as MC49.
For culture reactivation, 30 mL of NMS medium was dispensed into 120 mL serum vials, which were sealed with butyl rubber stoppers and aluminum crimps. After sealing, 30 mL of high-purity methane (99.99%) was injected into the headspace using a gas-tight syringe, resulting in a headspace containing approximately 25% (v/v) methane. The remaining headspace consisted of atmospheric air, providing oxygen for aerobic methane oxidation while methane served as the sole carbon and energy source. Base medium components (excluding phosphate, vitamins, and copper) were sterilized by autoclaving (121°C, 15 min), while heat-labile components were sterilized separately by filtration (0.20 µm membrane filter, DISMIC 25CS020AN, Advantec, Tokyo, Japan) and added aseptically after cooling. Each vial was inoculated with 1.5 mL of thawed cryostock and incubated at 30°C with orbital shaking at 130 rpm (Bioshaker NR-30, Taitec, Saitama, Japan).
2.2. Subculturing and Growth Monitoring
Resuscitated MC49 cultures were used to inoculate fresh NMS medium, producing starter cultures for subsequent experiments. Subculturing was performed weekly to maintain cell viability and metabolic activity. The optical density at 600 nm (OD600) of the subculture was periodically measured using the cuvette mode of a NanoDrop 2000c spectrophotometer (Thermo Fisher Scientific, MA, USA) to confirm that the culture had reached an OD600 of approximately 0.3 prior to inoculation into the growth-monitoring system. Approximately 500 µL of culture suspension was aseptically withdrawn from sealed serum vials in a clean bench using a sterile syringe inserted through the butyl rubber stopper and transferred to a cuvette for OD600 measurement.
For continuous growth monitoring, 7.5 mL of NMS base medium was dispensed into sterile 30-mL culture tubes, sealed with sterile butyl rubber septa and screw caps, and supplemented with 7.5 mL of high-purity methane (99.99%), corresponding to approximately 25% (v/v) methane in the headspace. The sealed tubes were sterilized by autoclaving. After cooling to room temperature, each tube was inoculated with 25 µL of actively growing MC49 culture, followed by the aseptic addition of three filter-sterilized (0.2 µm) supplemental solutions. Cultures were incubated at 30°C with shaking at 130 rpm.
OD600 was continuously monitored at 5-minute intervals using a non-contact turbidimeter (OD-Monitor C&T: 0066459-000, Taitec, Saitama, Japan) attached externally to each culture tube. This system enabled real-time, non-invasive OD600 measurements without disturbing the sterile cultivation conditions or the CH4–air headspace composition. Growth profiles were automatically recorded and visualized using the OD Viewer software connected to the OD-control unit. A schematic of the cultivation and monitoring system is shown in Supplementary Figure S1, while the shaker-mounted monitoring setup is presented in Supplementary Figure S2.
2.3. Fluorescence Staining and Microscopy
To evaluate alternative staining and mounting reagents for fluorescence-based visualization of MC49, a comparative study was conducted using SlowFade™ Diamond Antifade Mountant and various nucleic acid stains. The effectiveness of DAPI and SYBR Gold as substitutes for the commonly used SYBR Green I was assessed in
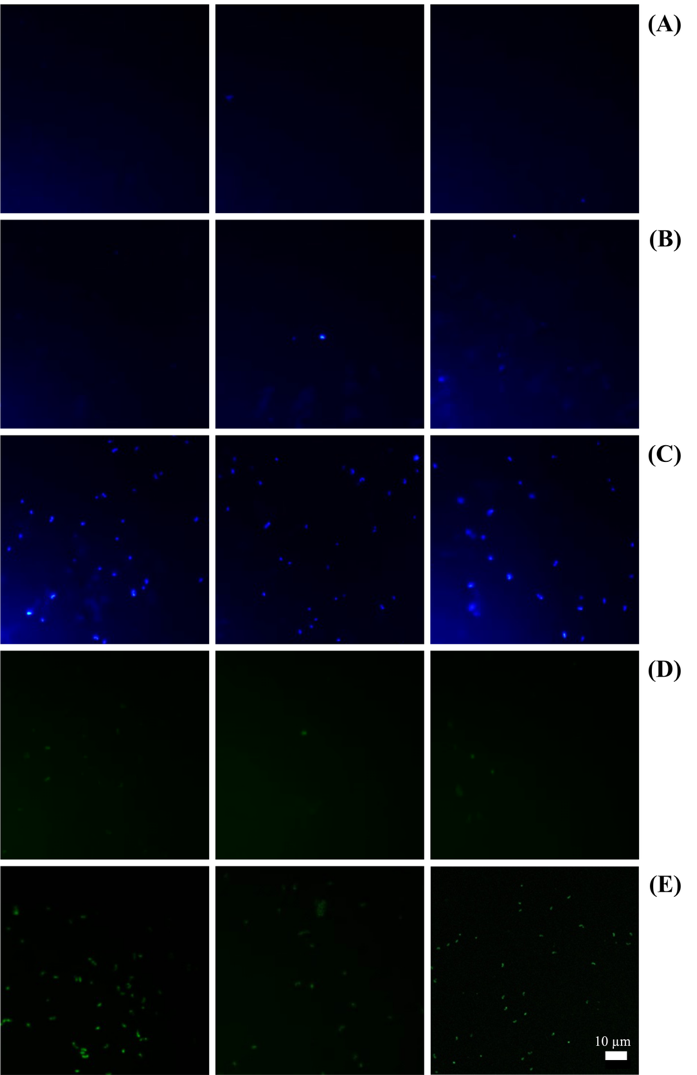
Table 1: Experimental test conditions for fluorescence microscopy of Methylosinus sp. strain C49
| Test No. | Condition description |
|---|---|
| 1 | SlowFade™ Diamond with DAPI (used as provided) |
| 2 | SlowFade™ Diamond + DAPI (lab’s FISH protocol22)) |
| 3 | SlowFade™ Diamond + DAPI (manufacturer’s protocol) |
| 4 | SlowFade™ Diamond + SYBR Gold |
| 5 | SlowFade™ Diamond + SYBR Green I |
conjunction with SlowFade™ as a mounting medium. SYBR Green I has been demonstrated to provide superior fluorescence intensity and sensitivity for detecting viable cells, including those of slow-growing bacteria18,19). Additionally, SlowFade™ Diamond is formulated to minimize photobleaching and reduce cytotoxic effects during fluorescence imaging, making it suitable for sensitive microbial samples20). Five experimental conditions were established (Table 1), based on modified protocols from Suenaga et al.21).
2.3.1. Cell Fixation and Permeabilization
Cell suspensions (1.5 mL) were transferred into 2.0 mL microcentrifuge tubes and chemically fixed with 130 L of a 25% (v/v) glutaraldehyde stock solution, resulting in a final glutaraldehyde concentration of approximately 2.0% (v/v). Fixed samples were subsequently diluted tenfold with 0.05× phosphate-buffered saline (PBS), followed by the addition of 99.5% ethanol to a final concentration of 10% (v/v). To promote cell permeabilization and improve dispersion, samples were incubated in a water bath at 30 ± 2°C and subjected to ultrasonic treatment for 15 min using a water bath sonicator (AS ONE MCU-20, Osaka, Japan).
2.3.2. Membrane Filtration and Slide Preparation
An aliquot (500 µL) of treated cell suspension was vacuum-filtered onto a 0.2 µm black polycarbonate membrane filter (Isopore, Merck Millipore, Germany) under vacuum. Filters were rinsed three times with sterile 1× Tris-acetate-EDTA (TAE) buffer to remove residual reagents, followed by air-drying. The membranes were then aseptically mounted onto glass microscope slides for staining.
2.3.3. Staining and Mounting Procedures
Three DNA-binding dyes – DAPI, SYBR Gold, and SYBR Green I – were tested with SlowFade™ Diamond Antifade Mountant for their staining efficacy.
DAPI Staining: For Tests 2 and 3, DAPI staining was conducted using two protocols. In Test 2 (lab protocol), DAPI stock solution was diluted to 0.2% (v/v) in 0.05× PBS, and 300 µL was applied to the slide-mounted cells. Incubation was performed at 37°C for 30 minutes, followed by two washes with 0.05× PBS. In Test 3, the manufacturer’s staining procedure was followed. In both cases, a drop of SlowFade™ Diamond Antifade Mountant (Thermo Fisher Scientific, USA) was applied before placing a cover glass. Test 1 utilized SlowFade™ Diamond pre-mixed with DAPI, eliminating the need for separate staining and washing steps.
SYBR Gold and SYBR Green I Staining: In Tests 4 and 5, SYBR dyes (Gold or Green I) were prepared by mixing 1 µL of dye with 199 µL of SlowFade™ Diamond. A total of 8 µL of the dye-mountant solution was applied to the filter, and a cover glass was gently placed to evenly distribute the stain.
2.3.4. Microscopic Observation
Fluorescence imaging was carried out using an epifluorescence microscope (BZ-8100, Keyence, Osaka, Japan) equipped with a 100× oil immersion objective lens. Fluorescent filter sets appropriate for each dye were used: a blue filter for DAPI (excitation/emission: 360/460 nm), and green filters for SYBR Gold (excitation/emission: ~495/537 nm) and SYBR Green I (excitation/emission: 497/520 nm). Images were captured using a standardized shutter speed of 1/1.5 seconds to ensure consistency and comparability of fluorescence intensities across all tests.
2.4. Genetic Purity Verification by PCR-RFLP Analysis
Genetic stability and culture purity were evaluated using PCR-RFLP targeting the 16S rRNA gene. This molecular technique is widely applied for strain-level discrimination and has been successfully used to verify microbial identity23,24). Genomic DNA was extracted from actively growing cultures using the FastDNA™ SPIN Kit (MP Biomedicals, California, USA) following the manufacturer’s protocol. DNA quality and concentration were assessed spectrophotometrically prior to downstream applications.
The nearly full-length 16S rRNA gene was amplified using universal bacterial primers 27F (5′-AGAGTTTGATCCTGGCTCAG-3′) and 1492R (5′-GGTTACCTTGTTACGACTT-3′), as described by Frank et al.25). Each 50 µL PCR reaction contained nuclease-free water (37.4 µL), 10× ExTaq buffer (5 µL, Takara Bio Inc., Shiga, Japan), dNTP mix (4 µL, 2.5 mM each), forward and reverse primers (1 µL each, 10 µM), ExTaq DNA polymerase (0.6 µL, Takara Bio Inc., Shiga, Japan), and template DNA (1 µL). PCR was conducted using a T100™ Thermal Cycler (Bio-Rad Laboratories, California, USA) with the following cycling parameters: initial denaturation (94°C, 5 min); 30 cycles of denaturation (94°C, 1 min), annealing (55°C, 1 min), and extension (72°C, 1 min); followed by a final extension (72°C, 5 min).
The resulting amplicons were digested with the restriction endonuclease HhaI (Takara Bio Inc.), which targets the palindromic sequence 5′-GCG^C-3′. For digestion, PCR product (25 µL) was mixed with 10× M buffer (3 µL) and HhaI enzyme (0.6 µL), followed by incubation (37°C, 20 min). Digested fragments were separated by agarose gel electrophoresis on 3% (w/v) gels prepared in 1× TAE buffer and run at 100 V for approximately 60 min.
After electrophoresis, the gels were stained with SYBR™ Gold (Invitrogen, Massachusetts, USA) for 20 min and visualized using the Gel Doc™ EZ Imaging System (Bio-Rad Laboratories, California, USA). The resulting RFLP profiles were analyzed to evaluate the presence of potential mutations, verify genetic uniformity, and confirm the absence of contamination across experimental conditions. Consistency in restriction patterns was interpreted as evidence that all cultures were derived from the same clonal origin and remained uncontaminated during experimental procedures.
All experiments were conducted using at least three independent biological replicates. Results are presented as mean ± standard deviation (SD). No inferential statistical analyses were performed, as the study focused on descriptive evaluation of methodological performance.
3. Results and Discussion
3.1. Growth Dynamics and Reactivation of MC49 from Cryopreserved Stocks
Glycerol-stocked MC49 cultures were inoculated into NMS medium under a methane-rich headspace at an initial optical density at 600 nm (OD600) of 0.32. Visible turbidity appeared after approximately 9.5 days of incubation at 30°C with shaking at 130 rpm, and OD600 measurements indicated a progressive increase in cell density, reaching a maximum of 0.357 on day 14 (Figure 1). Results of a parallel experiment showing turbidity changes are shown in Supplementary Figure S3. The growth curve displayed an initial lag phase lasting approximately 9.5 days, during which cells adapted metabolically to the mineral salts medium and gaseous substrate. This was followed by an exponential growth phase spanning days 10 to 14, characterized by a rapid increase in cell density. The culture subsequently entered the stationary phase around day 14, with growth plateauing thereafter (Figure 1). Cultivation was terminated on day 22; therefore, the subsequent progression of the stationary phase could not be assessed.
This extended lag phase is consistent with previous reports of slow-growing Type II methanotrophs cultured under methane-rich conditions, reflecting the metabolic adaptation required for growth in mineral salts medium with a gaseous substrate3,6,26). These findings align well with earlier studies on Methylosinus strains, which have similarly reported prolonged lag phases and slow growth rates under methane-enriched conditions4,10,27,28).
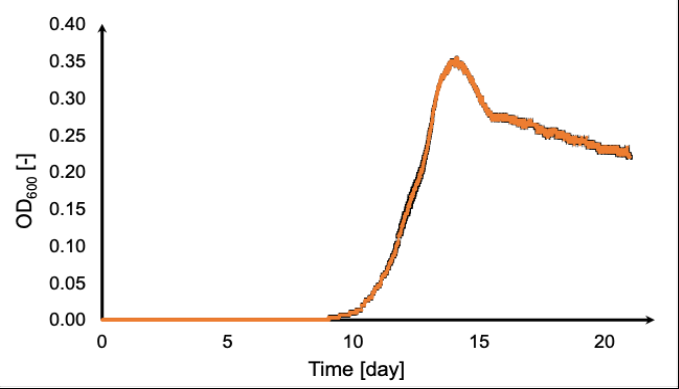
Compared to other strains, MC49 exhibits comparable or slightly improved growth kinetics, suggesting its suitability for applications requiring robust methane oxidation. These growth characteristics should be considered when planning experiments to ensure cells reach the appropriate physiological state for downstream applications.
3.2. Fluorescence Imaging Performance of Antifade Mountants and DNA Stains on MC49 Cells
The effectiveness of various DNA-binding dyes and mounting media for fluorescence microscopy of Methylosinus sp. strain C49 was systematically assessed. Cells mounted with SlowFade™ Diamond Antifade Mountant and stained with DAPI following the FISH protocol22) exhibited clear, punctate fluorescence indicative of intracellular DNA localization (Figure 2B). When stained with DAPI according to the manufacturer’s protocol, fluorescence appeared stronger and more distinct, suggesting enhanced dye uptake or preservation under these conditions (Figure 2C).
SYBR Gold staining produced fluorescence signals of comparatively lower intensity, resulting in less pronounced nucleic acid visualization (Figure 2D). In contrast, SYBR Green I staining yielded the highest fluorescence intensity among the dyes tested, with bright and well-defined cellular signals when mounted with SlowFade™ Diamond (Figure 2E).
Additional fluorescence microscopy observations using Mowiol mounting medium with SYBR Green I (Figure 3) revealed that fluorescence intensity is influenced by sample concentration and imaging parameters. Undiluted cell suspensions imaged at the standard exposure time (1/1.5 s) exhibited strong fluorescence (Figure 3A), allowing reliable cell detection and visualization. In contrast, diluted samples reduced fluorescence intensity
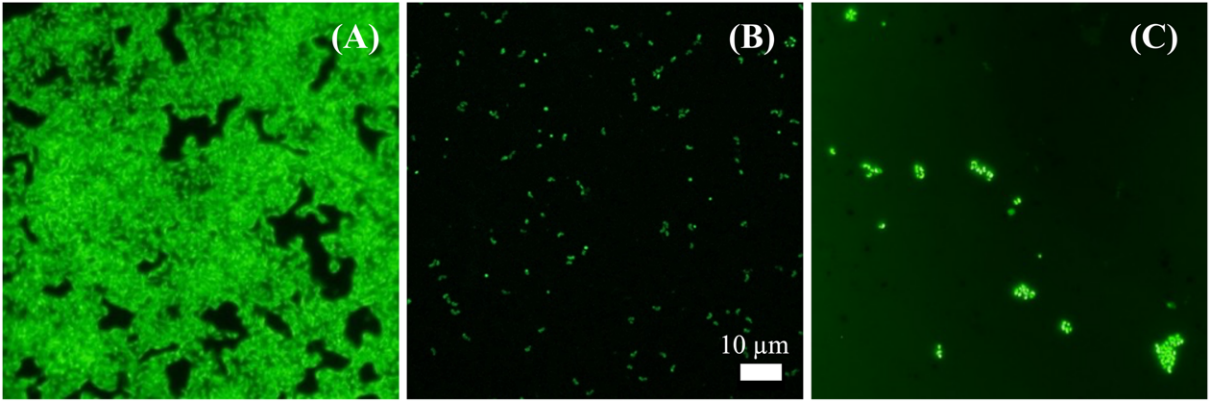
(Figure 3B), which could challenge cell enumeration accuracy. Increasing the exposure time enhanced the fluorescence signal but also increased background noise, reducing image clarity (Figure 3C). These results suggest that Mowiol mounting medium provides less photostability than SlowFade™ Diamond, requiring careful optimization of staining and imaging conditions for accurate fluorescence detection. Therefore, SlowFade™ Diamond combined with SYBR Green I remains the preferred choice for sensitive and reproducible visualization of MC49 cells.
The unstained control mounted with SlowFade™ Diamond showed minimal background fluorescence, confirming that the observed signals in stained samples originated predominantly from the dyes rather than autofluorescence (Figure 2A). Similar observations of low autofluorescence–critical for accurate fluorescence interpretation–have been reported in studies of environmental microbes, including both living and heat-treated bacterial samples29,30).
These results demonstrate that SlowFade™ Diamond combined with SYBR Green I is optimal for sensitive and reproducible visualization of MC49 cells. The findings also emphasize the importance of optimized staining and imaging protocols, as mounting medium and dye choice can significantly affect signal quality. The results obtained correspond with prior imaging studies on Methylosinus species and other methanotrophs, confirming the effectiveness of SYBR Green I and DAPI stains for cellular visualization10,31–34). However, the presence of significant autofluorescence in MC49 introduces a novel consideration that, to our knowledge, has been less emphasized in previous reports35–38). Similarly, while metals like copper play crucial roles in methane monooxygenase enzyme activity, direct autofluorescence caused by metal accumulation is generally weak and not well-documented in bacterial cells. Instead, bacterial autofluorescence primarily arises from endogenous metabolic cofactors such as flavins and nicotinamide adenine dinucleotide (NADH), which are known to fluoresce naturally37,38,40). Therefore, the autofluorescence signals detected in MC49 are more likely attributable to such endogenous compounds.
While autofluorescence has been reported in various environmental microorganisms29,41–43), to our knowledge, this is the first documentation of such signals in a Type II methanotroph of the genus Methylosinus. This observation underscores the critical importance of including unstained controls and optimizing imaging parameters to accurately distinguish true fluorescent signals from autofluorescence, thereby preventing misinterpretation in fluorescence-based analyses, particularly those involving methanotroph enumeration and structural characterization. Moreover, autofluorescence may be extended to a non-toxic, non-invasive cell-monitoring technique in which the physiological state is not compromised, as is often observed by fluorescent dye staining. Further studies using advanced imaging or spectroscopic methods will be valuable to conclusively identify the biochemical origins of autofluorescence in Methylosinus sp. strain C49.
3.3. Genetic Integrity and Purity Assessment of MC49 via PCR-RFLP Analysis
Bacterial populations, including laboratory-grown strains, can undergo genetic and physiological changes over successive subcultures and varying environmental conditions. Such changes may impact their metabolic activity and experimental reproducibility. To ensure the genetic integrity and purity of MC49 cultures used throughout this study, PCR-RFLP analysis targeting the 16S rRNA gene was performed following HhaI digestion. PCR amplicons derived from MC49 DNA samples were obtained from various sources, including the original stock, remade cryostocks using DMSO or glycerol, subcultures subjected to prolonged stationary-phase starvation (>60 days), cultures grown under different pH conditions, samples prepared using distinct sterilization methods, and multiple subculture generations. These amplicons were digested with HhaI and analyzed by agarose gel electrophoresis (Figure 4). The resulting RFLP profiles revealed highly conserved banding patterns across all non-
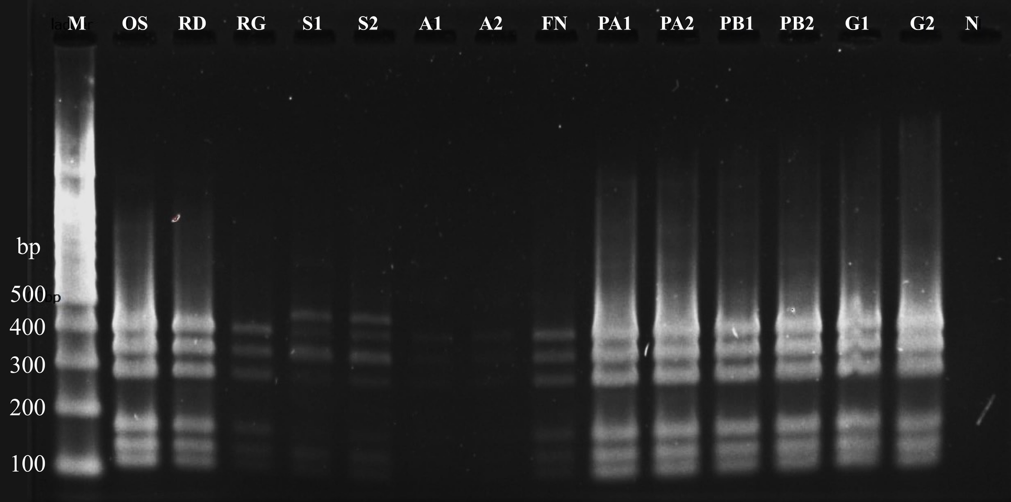
starvation samples, with bands observed at 125, 150, 180, 290, 350, and 400 bp. Fifth-generation subcultures exhibited identical profiles to the original parental stock, confirming genetic stability through successive passages.
Samples subjected to extended starvation (lanes S1 and S2) displayed an additional band at ~450 bp, which may indicate genetic variation arising during prolonged nutrient limitation. However, contamination during long-term cultivation cannot be completely ruled out by PCR-RFLP analysis alone. Nevertheless, contamination was considered unlikely because all other experimental samples exhibited identical restriction patterns despite different cultivation conditions, cryopreservation methods, and repeated subculturing, while the negative control showed no amplification. This observation aligns with previous reports that prolonged stationary-phase incubation could induce mutations due to reduced DNA replication fidelity and repair mechanisms44–47). Therefore, the appearance of the additional restriction fragment following extended stationary-phase starvation may reflect genetic diversification or minor mutational variants induced by prolonged nutrient deprivation, consistent with previous observations of mutation accumulation during the stationary phase44–50). Alternatively, the observed band may represent a rare contamination event that cannot be resolved by PCR-RFLP alone. Consequently, complementary approaches such as whole-genome sequencing would be required to conclusively distinguish between these possibilities. These findings underscore the importance of careful culture handling and monitoring during long-term or repeated experimentation.
4. Conclusion
The growth characterizations of Methylosinus sp. strain C49 (MC49) demonstrated that MC49 exhibited a prolonged lag phase, with active growth initiating around day 10 and peaking by day 14 under methane-rich conditions. Fluorescence microscopy using SlowFade™ Diamond antifade mountant combined with SYBR Green I staining provided robust visualization while minimizing cytotoxic effects. Genetic analyses via PCR-RFLP supported the strain’s stability across multiple subcultures, cryopreservation methods, and culture conditions, although extended starvation induced minor genetic variations. While PCR-RFLP represents one of several tools for monitoring culture integrity, its inclusion here highlights a practical approach to quality control in methanotroph research. These results underscore the importance of maintaining stringent culture conditions and ensuring quality control in methanotroph research. The workflow presented here provides a reliable framework for reproducible studies of MOB and can be readily adapted for future research in methane mitigation, microbial culture collections, and synthetic biology, including biopolymer production.
CRediT authorship contribution statement
Conceptualization, J.M. and A.T.; Methodology, J.M. and A.T.; Validation, J.M. and A.T.; Formal analysis, J.M.; Investigation, J.M.; Data curation, J.M.; Writing – original draft, J.M.; Writing – review & editing, J.M. and A.T.; Visualization, J.M.; Supervision, A.T.; Project administration, A.T.; Funding acquisition, A.T. All authors have read and agreed to the published version of the manuscript.
Declaration of competing interest
The authors declare no conflicts of interest related to the research, authorship, or publication of this manuscript.
Data availability
All data supporting the findings of this study are contained within the manuscript. Additional raw datasets, including fluorescence microscopy images and PCR-RFLP electrophoresis profiles, are available from the corresponding author upon reasonable request.
Acknowledgements
We sincerely thank Dr. Shohei Yasuda for providing the Methylosinus sp. strain C49 and for his expert guidance on cultivation protocols. We also extend our gratitude to the late Mrs. Kanako Mori for her invaluable assistance with DNA extraction and molecular techniques. This study was financially supported by the Japan Science and Technology Agency (Grant Number JPMJPF2104).
Nomenclature
| Symbol | Description |
|---|---|
| DAPI | 4′,6-diamidino-2-phenylindole (DNA-binding fluorescent stain) |
| DMSO | Dimethyl sulfoxide |
| FISH | Fluorescence in situ hybridization |
| GWP | Global warming potential |
| MC49 | Methylosinus sp. strain C49 |
| MOB | Methane-oxidizing bacteria |
| NMS | Nitrate mineral salts medium |
| OD600 | Optical density at 600 nm |
| PBS | Phosphate-buffered saline |
| PCR | Polymerase chain reaction |
| PHA | Polyhydroxyalkanoate |
| RFLP | Restriction fragment length polymorphism |
| TAE | Tris-acetate-EDTA buffer |
References
- Intergovernmental Panel on Climate Change (IPCC), “Climate Change 2021 – The Physical Science Basis: Working Group I Contribution to the Sixth Assessment Report of the Intergovernmental Panel on Climate Change,” 1st ed., Cambridge University Press, 2023. doi:10.1017/9781009157896.
- R.B. Jackson, M. Saunois, P. Bousquet, J.G. Canadell, B. Poulter, A.R. Stavert, P. Bergamaschi, Y. Niwa, A. Segers, and A. Tsuruta, “Increasing anthropogenic methane emissions arise equally from agricultural and fossil fuel sources,” Environ. Res. Lett., 15 (7) 071002 (2020). doi:10.1088/1748-9326/ab9ed2.
- R.S. Hanson and T.E. Hanson, “Methanotrophic bacteria,” Microbiol. Rev., 60 (2) 439–471 (1996). doi:10.1128/mr.60.2.439-471.1996.
- P.J. Strong, S. Xie, and W.P. Clarke, “Methane as a resource: can the methanotrophs add value?,” Environ. Sci. Technol., 49 (7) 4001–4018 (2015). doi:10.1021/es504242n.
- M.G. Kalyuzhnaya, A.W. Puri, and M.E. Lidstrom, “Metabolic engineering in methanotrophic bacteria,” Metab. Eng., 29 142–152 (2015). doi:10.1016/j.ymben.2015.03.010.
- J.D. Semrau, A.A. DiSpirito, and S. Yoon, “Methanotrophs and copper,” FEMS Microbiol. Rev., 34 (4) 496–531 (2010). doi:10.1111/j.1574-6976.2010.00212.x.
- S. Cantera, S. Bordel, R. Lebrero, J. Gancedo, P.A. García-Encina, and R. Muñoz, “Bio-conversion of methane into high profit margin compounds: an innovative, environmentally friendly and cost-effective platform for methane abatement,” World J. Microbiol. Biotechnol., 35 (1) 16 (2019). doi:10.1007/s11274-018-2587-4.
- S. Yasuda, R. Toyoda, S. Agrawal, T. Suenaga, S. Riya, T. Hori, S. Lackner, M. Hosomi, and A. Terada, “Exploration and enrichment of methane-oxidizing bacteria derived from a rice paddy field emitting highly concentrated methane,” J. Biosci. Bioeng., 130 (3) 311–318 (2020). doi:10.1016/j.jbiosc.2020.04.006.
- S. Yasuda, T. Suenaga, and A. Terada, “Complete genome sequence of Methylosinus sp. strain C49, a methane-oxidizing bacterium harboring phaABC genes for polyhydroxyalkanoate synthesis,” Microbiol. Resour. Announc., 9 (27) e00113-20 (2020). doi:10.1128/MRA.00113-20.
- J. Magomnang, S. Yasuda, D. Inoue, and A. Terada, “Bioplastic production potential, growth optimization, and biokinetics of methane-oxidizing bacterium Methylosinus sp. strain C49,” Bioresour. Technol., 437 133075 (2025). doi:10.1016/j.biortech.2025.133075.
- J. Magomnang, S. Yasuda, S. Hirai, D. Inoue, and A. Terada, “Synergistic pH and feast-famine regulation of polyhydroxyalkanoate biosynthesis in a methane‑oxidizing bacterium,” Biochem. Eng. J., 230 110124 (2026). doi:10.1016/j.bej.2026.110124.
- K.R. Tate, “Soil methane oxidation and land-use change – from process to mitigation,” Soil Biol. Biochem., 80 260–272 (2015). doi:10.1016/j.soilbio.2014.10.010.
- R. Conrad, “The global methane cycle: recent advances in understanding the microbial processes involved,” Environ. Microbiol. Rep., 1 (5) 285–292 (2009). doi:10.1111/j.1758-2229.2009.00038.x.
- R.C. She and S.M. Butler-Wu, “Procedures for the Storage of Microorganisms,” Clin. Micro. Now, 1–11 (2023). doi:10.1002/9781683670438.mcm0013.
- B.I. Tarnowski, F.G. Spinale, and J.H. Nicholson, “DAPI as a useful stain for nuclear quantitation,” Biotech. Histochem., 66 (6) 296–302 (1991). doi:10.3109/10520299109109990.
- S. Hoefman, K. Van Hoorde, N. Boon, P. Vandamme, P. De Vos, and K. Heylen, “Survival or revival: long-term preservation induces a reversible viable but non-culturable state in methane-oxidizing bacteria,” PLoS ONE, 7 (4) e34196 (2012). doi:10.1371/journal.pone.0034196.
- R. Whittenbury, K.C. Phillips, and J.F. Wilkinson, “Enrichment, isolation and some properties of methane-utilizing bacteria,” J. Gen. Microbiol., 61 (2) 205–218 (1970). doi:10.1099/00221287-61-2-205.
- J. Feng, T. Wang, S. Zhang, W. Shi, and Y. Zhang, “An optimized SYBR Green I/PI assay for rapid viability assessment and antibiotic susceptibility testing for Borrelia burgdorferi,” PLoS ONE, 9 (11) e111809 (2014). doi:10.1371/journal.pone.0111809.
- J. Feng, R. Yee, S. Zhang, L. Tian, W. Shi, W.-H. Zhang, and Y. Zhang, “A rapid growth-independent antibiotic resistance detection test by SYBR Green/propidium iodide viability assay,” Front. Med., 5, 127 (2018). doi:10.3389/fmed.2018.00127.
- Thermo Fisher Scientific, “SlowFade™ Antifade Mountants: User Guide,” (2020). https://assets.thermofisher.com/TFS-Assets/LSG/manuals/MAN0018916_SlowFadeMountant_UG.pdf (accessed July 13, 2025).
- T. Suenaga, S. Riya, M. Hosomi, and A. Terada, “Biokinetic characterization and activities of N2O-reducing bacteria in response to various oxygen levels,” Front. Microbiol., 9 697 (2018). doi:10.3389/fmicb.2018.00697.
- F.O. Glöckner, R. Amann, A. Alfreider, J. Pernthaler, R. Psenner, K. Trebesius, and K.-H. Schleifer, “An in situ hybridization protocol for detection and identification of planktonic bacteria,” Syst. Appl. Microbiol., 19 (3) 403–406 (1996). doi:10.1016/S0723-2020(96)80069-5.
- A.C. López and A.M. Alippi, “Feasibility of using RFLP of PCR-amplified 16S rRNA gene(s) for rapid differentiation of isolates of aerobic spore-forming bacteria from honey,” J. Microbiol. Methods, 165 105690 (2019). doi:10.1016/j.mimet.2019.105690.
- I.G.C. Leite, G. Benard, S.C. Cavalcanti, V.R. Bollela, G.M.B. Del Negro, R. Martinez, V.M.F. Gimenes, and T.A. Cocio, “Comparison between PCR–RFLP and sequencing techniques in the analysis of Paracoccidioides spp. biodiversity: limitations and insights into species and variant differentiation,” Mycopathologia, 189 (6) 97 (2024). doi:10.1007/s11046-024-00902-w.
- J.A. Frank, C.I. Reich, S. Sharma, J.S. Weisbaum, B.A. Wilson, and G.J. Olsen, “Critical Evaluation of Two Primers Commonly Used for Amplification of Bacterial 16S rRNA Genes,” Appl. Environ. Microbiol., 74 (8) 2461–2470 (2008). doi:10.1128/AEM.02272-07.
- S. Hoefman, D. Van der Ha, N. Boon, P. Vandamme, P. De Vos, and K. Heylen, “Niche differentiation in nitrogen metabolism among methanotrophs within an operational taxonomic unit,” BMC Microbiol., 14 (1) 83 (2014). doi:10.1186/1471-2180-14-83.
- N.V. Doronina, V.A. Ezhov, and Yu.A. Trotsenko, “Growth of Methylosinus trichosporium OB3b on methane and poly-β-hydroxybutyrate biosynthesis,” Appl. Biochem. Microbiol., 44 (2) 182–185 (2008). doi:10.1134/S0003683808020099.
- S.N. Dedysh, C. Knief, and P.F. Dunfield, “Methylocella species are facultatively methanotrophic,” J. Bacteriol., 187 (13) 4665–4670 (2005). doi:10.1128/JB.187.13.4665-4670.2005.
- X. Hou, S. Liu, and Y. Feng, “The autofluorescence characteristics of bacterial intracellular and extracellular substances during the operation of anammox reactor,” Sci. Rep., 7 (1) 39289 (2017). doi:10.1038/srep39289.
- T. Tominaga, K. Fujioka, M. Hijikuro, T. Tada, and Y. Nishikawa, “Mechanism of increased microbial autofluorescence by heat treatment,” Lett. Appl. Microbiol., 66 (2) 118–123 (2018). doi:10.1111/lam.12828.
- C. Griebler, B. Mindl, and D. Slezak, “Combining DAPI and SYBR Green II for the enumeration of total bacterial numbers in aquatic sediments,” Internat. Rev. Hydrobiol., 86 (4–5) 453–465 (2001). doi:10.1002/1522-2632(200107)86:4/5<453::AID-IROH453>3.0.CO;2-L. [DOI]
- R. Zuriani, S. Vigneswari, M.N.M. Azizan, M.I.A. Majid, and A.A. Amirul, “A high throughput Nile Red fluorescence method for rapid quantification of intracellular bacterial polyhydroxyalkanoates,” Biotechnol. Bioproc. Eng., 18 (3) 472–478 (2013). doi:10.1007/s12257-012-0607-z.
- A.T. Tveit, A.G. Hestnes, S.L. Robinson, A. Schintlmeister, S.N. Dedysh, N. Jehmlich, M. Von Bergen, C. Herbold, M. Wagner, A. Richter, and M.M. Svenning, “Widespread soil bacterium that oxidizes atmospheric methane,” Proc. Natl. Acad. Sci. U.S.A., 116 (17) 8515–8524 (2019). doi:10.1073/pnas.1817812116.
- M.G. Weinbauer, C. Beckmann, and M.G. Höfle, “Utility of green fluorescent nucleic acid dyes and aluminum oxide membrane filters for rapid epifluorescence enumeration of soil and sediment bacteria,” Appl. Environ. Microbiol., 64 (12) 5000–5003 (1998). doi:10.1128/AEM.64.12.5000-5003.1998.
- W.M. Reed and P.R. Dugan, “Study of developmental stages of Methylosinus trichosporium with the aid of fluorescent-antibody staining techniques,” Appl. Environ. Microbiol., 38 (6) 1179–1183 (1979). doi:10.1128/aem.38.6.1179-1183.1979.
- M.C. Konopka, T.J. Strovas, D.S. Ojala, L. Chistoserdova, M.E. Lidstrom, and M.G. Kalyuzhnaya, “Respiration response imaging for real-time detection of microbial function at the single-cell level,” Appl. Environ. Microbiol., 77 (1) 67–72 (2011). doi:10.1128/AEM.01166-10.
- L. Müllerová, K. Marková, S. Obruča, and F. Mravec, “Use of flavin-related cellular autofluorescence to monitor processes in microbial biotechnology,” Microorganisms, 10 (6) 1179 (2022). doi:10.3390/microorganisms10061179.
- O.I. Kolenc and K.P. Quinn, “Evaluating cell metabolism through autofluorescence imaging of NAD(P)H and FAD,” Antioxid. Redox Signal., 30 (6) 875–889 (2019). doi:10.1089/ars.2017.7451.
- P. Spiekermann, B.H.A. Rehm, R. Kalscheuer, D. Baumeister, and A. Steinbüchel, “A sensitive, viable-colony staining method using Nile Red for direct screening of bacteria that accumulate polyhydroxyalkanoic acids and other lipid storage compounds,” Arch. Microbiol., 171 (2) 73–80 (1999). doi:10.1007/s002030050681.
- S. Dixneuf, A.-C. Chareire-Kleiberg, P. Mahé, M. El Azami, C. Kolytcheff, S. Bellais, C. Guyard, C. Védrine, F. Mallard, Q. Josso, and F. Rol, “Single-cell scattering and auto-fluorescence-based fast antibiotic susceptibility testing for gram-negative and gram-positive bacteria,” Front. Microbiol., 14 1232250 (2023). doi:10.3389/fmicb.2023.1232250.
- T.R. Neu and J.R. Lawrence, “Advanced Techniques for In Situ Analysis of the Biofilm Matrix (Structure, Composition, Dynamics) by Means of Laser Scanning Microscopy,” in: G. Donelli (Ed.), Microbial Biofilms, Springer New York, New York, NY (2014), pp. 43–64. doi:10.1007/978-1-4939-0467-9_4.
- S. Renggli, W. Keck, U. Jenal, and D. Ritz, “Role of autofluorescence in flow cytometric analysis of Escherichia coli treated with bactericidal antibiotics,” J. Bacteriol., 195 (18) 4067–4073 (2013). doi:10.1128/JB.00393-13.
- M. Stratigaki, “Autofluorescence for the visualization of microorganisms in biodeteriorated materials in the context of cultural heritage,” ChemPlusChem, 89 (11) e202400170 (2024). doi:10.1002/cplu.202400170.
- P.D. Sniegowski, P.J. Gerrish, and R.E. Lenski, “Evolution of high mutation rates in experimental populations of E. coli,” Nature, 387 (6634) 703–705 (1997). doi:10.1038/42701.
- S.E. Finkel and R. Kolter, “Evolution of microbial diversity during prolonged starvation,” Proc. Natl. Acad. Sci. U.S.A., 96 (7) 4023–4027 (1999). doi:10.1073/pnas.96.7.4023.
- S. Katz, S. Avrani, M. Yavneh, S. Hilau, J. Gross, and R. Hershberg, “Dynamics of adaptation during three years of evolution under long-term stationary phase,” Mol. Biol. Evol., 38 (7) 2778–2790 (2021). doi:10.1093/molbev/msab067.
- S. Chib, F. Ali, and A.S.N. Seshasayee, “Genomewide mutational diversity in Escherichia coli population evolving in prolonged stationary phase,” mSphere, 2 (3) e00059-17 (2017). doi:10.1128/msphere.00059-17.
- P.L. Foster, “Nonadaptive mutations occur on the F’ episome during adaptive mutation conditions in Escherichia coli,” J. Bacteriol., 179 (5) 1550–1554 (1997). doi:10.1128/jb.179.5.1550-1554.1997.
- J. Gross, S. Avrani, S. Katz, S. Hilau, and R. Hershberg, “Culture volume influences the dynamics of adaptation under long-term stationary phase,” Genome Biol. Evol., 12 (12) 2292–2301 (2020). doi:10.1093/gbe/evaa210.
- W.R. Shoemaker, S.E. Jones, M.E. Muscarella, M.G. Behringer, B.K. Lehmkuhl, and J.T. Lennon, “Microbial population dynamics and evolutionary outcomes under extreme energy limitation,” Proc. Natl. Acad. Sci. U.S.A., 118 (33) e2101691118 (2021). doi:10.1073/pnas.2101691118.